
Abstract
Background:
Sarcopenia now constitutes a serious issue that can affect the obese adult population. The aims of our study were to estimate the prevalence of sarcopenia in a group of obese patients, investigate the impact of sarcopenic obesity (SO) on patient health and quality of life, and identify its risk factors.
Methods:
We conducted a cross-sectional descriptive observational study of a group of obese adult patients. Physical activity was assessed with the Ricci and Gagnon questionnaire and quality of life was evaluated using the SF-12 and ORWELL-97 questionnaires. SO was defined in accordance with the EASO-ESPEN consensus statement.
Results:
We included 100 patients with a mean age of 44.42 ± 13.25 years. SO was diagnosed in 19% of the study population. The assessment of the impact of SO revealed that it was associated with osteoarthritis (P < .0001), functional disability (P = .001) and obesity-specific quality of life impairment (P < .0001). SO was associated with lower education levels (P = .011), a low score in the daily physical activities’ dimension of the Ricci and Gagnon score (P = .028), class 2 obesity (P = .032), elevated blood triglyceride levels (P = .019), potassium and manganese intake deficiency (P = .042 and P = .004, respectively). Non-sarcopenic obese patients had a higher frequency of a history of weight loss interventions (P = .038), excess protein intake (P = .042), and excess lipid intake (P = .011). Multivariate analysis identified class 2 obesity (P = .048), osteoarthritis (P = .038), elevated triglyceride levels (P = .049), manganese deficiency intake (P = .026), increased score in the daily physical activities’ dimension (P = .048), increased gait speed (P = .025) and excess fat intake (P = .047) as factors independently associated with SO.
Conclusion:
It is essential to incorporate the screening for sarcopenia into the therapeutic approach for obese adult patients due to its clinical consequences and impact on individuals’ quality of life.
Introduction
Considered as the first non-infectious pandemic in history, obesity constitutes a major health issue with a steadily increasing prevalence. Projections by the World Obesity Federation suggest that by 2030, more than 1 billion adults worldwide will be living with obesity. 1 Sarcopenia, defined by the European Working Group on Sarcopenia in Older People (EWGSOP2) as low muscle strength combined with low muscle mass, is typically associated with aging but can also develop early in life influenced by factors such as obesity. 2 This intersection has led to the recognition of sarcopenic obesity (SO) characterized by the combination of excess fat mass and reduced muscle mass. 3
Obesity independently causes both quantitative and qualitative muscle loss, primarily due to low-grade inflammation, oxidative stress, and insulin resistance from fat accumulation, as well as the sedentary lifestyle often associated with obesity. 4 Conversely, sarcopenia reduces physical activity and basal energy expenditure, promoting weight gain. 5 Thus, sarcopenia and obesity create a vicious cycle of fat gain and muscle loss. This reciprocal relationship exacerbates metabolic and cardiovascular risks associated with SO. Moreover, SO significantly impairs quality of life by limiting physical function, increasing the risk of falls, and potentially leading to dependence. 6 The absence of universally accepted diagnostic criteria has contributed to the underestimation of this condition.
Based on these considerations, the purposes of the current study were to estimate the prevalence of sarcopenia in a population of obese patients, to investigate the impact of SO on patient health and quality of life and to identify its risk factors.
Subjects and Methods
Study Design and Population
We conducted a cross-sectional descriptive observational study that included 100 obese patients. Eligible participants were adults (⩾18 years) with a body mass index (BMI) ⩾ 30 kg/m². We excluded pregnant and lactating women, insulin-dependent diabetics, individuals with neuromuscular or motor disabilities, cancer, kidney or liver diseases, unstable endocrine disorders, those who had undergone bariatric surgery, users of body-altering medications (eg, corticosteroids, diuretics), pacemaker users, and alcohol consumers. Data on socio-demographic and economic characteristics, medical history, co-morbid conditions, and obesity history were collected through interviews.
Every patient underwent a thorough physical examination, which was complemented with anthropometric measurements including weight (W), height (H), waist circumference (WC), triceps skinfold thickness and brachial circumference. The brachial muscle circumference (BMC) was calculated, with a normal BMC corresponding to 25 ± 1 cm in adult men and 21.5 ± 1.5 cm in adult women. 7 Body composition was assessed using the SECA MBCA 515 bioimpedance analyzer, and muscle function evaluation was based on handgrip strength measurement. The assessment of muscle mass was based on both ratios: skeletal muscle mass (SMM) to weight and appendicular muscle mass (ASM) to weight. Physical performance was measured by gait speed over 4 m, and functional impairment was identified as a walking speed below 0.8 m/s. SO was defined in accordance with the 2022 EASO-ESPEN consensus statement. 8 Likewise, biochemical analyses were conducted for all patients including glycemic parameters, lipidic parameters, liver and renal function tests, biological nutritional parameters, ultra-sensitive CRP levels (us-CRP) and 25(OH) vitamin D levels. HOMA-IR was calculated in order to evaluate the presence of insulin resistance. We considered us-CRP ⩾ 1 mg/l as indicative of low-grade inflammation. The diagnosis of liver steatosis was based on abdominal ultrasound findings. Food intake of each patient was analyzed for energy, macronutrients, and micronutrients intake by using Nutrilog software, based on the CIQUAL 2020 composition table validated and provided by the ANSES.
Patient’s Questionnaires
Ricci and Gagnon Questionnaire
The level of physical activity was assessed using the Ricci and Gagnon auto-questionnaire provided by the French National Authority for Health. 9 It consists of 9 questions distributed across 3 dimensions: sedentary behaviors, leisure-time physical activities and daily physical activities. The total score is computed and classifies the individual into 1 of 3 categories: inactive (total score below 18), active (total score between 18 and 35) or very active (total score exceeding 35).
SF-12 Questionnaire
The SF-12 questionnaire, derived from the SF36 scale developed by Ware et al. was employed to assess the overall quality of life. 10 This questionnaire calculates 2 scores: a mental component summary (MCS) and a physical component summary (PCS), distributed across 12 multiple-choice items within 8 different scales. The PCS and MCS scores range from 0 to 100, where scores below 50 indicate impairment in physical and mental quality of life, respectively. A higher score reflects better quality of life. In this study, the validated version in Tunisian dialect was employed.
ORWELL-97 Questionnaire
Quality of life related to obesity was assessed using the ORWELL-97 questionnaire. 11 The ORWELL-97 score consists of 2 subscales: ORWELL-97-1, containing 13 items related to psychological well-being and social adaptation, and ORWELL-97-2, containing 5 items related to physical symptoms and impairment. The overall ORWELL-97 score was obtained by summing the scores assigned to different items. A higher score indicates a more impaired quality of life, and a total score ⩾ 71.75 was considered indicative of significant impairment in quality of life related to obesity.
Results
General characteristics of the study population are shown in Table 1.
General characteristics of the study population.

Abbreviations: ASM, appendicular muscle mass; BMI, body mass index; BMC, brachial muscle circumference; FMI, fat mass index; FFMI, fat free mass index; SMM, skeletal muscle mass.
Our study revealed that 19% of patients had SO, as determined by both the SMM/weight and ASM/weight ratios combined with reduced grip strength.
The distribution of the study population according to the health outcomes and overall quality of life domains compared between sarcopenic and non-sarcopenic obese patients, is illustrated in Tables 2 and 3.
Distribution of the study population according to health outcomes compared between sarcopenic and non-sarcopenic obese patients.
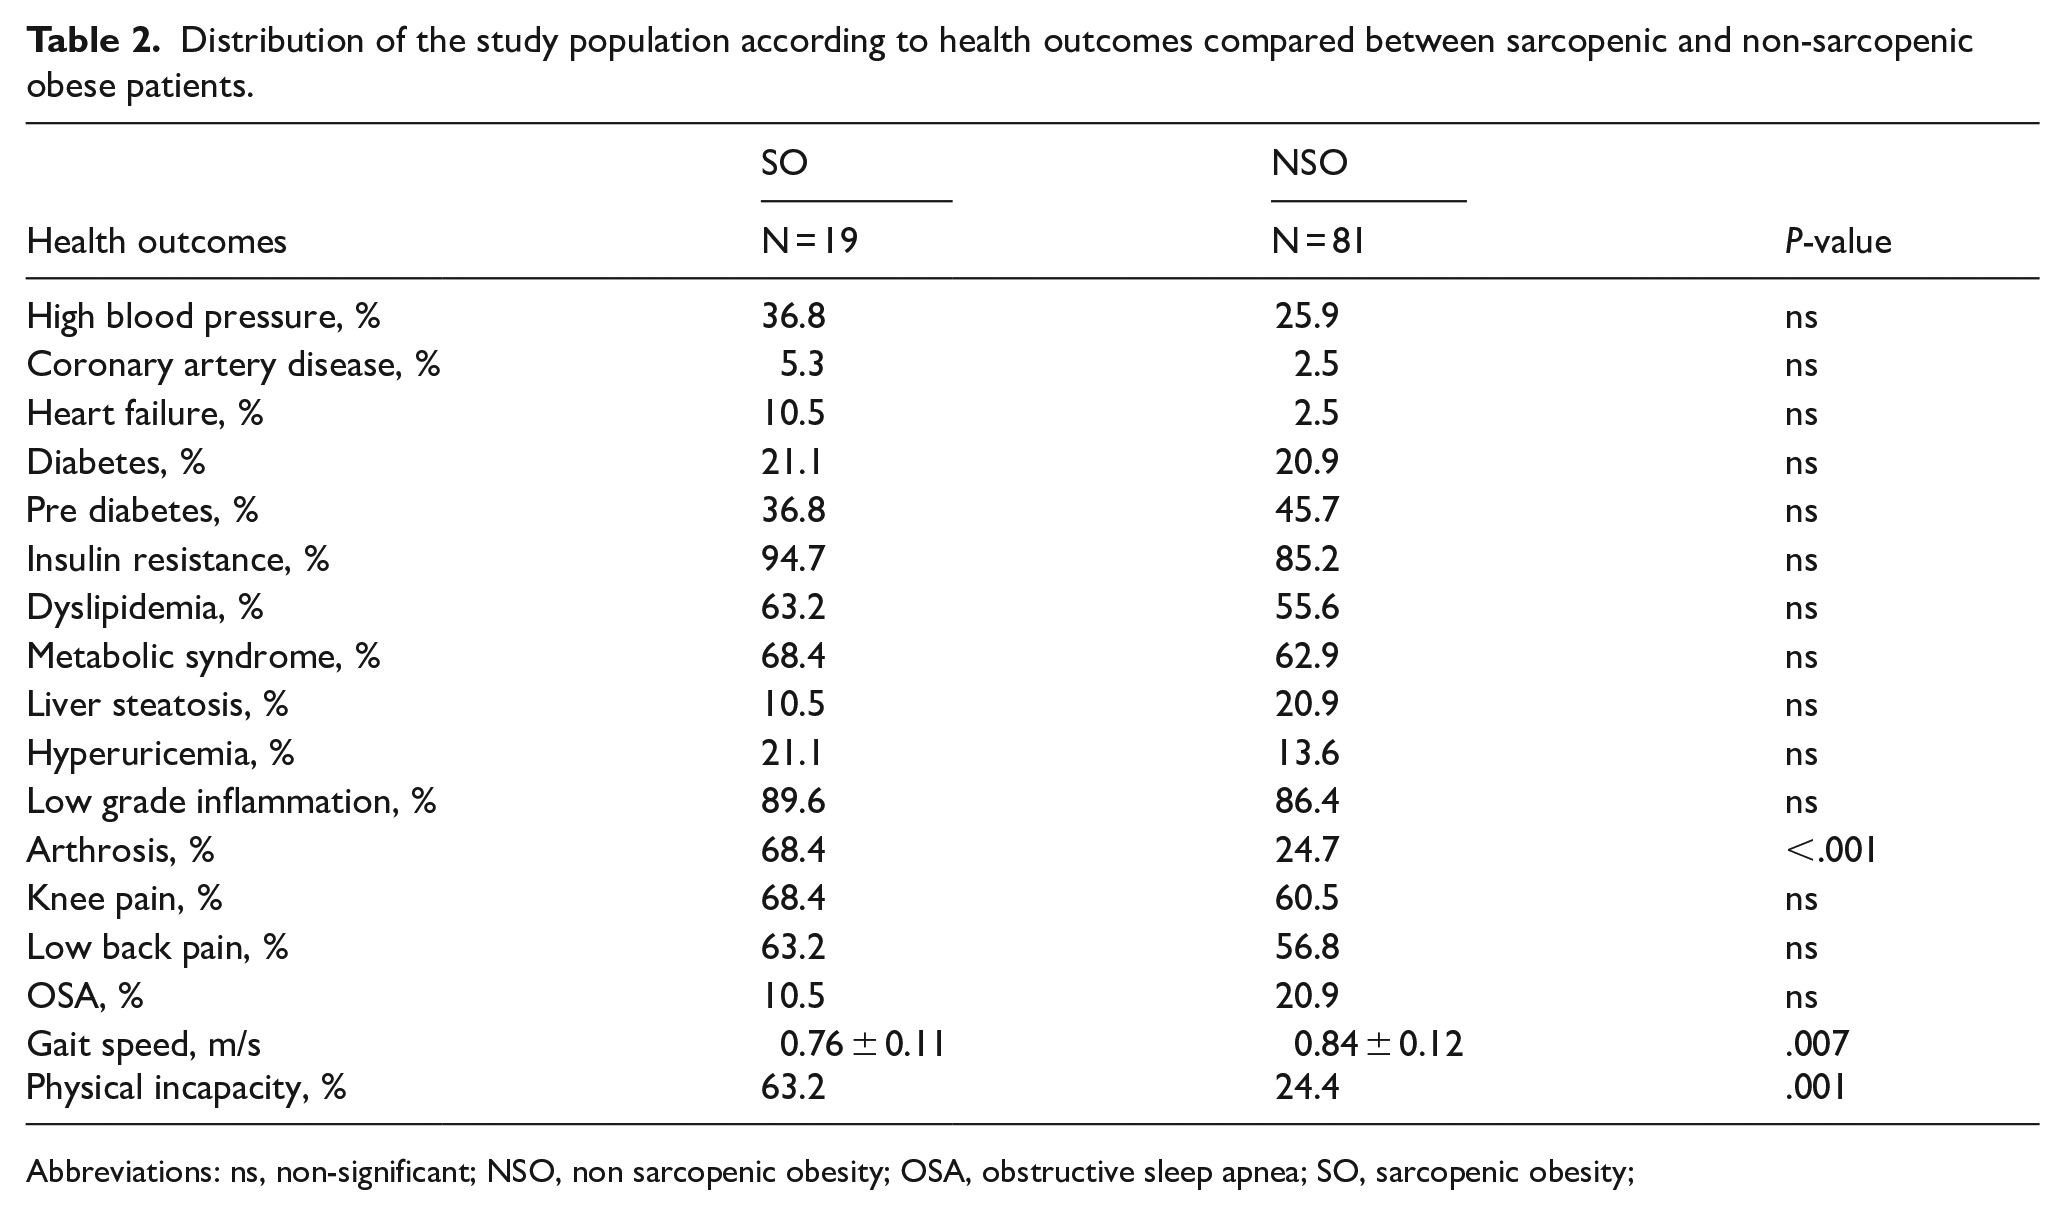
Abbreviations: ns, non-significant; NSO, non sarcopenic obesity; OSA, obstructive sleep apnea; SO, sarcopenic obesity;
Distribution of the study population according to domains of overall quality of life compared between sarcopenic and non-sarcopenic obese patients.

Abbreviations: MCS, mental component summary; ns, non-significant; NSO: non sarcopenic obesity; PCS: physical component summary; SO: sarcopenic obesity.
As for obesity-related specific quality of life, the ORWELL-97 score was significantly lower in SO patients (51.54 ± 16.96 vs 65 ± 16.92; P = .0001) with a significant association observed between impaired specific quality of life and SO (P < .0001).
The association between sarcopenic obesity and clinical-biological parameters, as well as dietary survey data, is illustrated in Tables 4 and 5.
Associations between sarcopenic obesity and clinical-biological parameters.

Abbreviations: BMC: brachial muscle circumference; BMI: body mass index; FBG: fasting blood glucose; FFM: fat free mass; FFMI: fat free mass index; FM: fat mass; FMI: fat mass index; HbA1c: glycated hemoglobin; hs-CRP: high-sensitivity C-reactive protein; LDLc: low-density lipoprotein cholesterol level; ns: non-significant; NSO: non-sarcopenic obesity; SO: sarcopenic obesity; TC: total cholesterol level; TG: triglyceride level; WC: waist circumference.
Associations between sarcopenic obesity and dietary survey data.
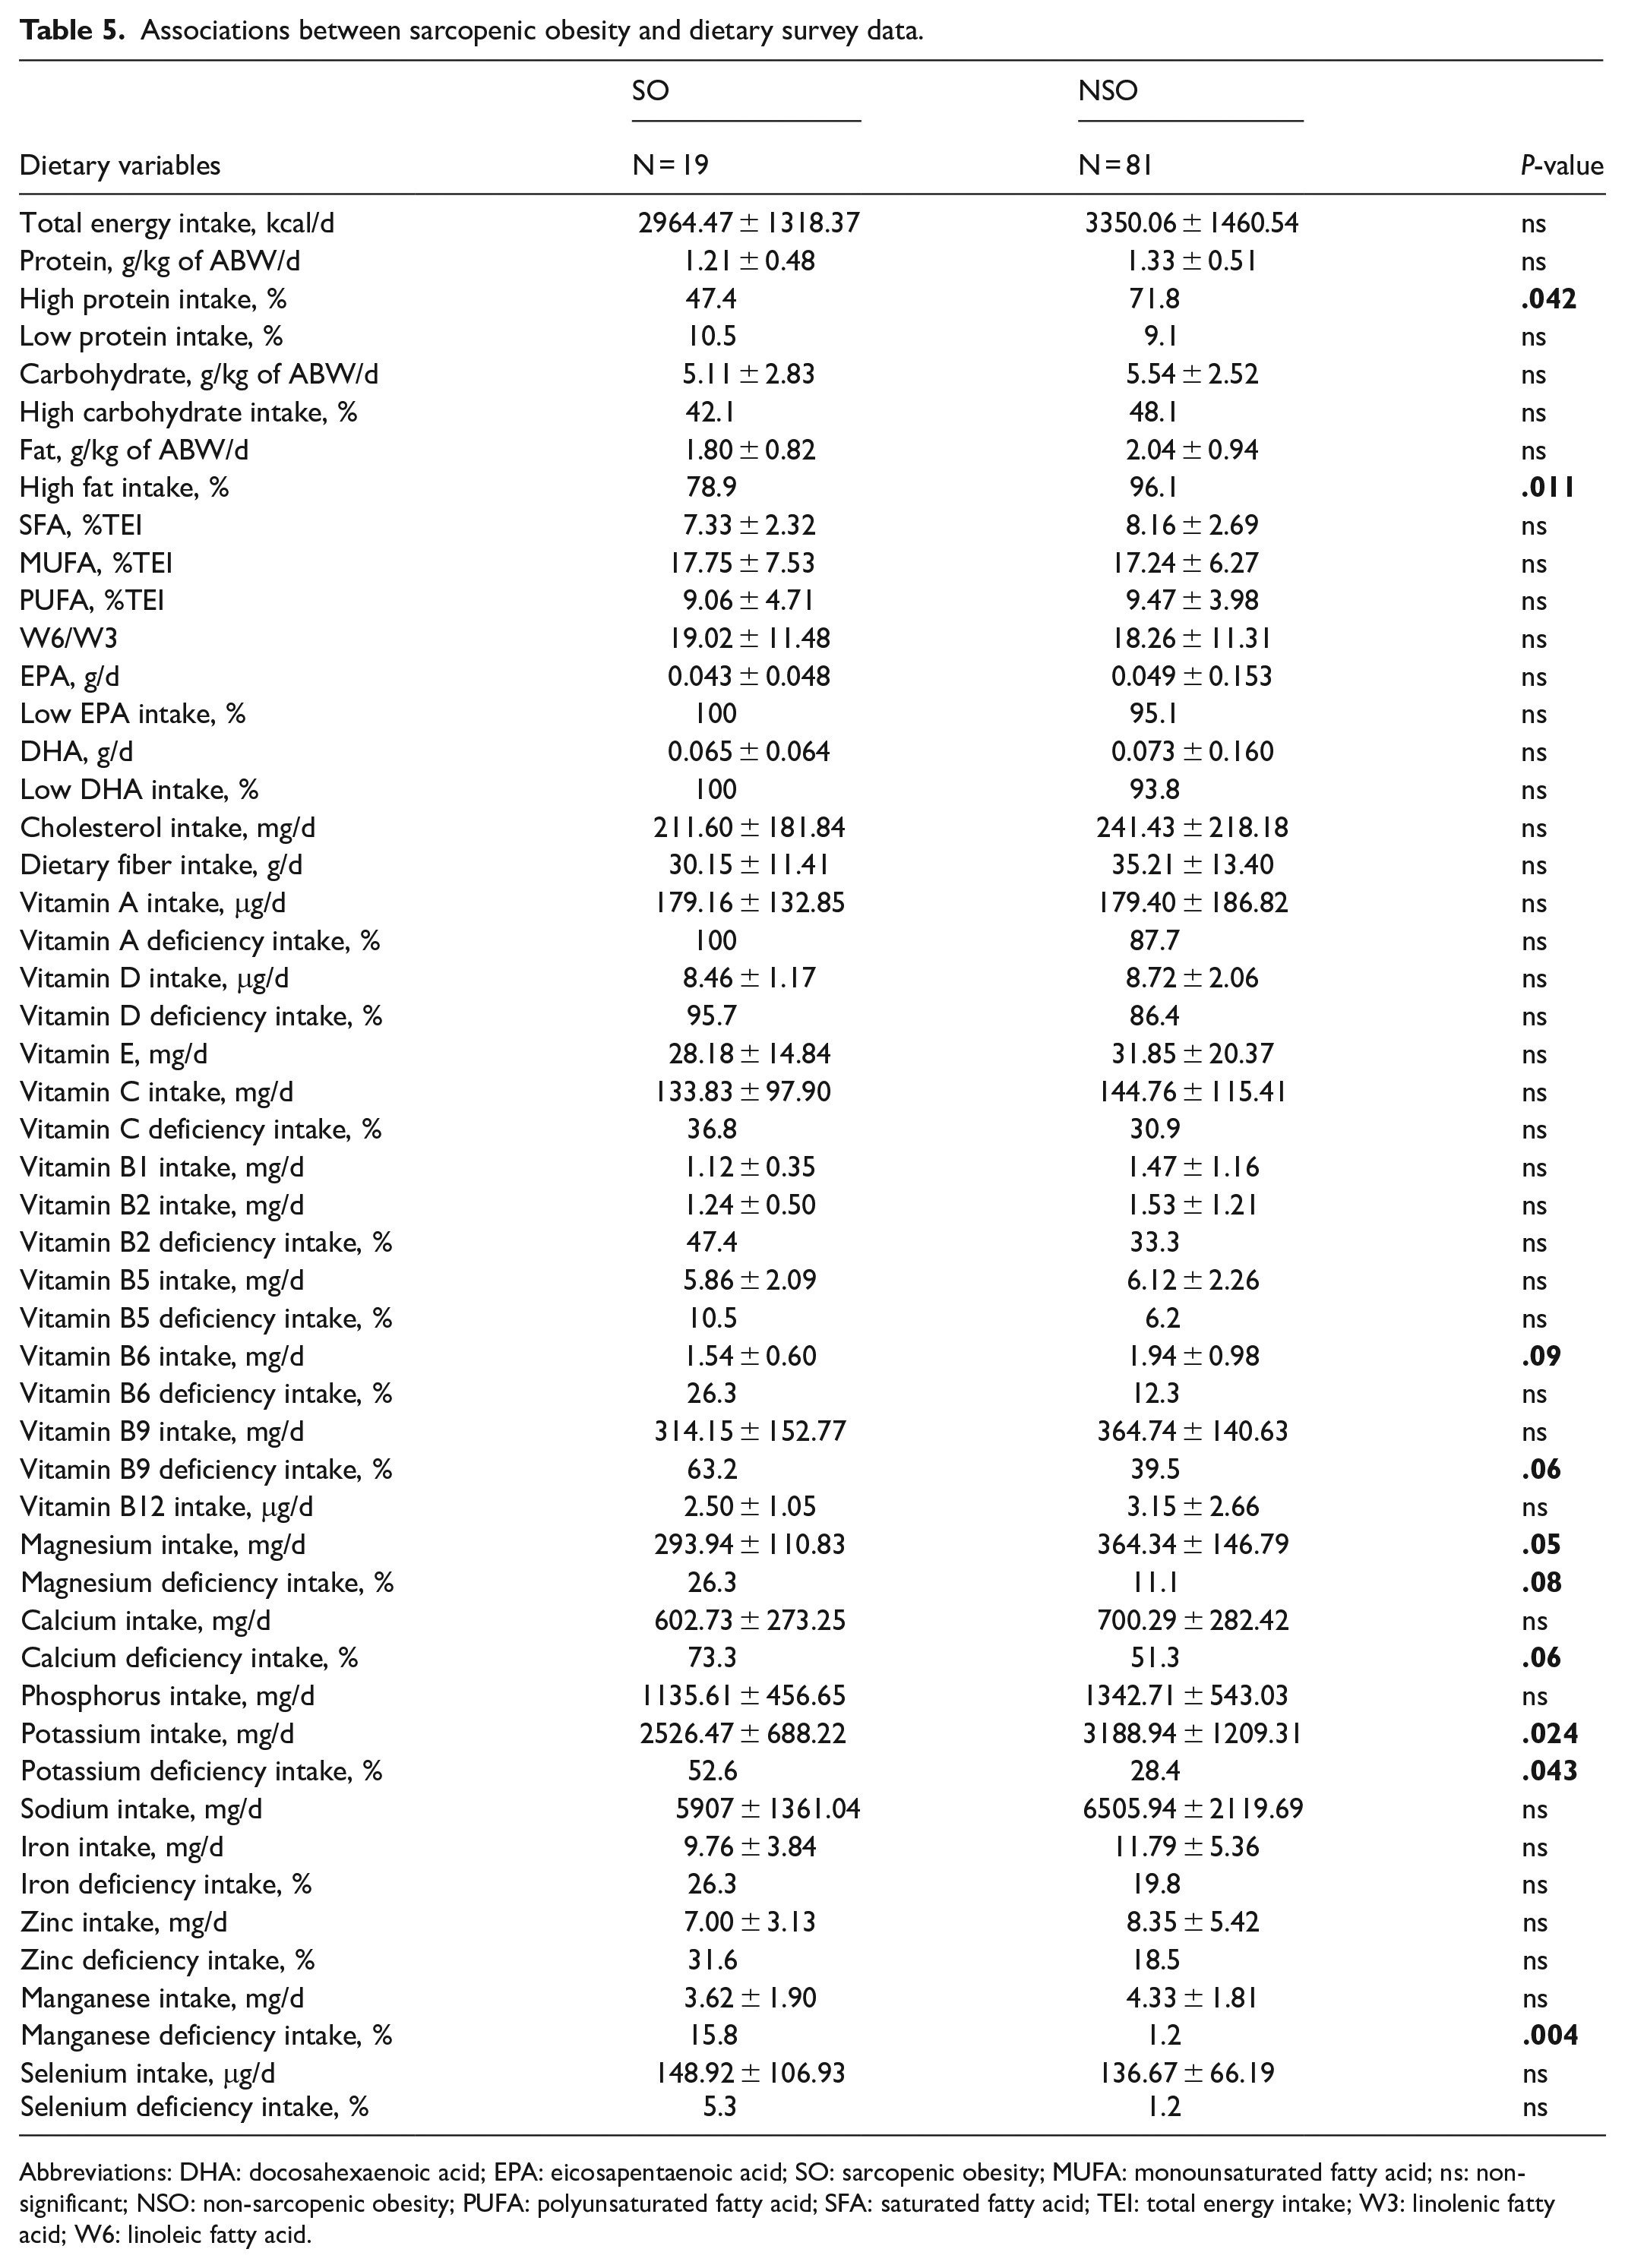
Abbreviations: DHA: docosahexaenoic acid; EPA: eicosapentaenoic acid; SO: sarcopenic obesity; MUFA: monounsaturated fatty acid; ns: non-significant; NSO: non-sarcopenic obesity; PUFA: polyunsaturated fatty acid; SFA: saturated fatty acid; TEI: total energy intake; W3: linolenic fatty acid; W6: linoleic fatty acid.
Multivariate analysis identified class 2 obesity (P = .048; OR = 5.81), osteoarthritis (P = .038; OR = 34.70), elevated triglyceride levels (P = .049; OR = 2.71), manganese deficiency (P = .026; OR = 17.40), increased score in the daily physical activities’ dimension (P = .048; OR = 0.502) increased gait speed (P = .025; OR = 0.007) and excess fat intake (P = .047; OR = 0.003) as factors independently associated with SO.
Discussion
While numerous international studies have examined sarcopenia in the elderly, few studies have been dedicated to investigating this clinical entity in the obese population, let alone in the adult population. Our study aimed to estimate the prevalence of sarcopenia in a group of obese patients, investigate its impact on patient health and quality of life and to identify its risk factors.
Our study revealed SO in 19% of the study population. This rate was comparable to those reported by Silva et al. 12 and Stoklossa et al. 13 which were 13.9% and 25%, respectively. However, higher frequencies were found in studies conducted in the Middle East and Europe.14,15 This variability could be explained primarily by the use of different diagnostic criteria. Some studies used diagnostic criteria that did not take into account the assessment of muscle strength in defining sarcopenia and these same studies found the highest frequencies of SO. On one hand, it has been demonstrated that this entity is more appropriate than muscle mass for predicting the consequences of sarcopenia, including the risk of falls, functional incapacity, frailty, and deterioration of quality of life. 16 On the other hand, it has been acknowledged that the relationship between muscle strength and muscle mass is bidirectional rather than linear. 17 Thus, defining sarcopenia only in terms of decreased muscle mass would have limited clinical value, hence its integration into the diagnostic criteria for sarcopenia in the consensus published in 2010 by the European Working Group on Sarcopenia in Older People (EWGSOP). Secondly, differences in muscle mass assessment criteria also contribute to variability. Many thresholds were developed for the elderly, based on ASM/height² or SMM/height² ratios, and may not suit obese adults, potentially underestimating the prevalence of sarcopenia. Adjusting muscle mass measurements according to BMI in obese individuals, as suggested by ESPEN and EASO, could provide more accurate results. Thirdly, the variability in these results could be attributed to the method used to estimate body composition. Although both DXA (dual-energy X-ray absorptiometry) and BIA (bioelectrical impedance analysis) as a second choice can be used to assess body composition, it should be noted that the use of BIA in obese individuals, especially with a BMI > 34 kg/m2, could lead to an underestimation of fat mass, and an overestimation of lean mass, contributing to result variabilities. 18 Finally, the criteria used to define obesity could influence the results. The consensus published by ESPEN and EASO suggests that SO should be considered as a single clinical entity, defined by elevated fat mass and decreased muscle mass and strength, derived from the bidirectional pathogenic interaction between fat accumulation and loss of skeletal muscle mass and function.
Regarding the effect of SO, our research showed that sarcopenic obese subjects had a significantly higher frequency of osteoarthritis than non-sarcopenic obese subjects. In multivariate analysis, our results revealed that the risk of having SO was approximately 34 times more frequent in the presence of osteoarthritis. Our results were consistent with those of Lee et al. 19 Kim et al’s 20 study highlighted the synergistic effect of obesity and sarcopenia on joint complications, specifically osteoarthritis. Indeed, excess weight and joint pain can reduce physical activity, leading to a cycle of inflammation, sedentary behavior, and muscle loss, which perpetuates SO. 21 Furthermore, it has been suggested that the loss of strength and/or muscle mass appears to precede or even sustain the progression of joint degeneration. 22
Our study found that over half of SO patients had functional impairment (P = .001). Chang et al 23 and De Campos et al 24 reported slower walking speeds in sarcopenic obese elderly subjects (P < .001 and P = .004, respectively). While walking speed tests are less common in adults. Moreira et al 25 found significant results with other physical performance indicators, such as the chair stand test (P = .009). The relationship between SO and functional impairment is likely bidirectional; functional impairment reduces energy expenditure, muscle mass, and increases fat mass, perpetuating both conditions. 24 Decreased physical performance predicts loss of autonomy in the elderly and may negatively impact body composition recovery post-weight loss. 26 Additionally, reduced walking speed has been linked to increased mortality risk. 27
As for quality of life, we found a significant association between the Orwell-97 score and (SO, with higher scores indicating poorer quality of life (univariate P = .0001, multivariate P = .043). This was consistent with Itani et al’s 28 study in Lebanon, which reported similar results (64.00 vs 41.00; P = .001). Their multivariate analysis showed that SO increased the risk of significant impairment in obesity-related quality of life by nearly 7 times (OR = 7.37; P = .004). Several studies highlight that obesity often compromises quality of life, with potential links to metabolic dysfunctions, chronic inflammation, and reduced muscle mass. 29 Additionally, sarcopenia contributes to functional impairment, such as walking difficulties and loss of autonomy, which can increase the risk of falls. 30
Our study found that non-sarcopenic obese patients were more likely to have a history of weight loss interventions (63%) compared to sarcopenic obese patients (36.8%). This suggests that those previously managed by specialists received effective dietary guidance. Effective nutritional management of obesity is challenging due to issues such as muscle mass loss from weight reduction (sarcopenic weight loss) and fat mass regain from repetitive restrictive diets.
Our study found a significant association between triglyceride levels and SO (P = .019). Multivariate analysis confirmed this link with an odds ratio of 2.71. These findings were consistent with those reported by Yin et al 31 and Cho et al. 32 Habib et al 33 found that triglyceride levels were higher in the sarcopenic obese (SO) group compared to both non-sarcopenic obese and non-obese sarcopenic groups, indicating a combined effect of sarcopenia and obesity on lipid abnormalities, especially hypertriglyceridemia. The relationship between hypertriglyceridemia and SO appears to be linked to insulin resistance. Indeed, when associated with myosteatosis, defined by the accumulation of fat within the muscles, insulin resistance creates a broader vicious cycle. This leads to an increase in lipolysis, thereby raising local concentrations of free fatty acids. This process exacerbates hyperlipidemia in general, with a specific elevation of hypertriglyceridemia and hypo-HDL-cholesterolemia, known as the 2 specific consequences of insulin resistance. 34
Analysis of dietary survey data revealed higher protein intake among obese patients without sarcopenia compared to those with sarcopenia. However, studies on optimal protein intake for sarcopenic obesity (SO) are limited. Kim et al found that high protein intake (>1 g/kg/day) was associated with better preservation of muscle mass and greater fat loss compared to lower protein intake (<1 g/kg/day). 35 More recently, Trouwborst et al suggested that a minimum protein intake of 1.0 to 1.2 g/kg, combined with physical activity and a hypocaloric diet, is beneficial for SO. 36 Dietary amino acids, particularly essential amino acids, are known to positively affect muscle protein synthesis. However, in obese individuals, this response is reduced due to insulin resistance, chronic inflammation, intramuscular fat, and lower physical activity. 37 During sarcopenia, this diminished response to anabolic stimuli is a key factor in muscle mass loss. 38 In obesity with sarcopenia, this reduced protein synthesis response would therefore be even further diminished.
Our study found a significant association between manganese deficiency and sarcopenia (P = .004), with a multivariate odds ratio of 17.40. This aligns with previous research in older population showing lower manganese intake in sarcopenic individuals. Al-Majali et al 39 reported significantly lower manganese intake in sarcopenic subjects compared to healthy ones (1.71 mg/day vs 4.01 mg/day; P < .001). Khanal et al 40 also found lower manganese intake in patients with reduced skeletal muscle mass (P = .009). Further large-scale studies are needed to clarify the causal relationship between manganese deficiency and sarcopenia in the obese population. Interventional studies on antioxidant supplementation and sarcopenia, however, remain controversial and inconclusive. It has been demonstrated that oxidative stress plays a role in the onset of sarcopenia and has been considered a factor in the decline of skeletal muscle mass. 41 Furthermore, certain markers of oxidative damage, such as serum protein carbonyls, have been associated with impaired physical performance. 42 Our study found that average potassium intake was significantly lower in obese sarcopenic patients (P = .024), with deficiency more common in these patients compared to obese non-sarcopenic individuals (52.6% vs 28.4%; P = .043). This aligns with findings in elderly populations. 39
Our study is one of the few Tunisian investigations on sarcopenia in obese adults, using the latest diagnostic thresholds from ESPEN and EASO. However, a limitation of this study is the non-homogeneous gender distribution due to selecting the first 100 patients who sought care at the Obesity Research Unit.
Conclusion
Our study revealed a prevalence of sarcopenic obesity around 19% among young and middle-aged obese patients with a significant impact both clinically and on the quality of life of affected patients. Based on our findings and the literature, we recommend systematic screening for sarcopenia in all obese patients, adoption of a balanced diet with a relatively high protein intake when prescribing diets for obese patients and promotion of regular physical activity.
Furthermore, to target possible interventions in obese individuals with sarcopenia, large-scale studies are imperative. These studies will better assess the prevalence of this condition in the adult population, identify associated factors and address the lack of national and international data on this critical issue. Additionally, managing sarcopenic obesity requires promoting prospective interventional studies, such as those evaluating the effects of antioxidant, omega-3, or protein supplementation on various aspects of this condition. Such studies could provide valuable insights into therapeutic strategies to enhance management and reduce morbidity and mortality associated with sarcopenuc obesity in both adults and elderly individuals.
Footnotes
Ethical Considerations
This study was approved by the local ethics committee of the National Institute of Nutrition and Food Technology, approval number [21/2022], 11 November 2022.
Funding
The author(s) received no financial support for the research, authorship, and/or publication of this article.
Declaration of Conflicting Interests
The author(s) declared no potential conflicts of interest with respect to the research, authorship, and/or publication of this article.
Data Availability Statement
The data that support the findings of this study are available upon request. Please contact the corresponding author for data access. Contact details will be provided upon acceptance of the manuscript.