
Abstract
Background:
Metabolic syndrome (MetS) is defined as the existence of metabolic profile risk factors and impaired glycemic status such as dysglycemia, hyperinsulinemia, insulin resistance (IR), dyslipidemia, and hypertension. Several studies demonstrated that a diet that promotes proper nutritional intake; plays a critical role in the prevention and control of MetS. Our goal for conducting this cross-sectional study was to investigate any potential relationships between the nutrient adequacy ratio (NAR) and cardiometabolic risk variables within obese individuals. individuals.
Methods:
In the present cross-sectional study, 338 seemingly healthy participants who were overweight or obese were enrolled. The assessment of dietary consumption was conducted through a validated questionnaire comprising 168 items Then NAR was calculated for all ten vitamins and six minerals. Biochemical variables are measured by the method of enzyme-linked immunosorbent assay (ELISA). Also, LDL-C (low-density lipoprotein-cholesterol), QUICKI (quantitative insulin-sensitivity check index), and HOMA-IR (Homeostatic Model Assessment for Insulin Resistance) were calculated using the suggested formulas.
Results:
Subjects in the upper NAR tertiles exhibited a significantly higher percentage of fat-free mass (P = .002), appetite (P = .002), and basal metabolic rate (BMR) (P = .002). In addition, Participants in the upper tertiles of NAR consumed a greater amount of energy and all vitamins and minerals included in NAR and meat, fish and poultry (MFP) (P < .001) as well as cholesterol, monounsaturated fatty acid (MUFA), and polyunsaturated fatty acid (PUFA) (P < .05). Furthermore, no association was shown between NAR and metabolic profile and glycemic status.
Conclusion:
According to our findings, a higher nutrient adequacy ratio (NAR) was associated with higher fat-free mass but no significant link between NAR and metabolic profile risk factors was observed.
Introduction
Metabolic syndrome (MetS) is defined as a pathophysiological association and combination of cardiometabolic risk factors that increase an individual’s susceptibility to cardiovascular disease (CVD) and type 2 diabetes mellitus (T2DM) 1 and it includes dysglycemia, hyperinsulinemia, insulin resistance (IR), dyslipidemia, and hypertension. MetS is diagnosed by measuring these disorders using six indicators: fasting glucose levels, waist circumference (WC), levels of triglycerides, high-density lipoprotein (HDL), cholesterol, and blood pressure. 2 Also, MetS is a well-known disorder that may be involved in the causal association between obesity, CVD, and diabetes. 3 Recently, pathologies beyond the diagnostic criteria of MetS including left ventricular hypertrophy, diastolic dysfunction, oxidative stress, hyperuricemia, and thyroid dysfunction have been identified,4,5 highlighting the complex interplay of metabolic dysregulation and cardiovascular health. MetS is believed to impact approximately 30% of the global population, presenting a significant public health concern on a global scale. 6 MetS currently affects 30.4% of Iran’s population, which has a significantly increasing trend. 7 In Iran, food risks are in the first rank of non-communicable disease risk factors, and metabolic risk factors are in the second rank . 8 Given that dietary consumption is a primary contributor to chronic diseases, having a quantitative understanding of dietary trends is essential for developing interventions aimed at mitigating diet-related chronic conditions on both national and global scales. 9 Nutritional adequacy can be defined as the adequate intake of essential nutrients to meet nutritional needs with the aim of achieving optimal health. 10 The important criteria that are commonly used to define the adequacy of nutrient intake are the following: the prevention of diseases related to deficiency and chronic abnormalities. 11 Nutritional adequacy is derived from the comparison between the intake of a particular individual or population and the nutrient requirements of that individual or population. 10 The nutrient adequacy ratio (NAR), is a nutrient adequacy assessment that compares a subject’s daily consumption of a nutrient to the recommended dietary allowance or recommended dietary intake for that nutrient, taking into account the subject's current age and gender. 12
Inflammation could play a crucial role in the interplay between various nutrition indices such as NAR, body composition, and obesity.13,14 Nutrition scores are associated with a variety of inflammatory conditions including type 2 diabetes, 15 infection, 16 and sarcopenia. 17 Additionally, obesity, as a risk factor for various diseases, amplifies the effects of inflammatory stimulators, accelerating their negative impacts and perpetuating the obese state, 18 meanwhile, obesity is also associated with a high burden of inflammation. 19 Studies have shown that inflammation is a key driver for disease-related malnutrition, leading to muscle catabolism and insulin resistance, ultimately affecting muscle mass. 20 Therefore, the link between inflammation, NAR, and muscle mass or obesity underscores the intricate relationship between inflammatory processes, nutritional status, and their impact on body composition.
There have been limited studies investigating the relationship between NAR and different health situations, to our knowledge only the association of nutrition adequacy and reduced mortality 21 and WC 12 has been showing. Jibril et al. investigated the relationship of nutrient adequacy with MetS components in 850 adult subjects from Tehran and found that individuals in the highest quartile exhibited significantly elevated scores for both general and abdominal obesity. 12 In the present study, because of a lack of understanding regarding the connection between NAR and risk factors in the metabolic profile and glycemic status, considering the geographical variation in the prevalence of metabolic disorders and different dietary habits in the regions of Iran, Our goal was to assess potential connections between NAR and the cardiometabolic profile as well as components of MetS, including lipid profile, glycemic markers, and blood pressure levels among apparently healthy participants with obesity in the cities of Tabriz and Tehran, Iran.
Materials and Methods
Design and population of study
The present cross-sectional study included 338 random samples of overweight/obese subjects (Body Mass Index (BMI) > 25 kg/m2) aged between 20 and 50 years old were selected from previous projects.22,23 Pregnant, lactating, or postmenopausal women, Participants with a prior history of gastric bypass or other weight loss operations, cardiovascular diseases, diabetes mellitus, cancer, liver or kidney issues, and those taking medications or supplements that may affect weight (This refers to various pharmacological agents and dietary supplements that can affect body weight by suppressing appetite, inhibiting fat absorption, or modulating metabolism4,5,24) are not included in the study. The ethics committee authorized the study method at Tabriz University of Medical Sciences, Iran, after all participants received and signed an informed consent form (Registration number: IR.TBZME-D.REC.1400.454).
Socio-demographic data
Interviews and questionnaires were used to obtain demographic data, including educational status, work status, property ownership, and household size, the socio-economic status (SES) score was calculated and the SES calculations were conducted in accordance with the standard method outlined in the previous reference. 25 The subjects’ appetite status was measured using a visual analog scale (VAS). 26 The physical activity levels of participants were evaluated using a condensed form of the International Physical Activity Questionnaire (IPAQ). 27
Anthropometric assessments and blood biomarkers
The weight, height, anthropometric measurements, and BIA measurements were conducted in accordance with the standard methodology. Moreover, Venous blood samples were collected from each participant after fasting. Commercial kits were used to assay biochemical variables according to the manufacturer's instructions, meanwhile, Insulin levels in the serum were quantified using commercially available kits provided by Bioassay Technology Laboratory in Shanghai and Korean Biotech in Shanghai City, China. The Friedewald equation 28 was used to calculate the amount of low-density lipoprotein cholesterol (LDL-C). To estimate the amount of low-density lipoprotein cholesterol, the Friedewald equation 5 was applied. HOMA-IR and QUICKI were calculated according to the standard formulas.
Dietary data
Data on the food consumption of the individuals was collected through a reliable semi-quantitative questionnaire containing 168 items specifically tailored for the Iranian population. 29 During in-person interviews, information was gathered regarding how often and how much of various food items were consumed daily, weekly, and monthly. A nutritionist conducted face-to-face interviews to gather data on the consumption patterns of each food item over different time frames. Subsequently, the frequency and serving sizes for 168 food items were converted into grams based on household measurements.
Calculation of nutrient adequacy ratio (NAR)
The Nutrient Adequacy Ratio (NAR) was determined for a total of ten vitamins (A, B1, B2, B3, B6, folic acid, B12, C, D, and E) and six minerals (calcium, iron, magnesium, phosphorus, selenium, and zinc). This was achieved by dividing the daily intake of each specific nutrient by its corresponding recommended daily allowance (RDA) or recommended daily intake (EAR).
30
In the present study, the category of moderate bioavailability was used for iron and zinc. In order to assess the overall nutritional adequacy, a mean adequacy ratio (MAR) was calculated based on the 16 individual nutrient adequacy ratios (NARs) using the prescribed formula: MAR=
Statistical analysis
The data analysis was conducted using SPSS version 21.0 from SPSS Inc. in Chicago, IL. The normality of the variables was evaluated through the utilization of histogram charts and the Kolmogorov-Smirnov test. The distribution was presented as a mean (standard deviation) for normally distributed quantitative data and as a frequency (percentage) for normally distributed qualitative data. To compare differences in discrete and continuous variables among different NAR tertiles, chi-square test and one-way analysis of variance (ANOVA) were employed. Three multivariable-adjusted models were used to investigate the relationship between NAR tertiles and biochemical variables. The study employed multinomial logistic regression to determine odds ratios and 95% confidence intervals for biochemical factors within the NAR tertiles.
Results
The current research involved 338 individuals with an average age of 40.78 years, where approximately 41.79% were male. The participants had an average Body Mass Index (BMI) of 32.62 kg/m2 with a standard deviation of 4.80. According to the results of Table 1, higher basal metabolic rate (BMR) and increased appetite were accompanied by nutrient adequacy ratio (P = .002, and .002 respectively). Also, the individuals in higher NAR tertiles remarkably had higher fat-free mass (P = .002). However, there was no significant difference between the biochemical parameters including SBP, DBP, FBS, TC, TG, HDL, LDL, Insulin, HOMA-IR, and QUICKI of the study population by NAR tertiles (P > .05). Table 2 presents an overview of dietary intakes of energy, macronutrients and NAR components according to NAR tertiles, it is apparent from this table that energy (P < .001), Vitamins B1, B2, B3, B6, folic Acid, B12, A, C, D, E, iron, magnesium, calcium, phosphorous, selenium, zinc intakes as well as MAR were significantly higher among higher NAR tertiles (P < .001), But the differences in the percentage of carbohydrates, protein and fat intake were not significant (P > .05). Higher intakes of food groups amongst NAR tertiles are represented in Table 3 (P < .05). However, after multivariate adjustment, only the statistical difference of MFP, MUFA, and PUFA among tertiles remained (P < .05).
General demographic characteristics of study participants by tertiles of NAR.
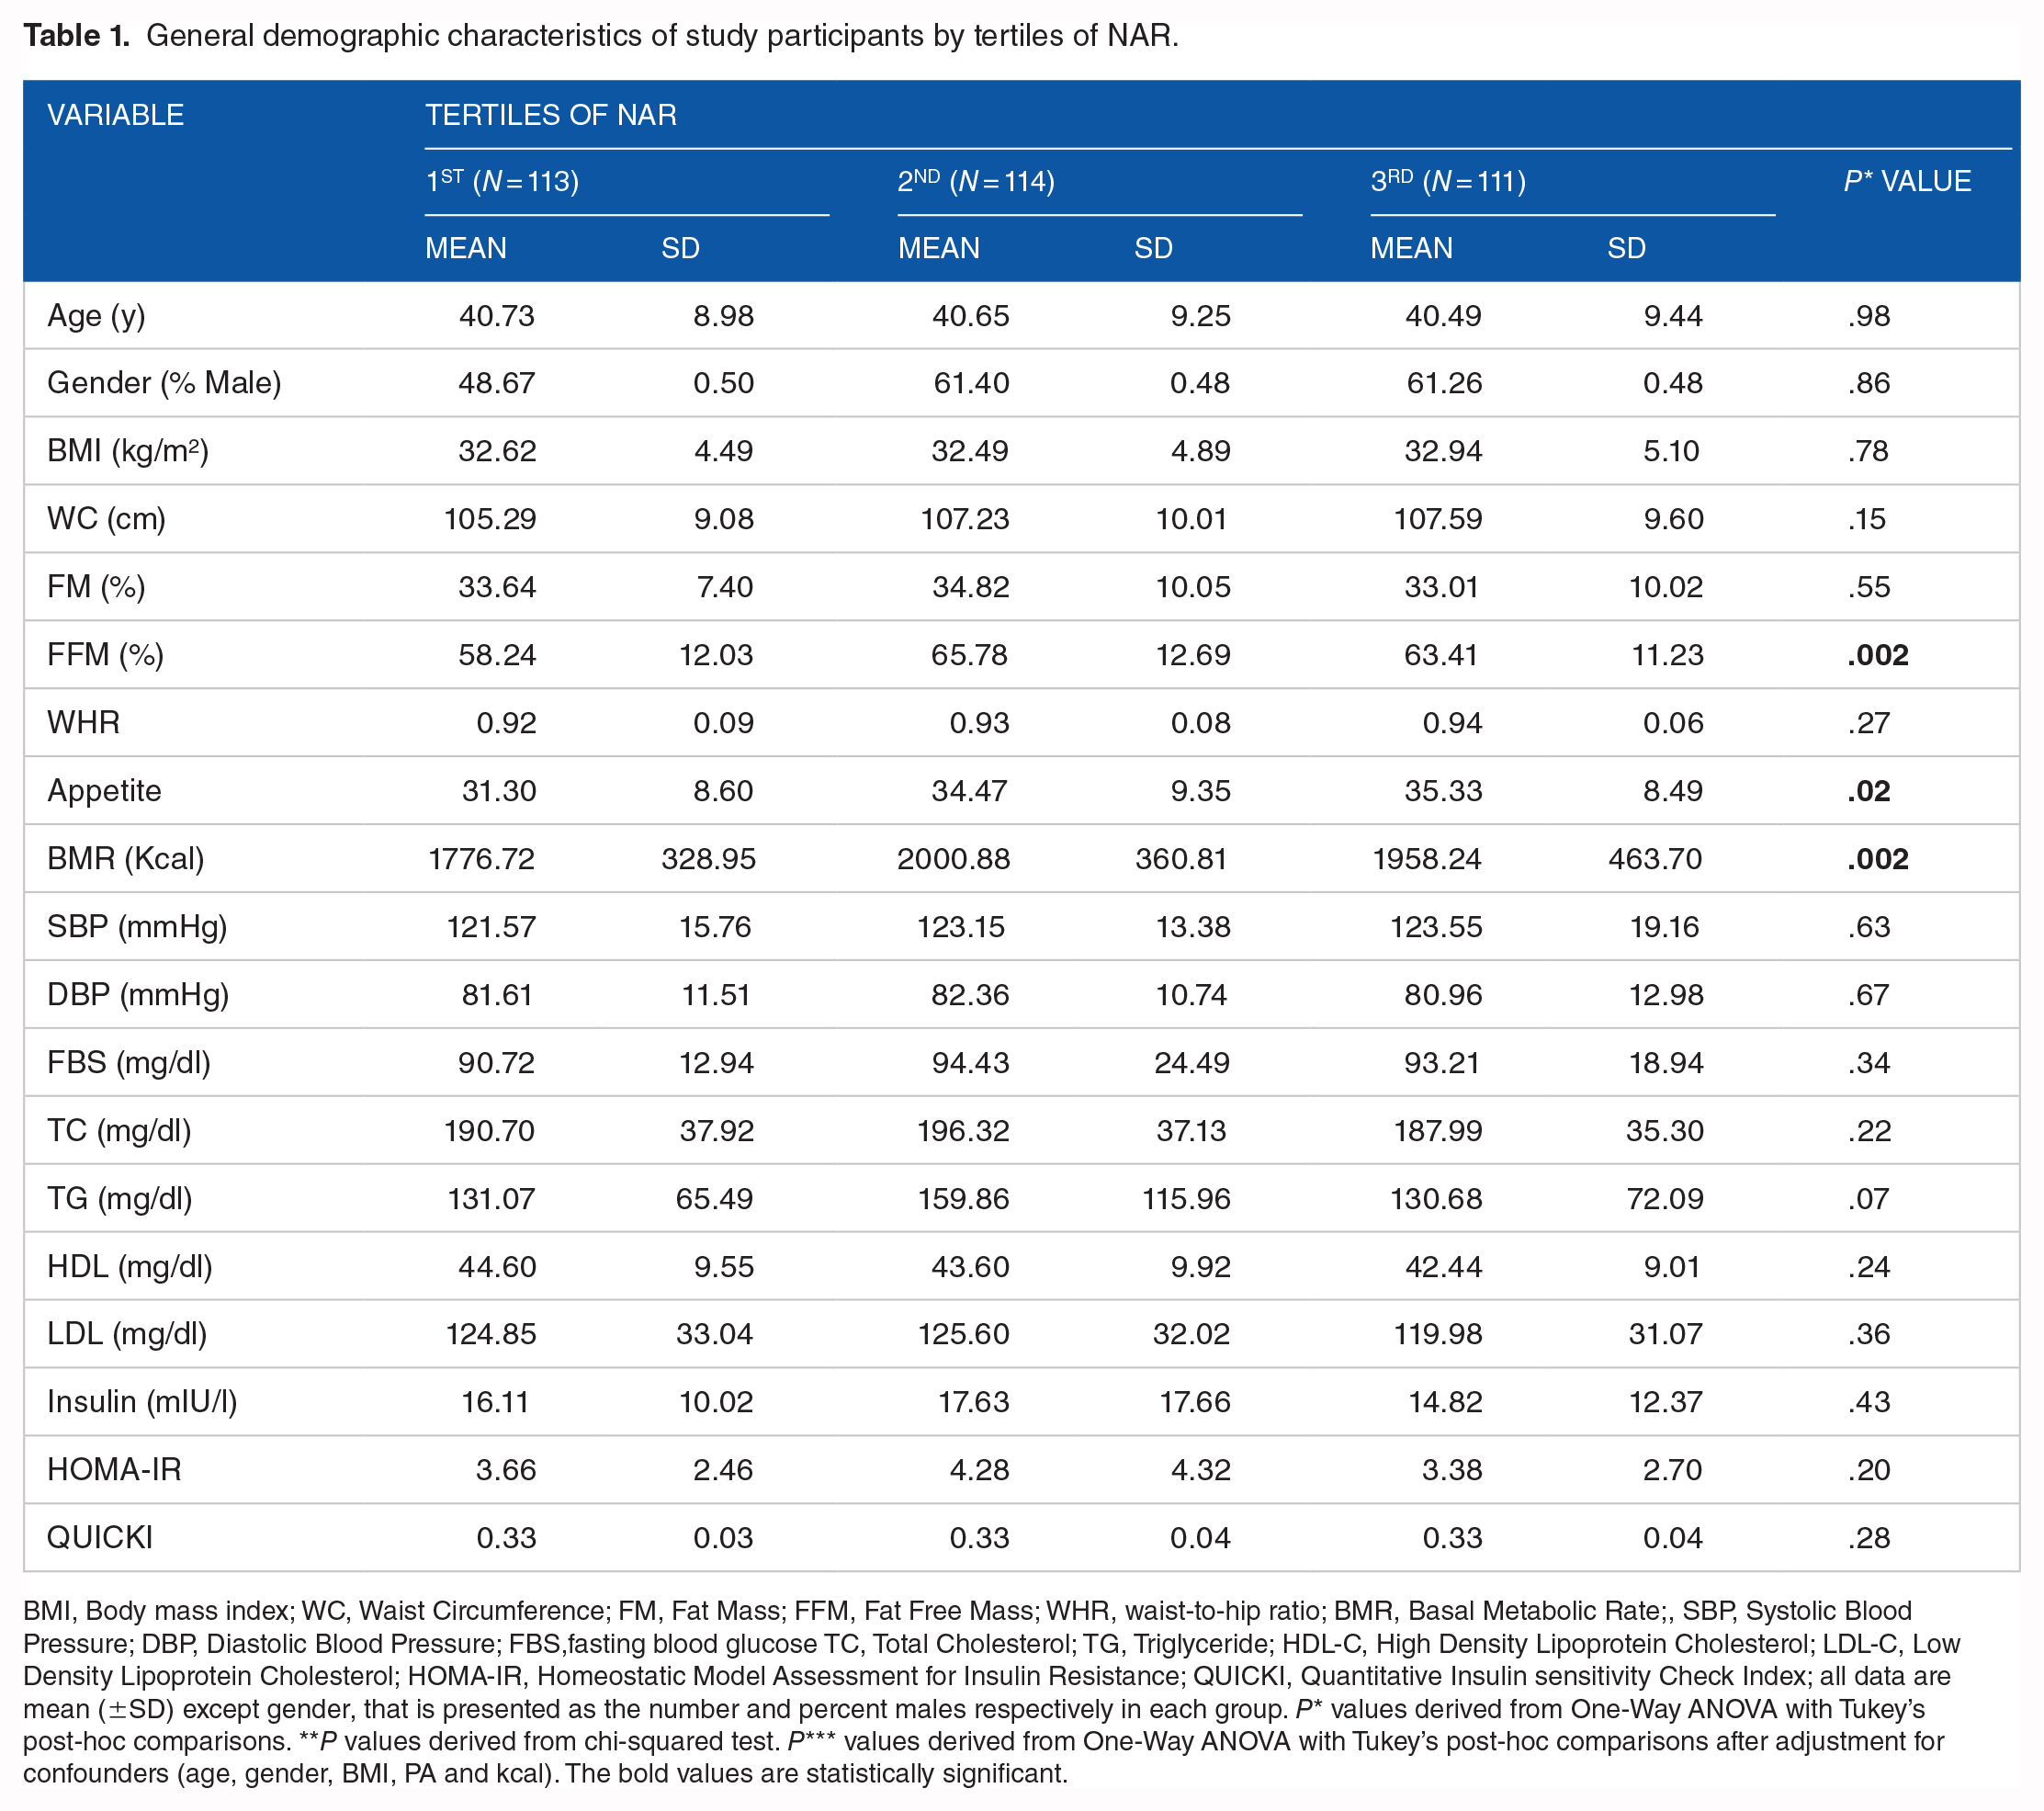
BMI, Body mass index; WC, Waist Circumference; FM, Fat Mass; FFM, Fat Free Mass; WHR, waist-to-hip ratio; BMR, Basal Metabolic Rate;, SBP, Systolic Blood Pressure; DBP, Diastolic Blood Pressure; FBS,fasting blood glucose TC, Total Cholesterol; TG, Triglyceride; HDL-C, High Density Lipoprotein Cholesterol; LDL-C, Low Density Lipoprotein Cholesterol; HOMA-IR, Homeostatic Model Assessment for Insulin Resistance; QUICKI, Quantitative Insulin sensitivity Check Index; all data are mean (±SD) except gender, that is presented as the number and percent males respectively in each group. P* values derived from One-Way ANOVA with Tukey’s post-hoc comparisons. **P values derived from chi-squared test. P*** values derived from One-Way ANOVA with Tukey’s post-hoc comparisons after adjustment for confounders (age, gender, BMI, PA and kcal). The bold values are statistically significant.
Dietary intakes of energy, macronutrients, NAR components and MAR according to tertiles of NAR.

MAR, mean adequacy ratio. P values derived from One-Way ANOVA with Tukey’s post-hoc comparisons. The bold values are statistically significant.
Food groups intake of study participants by tertiles of NAR.
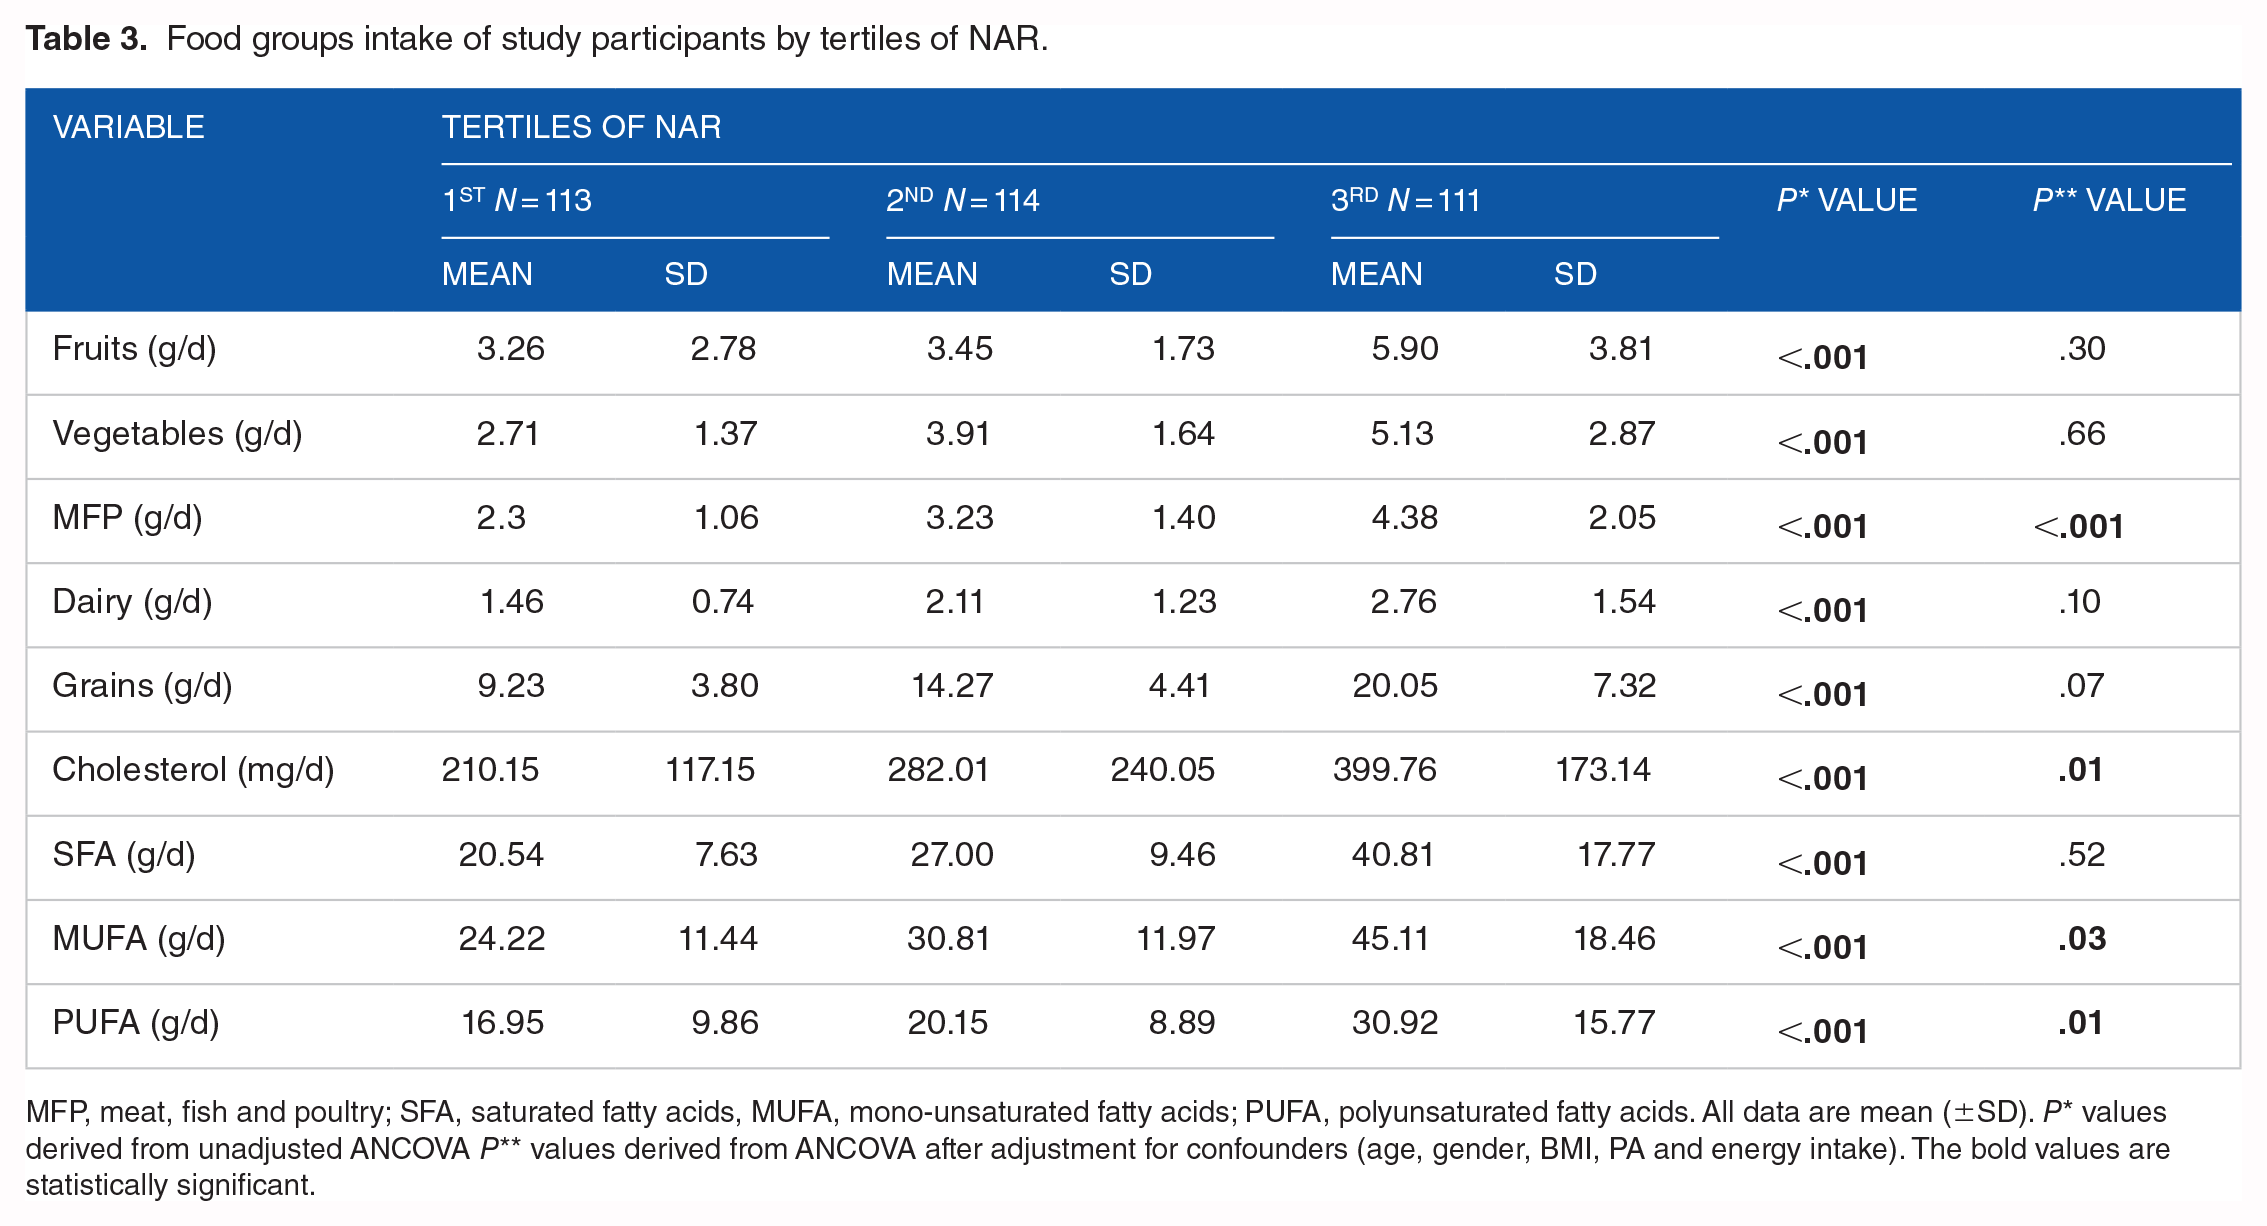
MFP, meat, fish and poultry; SFA, saturated fatty acids, MUFA, mono-unsaturated fatty acids; PUFA, polyunsaturated fatty acids. All data are mean (±SD). P* values derived from unadjusted ANCOVA P** values derived from ANCOVA after adjustment for confounders (age, gender, BMI, PA and energy intake). The bold values are statistically significant.
ORs and 95% CIs for Biochemical variables of study participants by tertiels of NAR are presented in Table 4. Three models including the crude model, adjusted for age and sex, and also adjusted for age, BMI, sex, physical activity, SES, and energy intake showed no significant associations between SBP, DBP, FBS, TC, TG, HDL, LDL, Insulin, and HOMA-IR in three tertiles of NAR (P > .05).
Biochemical variables of study participants by tertiels of NAR.

SBP, Systolic Blood Pressure; DBP, Diastolic Blood Pressure; FBS, fasting blood glucose TC, Total Cholesterol; TG, Triglyceride; HDL-C, High Density Lipoprotein Cholesterol; LDL-C, Low Density Lipoprotein Cholesterol; HOMA-IR, Homeostatic Model Assessment for Insulin Resistance; QUICKI, Quantitative Insulin sensitivity Check Index; OR, odds ratio; CI, confidence interval. The multivariate multinomial logistic regression was used for estimation of ORs and confidence interval (CI).Model I: crude, Model II: adjusted for age and sex, Model III: adjusted for age, BMI, sex, physical activity, SES and energy intake.
Discussion
The current cross-sectional study assessed the association between NAR and metabolic profile parameters including blood pressure, higher BMI and WC, LDL-C and HDL-C levels, and glycemic status (FBS, insulin, HOMA-IR, QUICKI) among apparently healthy individuals with overweight or obesity.
The most important clinically relevant finding of the present study was a significant positive correlation between NAR and FFM which can be explained by the fact that when the amount of nutrients consumed does not match the amount that is needed, changes in body composition occur. 31 A fundamental requirement for overall good health is having an appropriate body composition, 32 Fat-free mass (FFM) is essential for several metabolic processes, including glucose control, and lipid control33,34 in addition to its involvement in locomotion. 35
Several studies revealed that most vitamin and mineral adequacy is associated with body composition and FFM. Population-based cross-sectional research has demonstrated a favorable association between FFM and blood vitamin D levels.36 -38 A survey was conducted involving 14,444 individuals aged 19 and above, who were categorized based on their serum vitamin D levels and daily calcium intake. The study aimed to examine how these factors influenced body composition, with a focus on Fat-Free Mass (FFM). The findings revealed a significant relationship between the levels of vitamin D in the bloodstream, daily calcium intake, and FFM. Furthermore, vitamin B6 status could be associated with FFM, analysis of changes in vitamin B6 status in women with a BMI of 25-35 kg/m2 with a relatively low-calorie diet diets showed an elevated plasma pyridoxal phosphate (PLP) content was strongly linked to FFM.
Our study demonstrated that the consumption of MUFA and PUFA was significantly higher among higher NAR tertiles. Dietary fatty acids have a major impact on cell metabolism, proliferation, and differentiation. 39 A cohort study that included 25,639 individuals found that At the same levels of SFA, greater PUFA was associated with increased FFM%. 40 One way in which polyunsaturated fatty acids (PUFA) may influence body composition is by enhancing the production of mitochondrial uncoupling protein (UCP) and/or the production of proteins responsible for fatty acid oxidation. Additionally, PUFA can regulate the production of genes related to lipid synthesis, thus impacting fat metabolism and thermogenesis. 41 Individuals in the top tertiles of Nutrient Adequacy Ratio (NAR) showed a notable increase in hunger levels, Basal Metabolic Rate (BMR), and consumption of energy, as well as a higher intake of a variety of essential vitamins and minerals, as well as MUFA and PUFA in the current research. However, we observed no association between NAR and the overall cardiometabolic risk factors and MetS components.
Although this study tries to evaluate the significance of the effect of intervening factors in three adjusted logistic regression models, there were no significant confounding factors that could affect the results of the study. This finding is in agreement with the findings of Jibril AT et al. 30 which showed no association between nutrient adequacy and the comprehensive assessment of MetS. Furthermore, no significant association between micronutrient intake and MetS was found in a cross-sectional study that included 3800 participants. 42 In contrast, some studies found an association between specific nutrient intake and non-communicable diseases like a study that shows while vitamin D exhibited a strong negative correlation with WC and fasting blood glucose, the rate of MetS was considerably greater in the vitamin D deficiency group compared to the vitamin D insufficiency and sufficiency groups. 43 Furthermore, a negative relationship was discovered between vitamin B6 and MetS in adults, as well as in children. Conversely, a non-linear positive connection was observed in adults between vitamin B12 and MetS. This conclusion was drawn from a cross-sectional study involving 237 children and 524 parents in Mexico. 44 The summarized beneficial effects of adequate nutrient intake on body composition are presented as a graphical abstract in Figure 1.
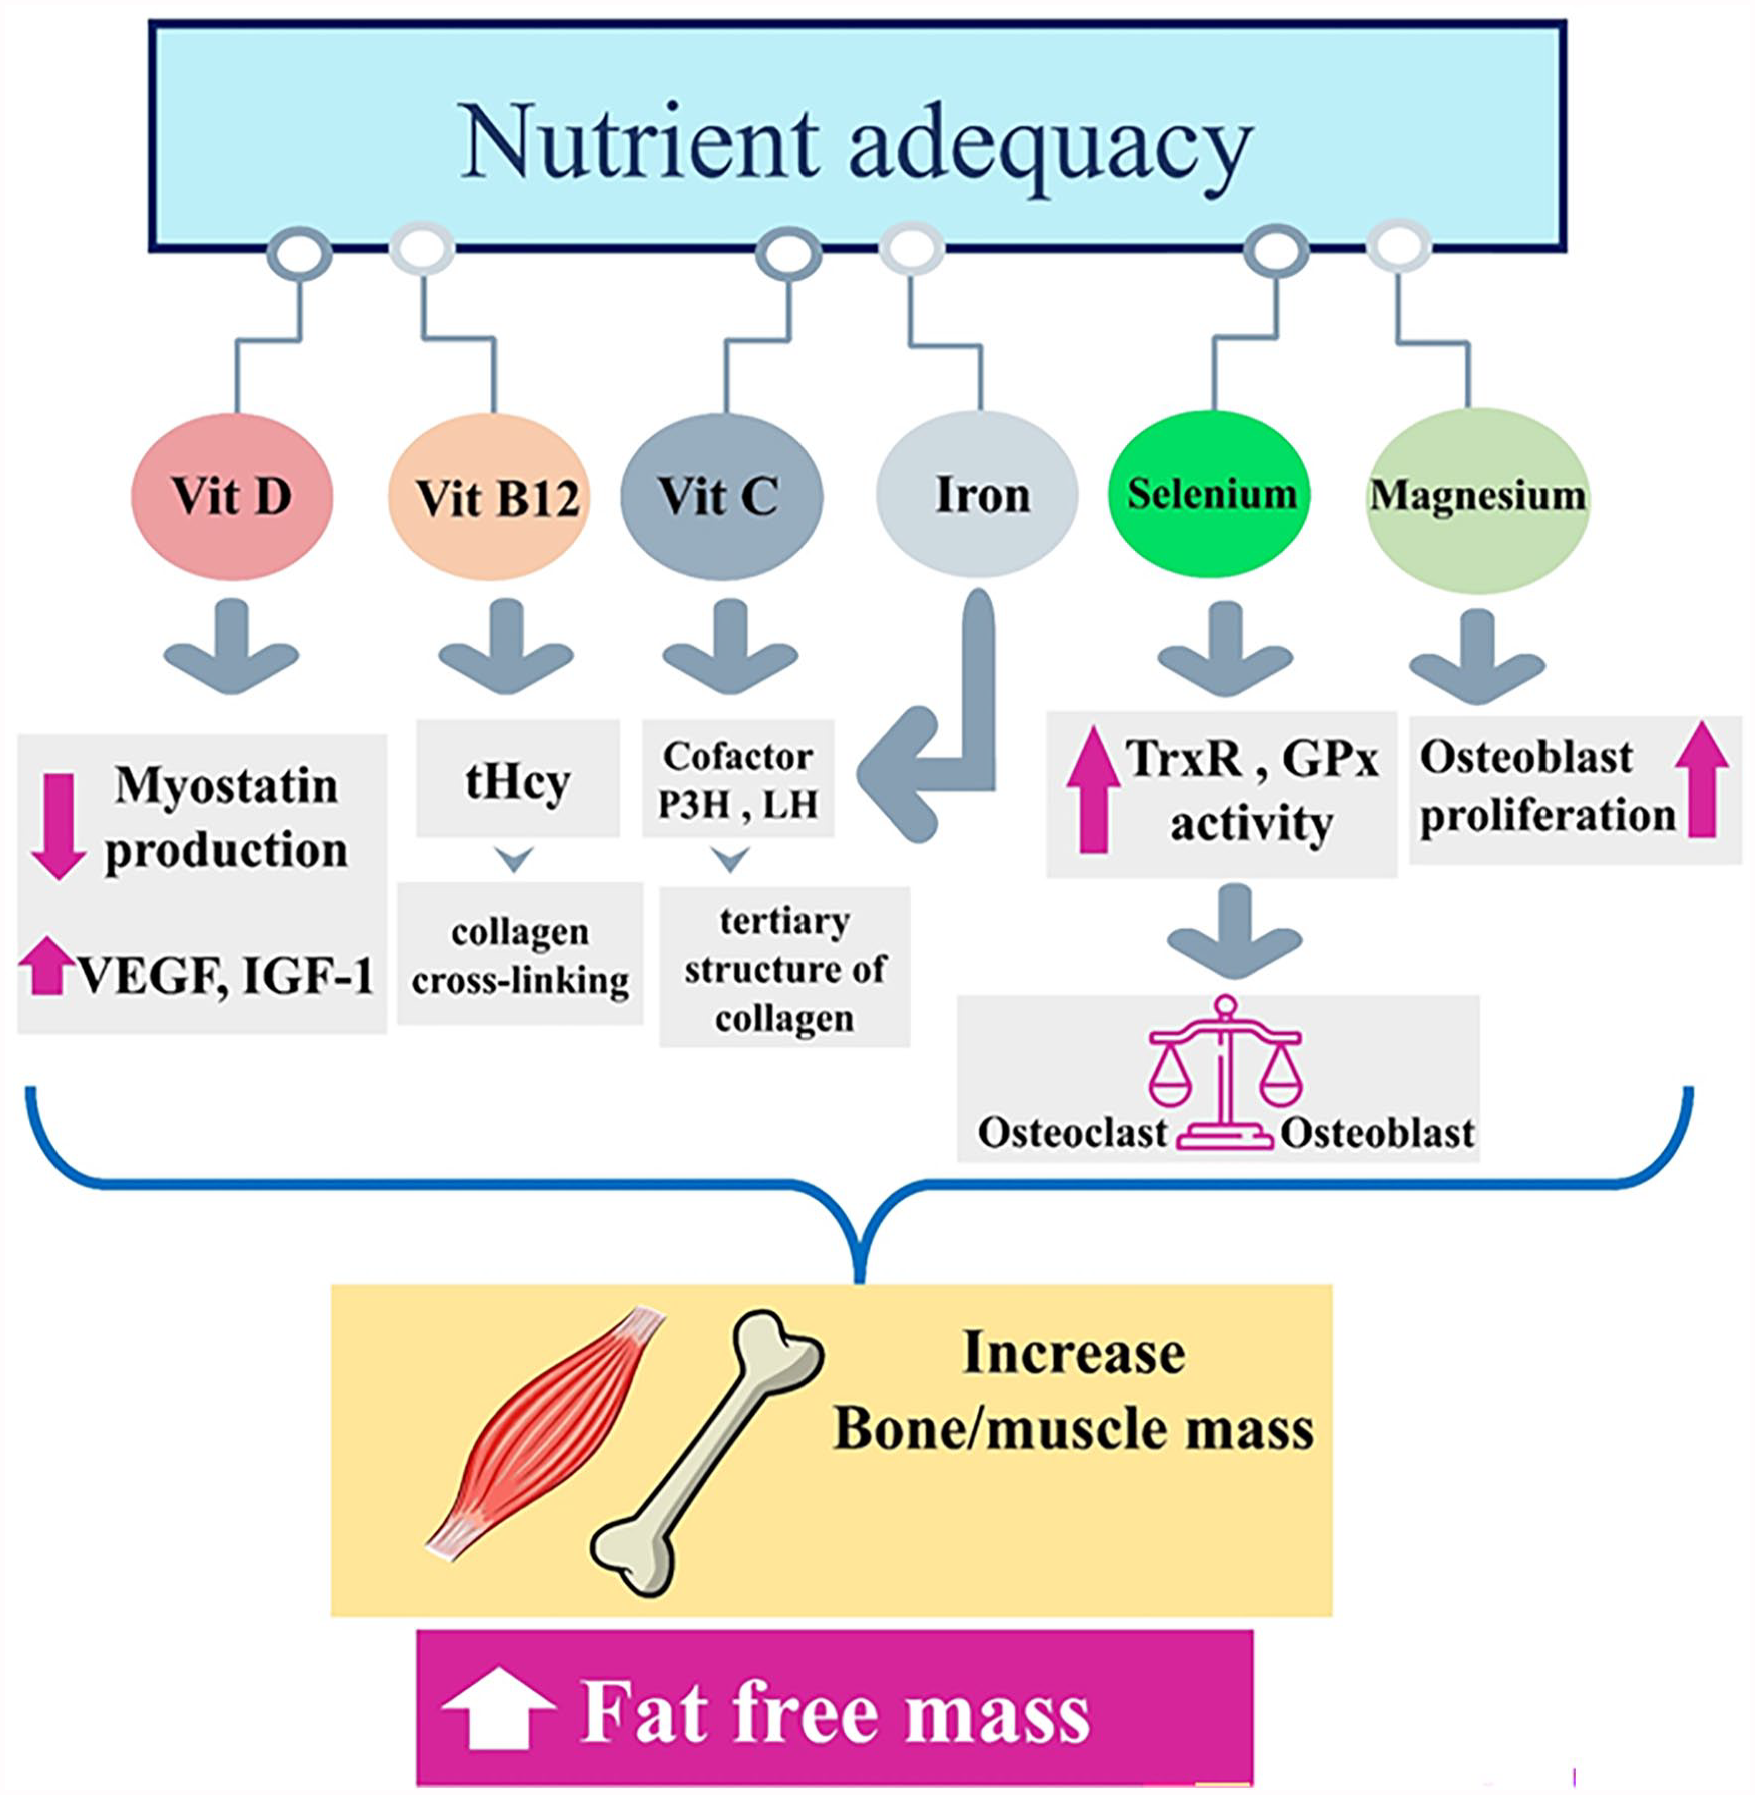
The mechanism of the effect of nutrient adequacy of several micronutrients on the increase of fat-free mass, the result of the increase of bone and muscle mass in the increase of fat-free mass. Vitamin D can prevent the production of myostatin, a hormone that prevents muscle cells from increasing muscle mass, it also stimulates local VEGF and IGF-1. 45 Vitamin B12 exerts its effect through its effect on tHcy concentrations and modulation of collagen cross-linking or through modification of osteoclasts or osteoblasts. 46 Vitamin C is needed as a cofactor for LH and P3H, also these two enzymes need ferrous iron for their catalytic activities; The activity of these two enzymes is necessary to stabilize the tertiary structure of collagen.47,48 Selenium intake stimulates GPx and TrxR activity, which suppresses NFκB activation and further regulates osteoclastogenesis and osteoblastogenesis. 49 Mg2+ also increases bone mass by stimulating the proliferation of osteoblasts. 50 Abbreviations: Vit, vitamin; VEGF, vascular endothelial growth factor; IGF-1, insulin-like growth factor-1; tHcy, total plasma homocysteine; P3H, prolyl 3-hydroxylase, LH, lysyl hydroxylase; GPx; glutathione peroxidase, TrxR, thioredoxin reductase.
This study has important strengths that should be mentioned. First, we can mention the relatively sufficient population that participated in this study, Secondly, in this study, the assessment the nutrient adequacy has been done considering the ethnic and geographical differences in Iran, third adjustment for confounders in three different methods increases the reliability of our findings.
Despite these strengths, our study has limitations too. The method of this study is a cross-sectional design and the findings cannot prove the causality between NAR and metabolic profile. Therefore, the results should not be interpreted with certainty. The questionnaire used in this study was not exclusively designed to assess nutritional adequacy, and using the questionnaire retrospectively may reduce the recall of information. In addition, the metabolic profile was assessed using standard clinical measures; however, variations in laboratory techniques and equipment could introduce inconsistencies in the data. While efforts were made to control for potential confounding variables, there may still be unmeasured factors that could influence both NAR and metabolic outcomes, such as physical activity levels, medication use, and genetic predispositions. In conclusion, while this study contributes to the understanding of the association between NAR and metabolic health in obese individuals, the aforementioned limitations should be considered when interpreting the results and their implications for clinical practice and future research.
In conclusion, in the usual dietary habits of apparently healthy obese individuals, nutrient adequacy ratio was associated with a higher percentage of FFM, However, there was no notable correlation found between NAR and risk factors related to cardiometabolic and glycemic status measures.
Footnotes
Acknowledgements
The authors express their gratitude towards all the individuals who participated in the study for their genuine cooperation. Additionally, appreciation is extended to the Research Undersecretary of Tabriz University of Medical Sciences for their generous financial assistance. (Grant number: 74942)
Declaration Of Conflicting Interests:
The author(s) declared no potential conflicts of interest with respect to the research, authorship, and/or publication of this article.
Funding:
The author(s) disclosed receipt of the following financial support for the research, authorship, and/or publication of this article: This research was funded by a grant provided by Tabriz University of Medical Sciences. (Code: IR.TBZMED.REC.1403.590 and grant number: 74942). The sponsors did not contribute to the development of the research hypothesis, the recruitment of participants, or the design of the study.
The author(s) disclosed receipt of the following financial support for the research, authorship, and/or publication of this article: The work has been granted by the Research Undersecretary of Tabriz University of Medical Sciences.
Authors’ contributions
Every author has given their approval for the final version of the article. MAF contributed to study design, supervision, statistical analysis, and manuscript writing. NN was involved in manuscript writing and English language revision. M.GS performed the statistical analysis and has done revisions.
Availability of data and materials
The data sets produced and/or examined in the present study are not accessible to the public for privacy and ethical reasons. However, interested parties may request access to the data from the corresponding author.
Ethics approval and consent to participate
Before taking part in the study, all participants gave their consent in writing. The study protocol was reviewed and officially registered by the ethics committee at Tabriz University of Medical Sciences with registration number IR.TBZMED.REC.1401.647. We ensured that the methods used in the study followed the guidelines and regulations outlined in the Declaration of Helsinki. Additionally, written consent was provided by legal guardians of participants who were unable to read.