
Abstract
Background:
Early identification and treatment of non-alcoholic fatty liver disease (NAFLD) could reduce overall mortality. Anthropometric measurements offer a simple and cost-effective method to potentially improve early detection of NAFLD and prevent its complications. This study aims to estimate the prevalence of NAFLD using the fatty liver index (FLI) and evaluate the effectiveness of certain anthropometric measurements in predicting NAFLD as diagnosed by FLI.
Method:
A cross-sectional analytical study was conducted with 1264 Saudi population without Type 2 diabetes mellitus (T2DM) non-alcoholic individuals at primary health care centers (PHCCs) in Jeddah city. Measurements included triglycerides, gamma-glutamyl transferase (GGT), glycated hemoglobin (HbA1c), and fasting plasma glucose (FPG). Measurements for neck circumference (NC), and calculations for weight-to-height ratio (WHtR) and weight-to-hip ratio (WHpR), along with FLI, were performed. NAFLD was identified in individuals with an FLI ⩾60. The receiver operating characteristic (ROC) curve analysis was utilized to assess the accuracy of WHtR, WHpR, and NC in detecting NAFLD, with Youden’s index determining the optimal cutoff points for these 3 indices.
Result:
The prevalence of NAFLD was found to be 30.9%. Among the markers, WHtR emerged as the most significant in indicating NAFLD, achieving an area under the curve (AUC) of 0.916; whereas NC and WHpR exhibited identical AUC values of 0.783. WHtR demonstrated superior diagnostic efficacy for identifying elevated FLI, with gender-specific cutoff values established at >0.57 for females and >0.61 for males. In all 3 markers, females exhibited higher sensitivity, specificity, and negative predictive value (NPV) compared to males.
Conclusion:
WHtR could serve as a useful tool in the initial clinical screening for NAFLD among Saudi population without T2DM to identify those who may benefit from more comprehensive testing. Further local studies are warranted to confirm the levels of accuracy and the calculated cutoffs.
Keywords
Introduction
Fatty liver is a chronic disease characterized by the accumulation of excessive fat in the hepatic parenchymal tissue. 1 Two distinct entities have been identified: alcoholic fatty liver disease, caused by excessive alcohol intake, 2 and non-alcoholic fatty liver disease (NAFLD) which arises independently of alcohol intake, viral infections, autoimmune disorders, genetic factors, or drug-induced liver injury. 3 Obesity has long been recognized as an independent predictor of NAFLD, 4 both in the USA, 5 and worldwide. 6 NAFLD affects a quarter of the general population in the USA and Europe, 7 and the global prevalence ranges from 25% to 48%.7,8 In Saudi Arabia, NAFLD has become the most common chronic liver disease, with an estimated prevalence of 25% among the general the population. 9
Other causes of NAFLD include T2DM and other metabolic and systemic diseases.10,11 The disruption of hepatic fat metabolism is reported to involve insulin, thyroid hormones, and inflammatory cytokines. 12 Additionally, several external stimuli influencing hepatic fat metabolism have been identified such as sirtuins, 13 forkhead box O (FOXO) transcription factor, 14 and sterol-regulatory element-binding proteins. 15 In 2023, a consensus led to the renaming of NAFLD to metabolic dysfunction-associated steatotic liver disease (MASLD). This change aimed to reduce the stigma associated with the previous nomenclature and to enhance awareness about the metabolic risk factors. 16
Due to the absence of a reliable biomarker, NAFLD is typically diagnosed by excluding excessive alcohol intake, drug exposure, and similar genetic disorders.17,18 Histopathological examination, the gold standard for NAFLD diagnosis, is limited by its invasiveness and potential for inter- and intra-observer variability, posing risks to patients. 19 Consequently, non-invasive diagnostic methods such as abdominal ultrasonography and proton magnetic resonance spectroscopy have been explored, though their availability in PHCCs is limited. Alternatively, algorithms using routine clinical and biochemical measurements have been developed for NAFLD screening,18,20 being more accessible and applicable in routine practice. 21 Among these indices is fatty liver index (FLI), which consists of a logarithmic equation encompassing body mass index (BMI), waist circumference (WC), triglycerides, and Gamma-glutamyl transferase (GGT); all being independent predictors for fatty liver and correlated with abdominal US image findings.22,23 Moreover, FLI has been proven to predict the T2DM, 24 cardiometabolic disease in obese children, 25 and long-term development of cardiovascular disease in adults. 26 However, the requirement for laboratory measurements limits FLI’s utility as a rapid screening tool. Therefore, recent clinical studies have investigated anthropometric indices such as waist-to-hip ratio (WHpR), WC, and body mass index (BMI) as practical and cost-effective NAFLD risk predictors in adults. 27 Additionally, the waist-to-height ratio (WHtR) has shown high sensitivity for NAFLD detection across different populations,28,29 besides being a strong predictor for cardiovascular and metabolic diseases.30–33
Given the limited research on the efficacy of various anthropometric indices for initial NAFLD screening within the Arab population, particularly in Saudi Arabia, further studies are necessary. This need is accentuated by the fact that the PHCCs are often under-resourced, requiring suspected NAFLD patients to be referred to larger health facilities, thereby increasing healthcare costs and delaying disease management. Furthermore, NAFLD is predominantly screened in obese T2DM patients through extensive laboratory tests, unlike in Saudi population without T2DM individuals who may not undergo comprehensive screening, potentially leading to delayed diagnoses. Hence, our study aimed to estimate the NAFLD prevalence, indicated by FLI, in a Saudi population without T2DM Saudi population and to evaluate the overall and gender-specific accuracy of 3 anthropometric measures—waist-to-height ratio (WHtR), waist-to-hip ratio (WHpR), and neck circumference (NC)—for NAFLD.
Methods
Design and setting
This was a cross-sectional analytical study that was carried out at the PHCCs in Jeddah, Saudi Arabia, between July 2016 to February 2017. Ethical approval was obtained from the Committee on the Ethics of Human Research (Reference No. 338-10).
Population
Men and women aged 20 to 65 years who visited the participating PHCCs during the study period were targeted. Participants were excluded if they were diagnosed with (T2DM), currently active or known chronic hepatic disease, or any other end-stage disease such as cancer, renal failure, or cardiac failure. Additionally, pregnant females, known alcohol abusers, individuals on diet for a GIT disease, and those with physical or mental disabilities were excluded.
Sampling
A multistage stratified sampling method was used. Jeddah was stratified into 5 sectors (strata). Out of each stratum, 2 PHCCs were selected randomly. This resulted in a total of 10 PHCCs.
Eligible individuals who visited the PHCCs during the data collection period were enrolled in the study. In order to maximize the study power, the target sample size was calculated in males and females separately, to detect an unknown prevalence of NAFLD (P = 50%) with 95% confidence interval, 80% statistical power, and 0.05 type I error. The calculated sample size of 377 × 2 = 754 was increased by 30% to compensate for eventual data missing. Thus, a final sample size of 1000, 500 males and 500 females, was targeted.
Data collection
Lab measurements
Following a minimum 10-hour overnight fast, venous blood samples were drawn from all participants for biochemical analysis, which included measurements of triglycerides, gamma-glutamyl transferase (GGT), glycated hemoglobin (HbA1c), and fasting blood glucose (FBG). Additionally, a 1-hour oral glucose tolerance test (OGTT), 34 was conducted, with glucose levels estimated in the collected samples. The biochemical analyses were performed using standard methods and in accordance with the manufacturer’s guidelines at an accredited laboratory.
Anthropometric measurements
Participants’ height and weight were measured without shoes and in lightweight clothing using standardized equipment and methods. Body Mass Index (BMI) was calculated by dividing weight (kg) by the square of height (m2). Waist circumference (WC) was measured at the level of the umbilicus while standing. Neck circumference (NC) was taken 1 cm below the larynx, ensuring the measurement was perpendicular to the neck’s axis with the head in a neutral position and shoulders relaxed. Measurements of height, WC, and NC were recorded to the nearest 0.5 cm, and weight to the nearest 0.5 kg. WHtR was determined by dividing WC (cm) by height (cm), and WHpR was calculated as WC (cm) divided by hip circumference (cm).
Demographic and clinical data
A structured questionnaire was used to collect the participants’ demographic and baseline clinical data. Demographic variables included age, sex, marital status, educational level, income, and job type (none, sedentary, some physical activity, and considerable physical activity). Clinical data included medical history and assessment of the participants’ eligibility. Hypertension was defined as systolic BP ⩾140 mmHg and/or diastolic BP ⩾90 mmHg, or current use of antihypertensive medication, and prehypertension was defined as systolic blood pressure 120 to 139 mmHg and/or diastolic blood pressure 85 to 89 mmHg.
Index calculation and outcome definition
Fatty liver index
Fatty liver index (FLI) was calculated using the following formula (20):

Where y = 0.953 × ln (triglycerides, mg/dL) + 0.139 × BMI, kg/m2 + 0.718 × ln (GGT, U/L) + 0.053 × waist circumference, cm − 15.745
The present study used FLI as the reference to diagnose NAFLD according to the criteria in Table 1.
Indications of FLI and criteria for NAFLD.

Statistical methods
Statistical analysis was performed with the Statistical Package for Social Sciences version 21.0 for Windows (SPSS Inc., Chicago, IL, USA). Categorical variables are presented as frequency and percentage, while continuous variables are presented as mean ± standard deviation (SD). The correlations of the different anthropometric parameters with FLI and with one another were analyzed using Pearson’s correlation.
Independent t-test and chi square test were used to analyze the association of NAFLD with sociodemographic variables.
The accuracy of the three anthropometric indices including WHtR, WHpR, and NC, in detecting NAFLD was analyzed using the receiver operating characteristics (ROC) curve by setting the criterion FLI ⩾60. The ROC curve analysis was carried out for the total population and for male and female subgroups separately, with calculation of the corresponding area under the curves (AUC) with 95% Confidence Interval (CI) and standard errors (SE).
Further analysis was carried out on the 3 indices to determine the optimal cutoffs using Youden’s statistics based on the coordinates of the respective ROC curves. This analysis was carried out in the total population, and in male and female subgroups separately, with calculation of the sensitivity, specificity, positive (PPV) and negative predictive values (NPV) for each index at the calculated cutoff.
A multivariate logistic regression model was carried out to test the validity of the gender-specific cutoffs of the three anthropometric parameters in predicting NAFLD, adjusting for gender and age.
A p-value of <.05 was considered to reject the null hypothesis.
Results
Participants’ flow
Of a total 1403 individuals that were recruited, 91 of them were excluded as they were diagnosed with T2DM based on history (N = 16), blood tests (HbA1c ⩾6.5%, FBG ⩾7 mmol/L or 1-hour plasma glucose ⩾11.1 mmol/L, N = 70), and based on both history and lab criteria (N = 5). Of the remaining 1312, 48 had no data to compute FLI. Thus, 1264 participants were included in the analysis (Figure 1).
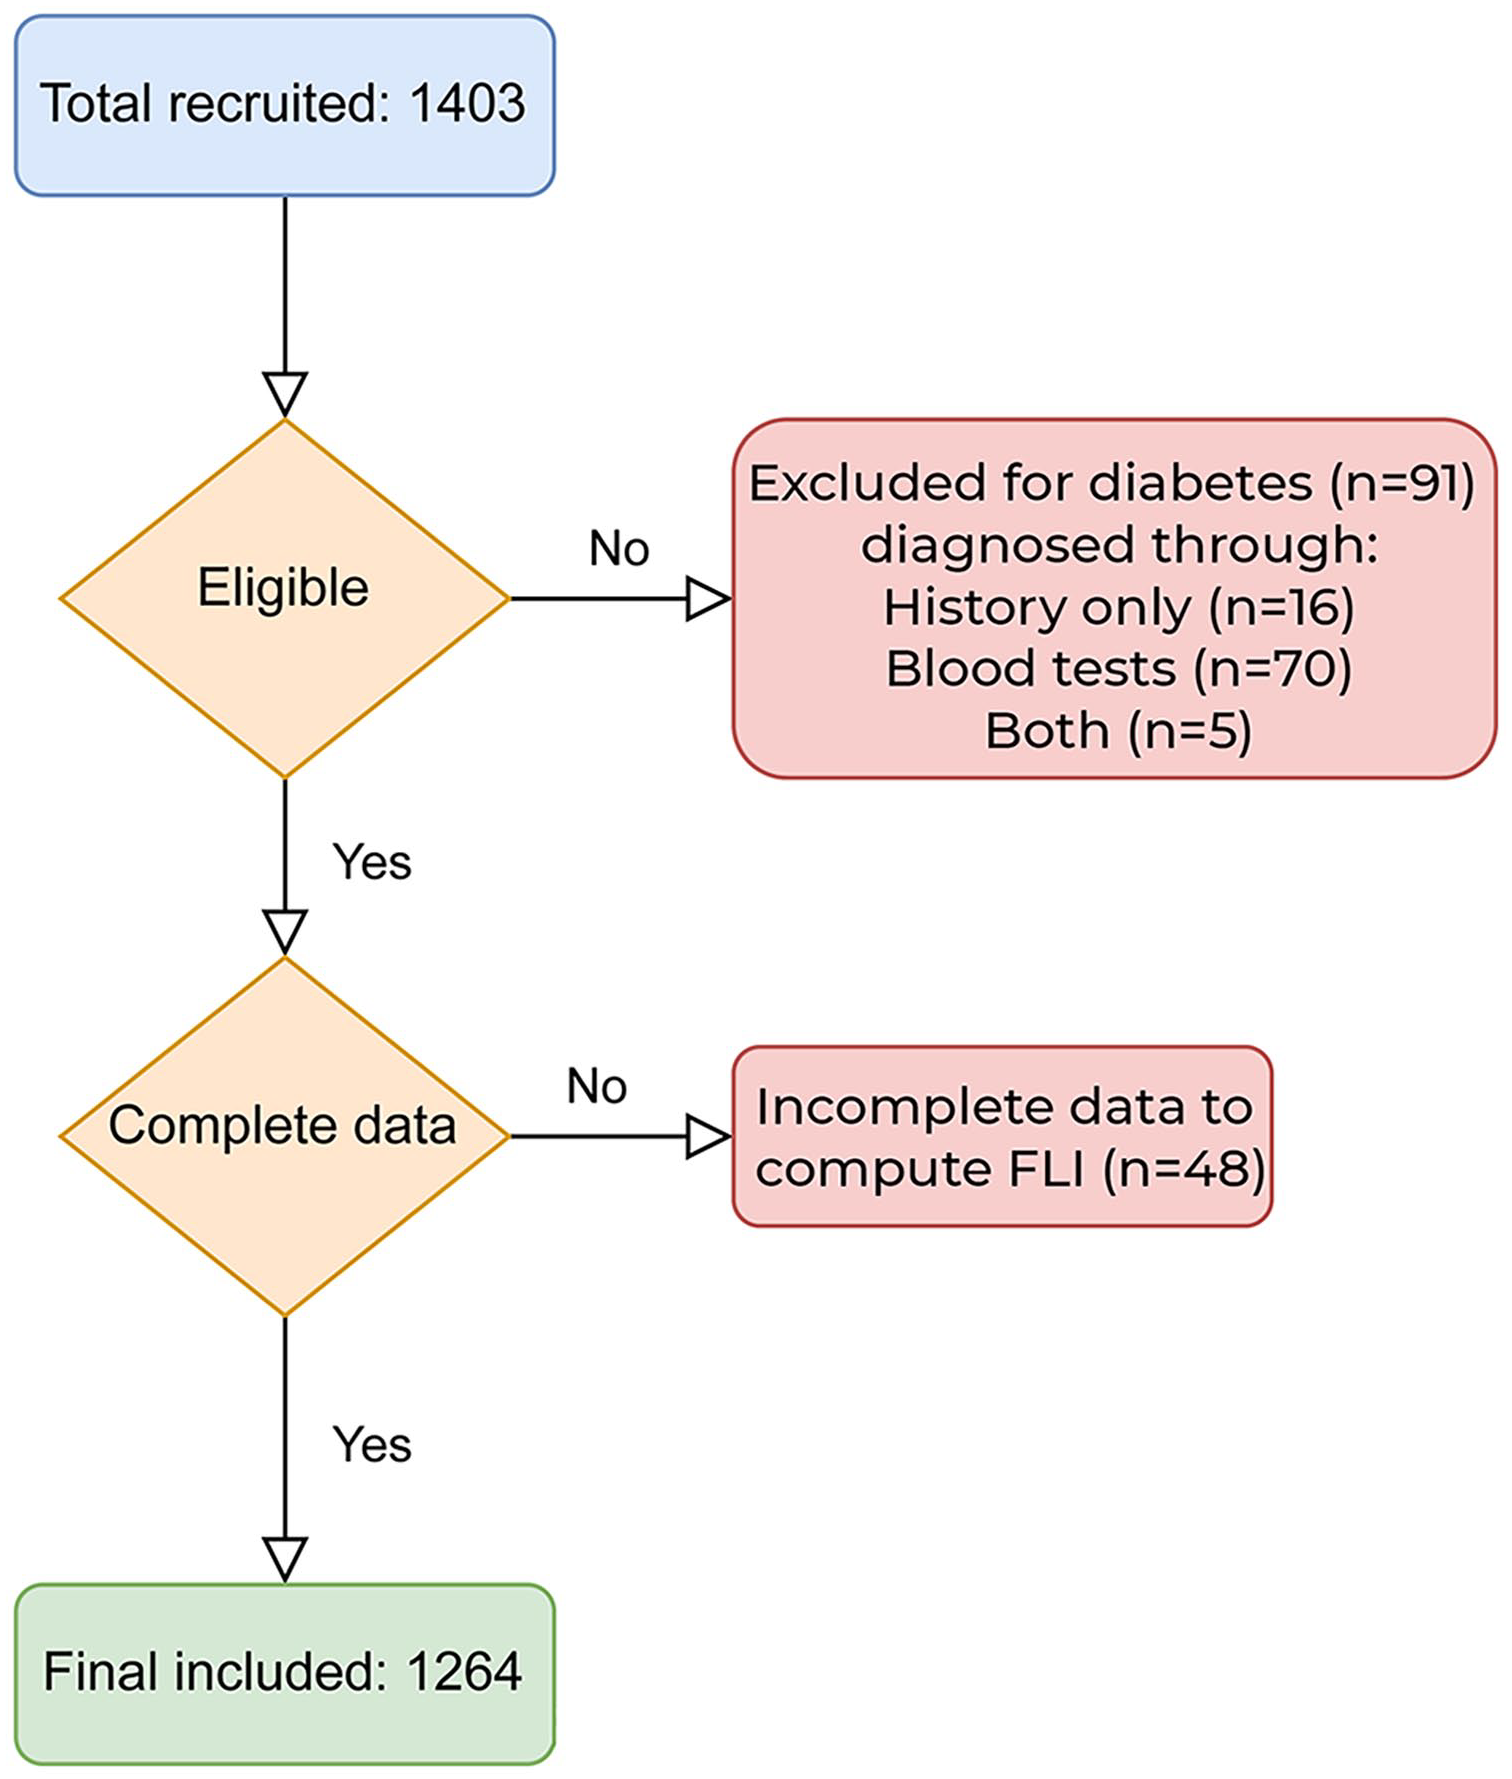
Flowchart of participants.
Demographic characteristics and medical history
The mean (SD) age of the total participants was 31.68 (10.99) years and males were highly represented (56.3%). More than three-quarters of the participants were descendants of Arabian tribes (76.8%). Socioeconomic factors showed unemployment (retired, students, housewives) and sedentary job in 47.4% and 18.9% of the participants respectively. Medical history showed prevalence of hypercholesterolemia (8.1%), hypertension (7.7%), and dyslipidemia (6.1%; Table 2).
Participants’ demographic and medical history (N = 1264).

Assessment of NAFLD
The mean (SD) FLI of the total population was 41.85 (31.49), with 25.2% and 30.9% of the participants being classified in intermediate (30 to <60) and high (⩾60) categories respectively. Thus, the prevalence of NAFLD (FLI ⩾60) was estimated as 30.9% (95%CI = 28.3%-33.5%; Table 3).
Anthropomorphic and clinical measurements and laboratory biomarkers (N = 1264).

Abbreviations: Fasting Blood Glucose; ALT, Alanine Aminotransferase; AP, Alkaline Phosphatase; AST, Aspartate Aminotransferase; BP status, Blood Pressure Status; BMI, Body Mass Index; FLI, Fatty Liver Index; GGT, Gamma-Glutamyl Transferase; HbA1c, Hemoglobin A1c; HDL-C, High-Density Lipoprotein Cholesterol; LDL-C, Low-Density Lipoprotein Cholesterol; Total C, Total Cholesterol; TG, Triglycerides.
A comparative analysis of demographic and clinical data revealed that the NAFLD group was significantly older (P < .001) than the non-NAFLD group. Furthermore, a higher prevalence of NAFLD was significantly associated with male gender (P < .001), married status (P < .001), residence in modest housing (P = .005), lower educational levels (P < .001), sedentary occupations (P < .001), and lower socioeconomic status (P = .020). Additionally, hypertension, dyslipidemia, and hypercholesterolemia were significantly associated with a higher prevalence of NAFLD, with a P-value of <.001 for each condition (Table 2).
Clinical, anthropomorphic data, and laboratory biomarkers
Measurements of blood pressure found that 51.9% of the participants had abnormal blood pressure corresponding to prehypertension (37.3%) or hypertension (14.6%). Anthropomet-ric indices showed mean (SD) BMI: 27.38 (6.04) Kg/m2, WHtR: 0.56 (0.10), WHpR: 0.87 (0.09), and NC: 36.91 (4.68 cm). Mean (SD) FLI was computed at 41.84 (31.49), and (Table 3).
Correlations between WHtR, WHpR, and NC with FLI
All indices were significantly correlated with one another and with FLI. However, WHtR showed the strongest correlation with FLI (R = .832), followed by NC (R = .587; Table 4).
Bivariate correlation between anthropometric indices and fatty liver index.

Diagnostic value of WHtR, WHpR, and NC in NAFLD
Considering the total participants, WHtR had the strongest indicative value for NAFLD defined as FLI ⩾60, showing AUCs as large as 0.916; whereas WHtR and WHpR showed identical AUC of 0.783 (Figure 2 and Table 5). Similar findings were observed in male and female subgroups, which showed the largest AUCs for WHtR (0.918 and 0.959, respectively). However, NC was relatively more accurate in females having an AUC = 0.815, compared to an AUC = 0.785for males (Figure 3 and Table 5).

Receiver operating characteristics (ROC) curve of fatty liver, indicated by high fatty liver index (FLI), as a function of waist-to-height ratio, waist-to-hip ratio and neck circumference in the total study population.
Accuracy of waist-to-height ratio, waist-to-hip ratio, and neck circumference in predicting fatty liver diseases defined as FLI ⩾60.

Abbreviations: AUC, Area under ROC curve; CI, confidence interval; SE, standard error of AUC.

Receiver operating characteristics (ROC) curve of fatty liver indicated by high fatty liver index (FLI), as a function of waist-to-height ratio, waist-to-hip ratio and neck circumference in male (upper panel) and females (lower panel).
Cutoff values of WHtR, WHpR and NC in predicting NAFLD based on FLI score and corresponding sensitivity analysis
The best cutoff values of WHtR, WHpR, and NC to indicate NAFLD in total participants, males and females, as determined by calculation of Youden’s statistics on the ROC curve coordinate points, along with the corresponding sensitivity, specificity, positive predictive value (PPV), and negative predictive value (NPV) are showed in Table 6. WHtR displayed the highest performance including sensitivity, specificity and NPV in total participants (89.0%, 77.2%, and 94.0% respectively), as well as in males (85.5%, 82.0%, and 92.7%) and female (91.2%, 88.1%, and 95.7%) subgroups respectively, by comparison to the two other parameters. Of note, WHpR were more sensitive among males (72.1%) than females (61.4%).
Cutoff values of waist-to-height ratio, waist-to-hip ratio, and neck circumference for indicating high fatty liver index.

Abbreviations: circ., circumference; NPV, negative predictive value; PPV, positive predictive value; WHpR, waist-to-hip ratio; WHtR, Waist-to-height ratio.
Age- and gender-adjusted model of NAFLD prediction using WHtR, WHpR, and NC
A multivariate logistic regression was performed to assess the validity of gender-specific cutoffs for the three anthropometric parameters in predicting NAFLD, adjusting for gender and age. The analysis identified the above-cutoff WHtR as the strongest independent predictor of NAFLD, with an odds ratio (OR) of 18.95 (95% CI: 12.86-27.91; p < 0.001). This was followed by the above-cutoff NC, which had an OR of 4.35 (95% CI: 3.04-6.24; p < 0.001). However, WHpR was not a significant predictor (OR = 1.19; 95% CI: 0.80-1.76; p = 0.397). Additionally, male gender (OR = 2.40; 95% CI: 1.63-3.55; p < 0.001) and older age (OR = 1.04; 95% CI: 1.02-1.06; p < 0.001) were significant predictors in the model. The model accounted for 44.1% of the variance in the dependent variable, NAFLD (Cox & Snell R square = 0.441;
Discussion
The aim of the present study was to assess the accuracy of three easily measured anthropometric indices, namely WHtR, WHpR, and NC, in predicting NAFLD based on FLI score and to determine the related gender-specific cutoffs. This was conducted after estimating the prevalence of NAFLD, indicated by an FLI ⩾60, in a subset of the Saudi population without diagnosed T2DM.
The estimated prevalence of NAFLD in our study was 30.9% among a large number of participants (n = 1264), mostly males (56.3%) and of Arab ethnicity (76.8%), and having sedentary lifestyle, hypercholesterolemia, hypertension, and dyslipidemia as the most prevalent risk factors. A recent meta-analysis, including almost 8 million participants across 22 countries and excluding studies with individuals having T2DM or morbid obesity, found a global NAFLD prevalence of 25.24%. The Middle East exhibited the highest regional prevalence at 31%, 7 closely aligning with our estimates. Another meta-analysis enrolling nearly 27 221 subjects from 10 studies concluded to a higher global prevalence of NAFLD, estimated at 67%. 35 This high prevalence may be attributed to the inclusion of studies that assessed diabetics.
By excluding diabetic individuals, our study population exhibited relatively low cardiovascular risk determinants, including a low prevalence of hypertension, dyslipidemia, and elevated blood pressure. The comparison of our figures suggest that the prevalence of NAFLD in Saudi population without T2DM is higher than the global prevalence; but matching the regional prevalence of 31%. 7 Regardless of eventual ethnic variances, these endemic figures may indicate a higher exposure of the Saudi population to environmental and/or lifestyle factors of NAFLD such as sedentary life. 36 Further epidemiological research is needed to explore the environmental and behavioral risk factors of NAFLD locally and to develop effective public health strategies accordingly. The significant prevalence of NAFLD, both locally and globally,8,9 along with its association with adverse metabolic and systemic conditions,10–12 underscores the need for an efficient, easily implemented, and cost-effective diagnostic and screening strategy.
All investigated anthropometric indices (WHtR, WHpR, and NC) demonstrated significant correlations with each other and with FLI, albeit with varying correlation coefficients ranging from 0.547 to 0.832. An earlier study in an Asian population showed that the abdominal obesity indices were significantly associated to a greater risk of NAFLD. 37 Additionally, recent data from a Persian population revealed that WHtR, BMI, and waist circumference were more effective in predicting NAFLD than other anthropometric measures. 27 Additionally, a study in a Western Chinese male population identified WHtR as having the strongest link with NAFLD. 38 In Japan, Sheng et al. revealed a non-linear relationship between WHtR and NAFLD. By dividing a sample of 14 125 individuals into five quintiles based on WHtR, they observed a progressively increasing NAFLD risk from quintile 2 (3.6-fold) to quintile 5 (11.1-fold) compared to quintile 1. Notably, the authors identified a threshold effect at a WHtR value of 0.4 and a saturation effect at 0.6. 39 Our findings concurred with all these studies showing that the WHtR had the strongest correlation with NAFLD, as predicted by FLI, by comparison to WHpR and NC. WHtR was also the strongest predictor of NAFLD using gender-specific cutoff after adjusting for age and gender. These observations support the utility of WHpR in screening for NAFLD.
Although the other anthropometric parameters, including BMI, and WC, were computed, they were not analyzed as predictors of NAFLD in the present study as they are part of the calculation formula of FLI. Nonetheless, international literature comparing the performance of BMI and WHtR agrees in showing minor differences between the two parameters. A recent study conducted among Western Chinese males showed WHtR (AUC = 0.86) to be relatively superior to BMI (AUC = 0.85) in predicting NAFLD. 38 However, two other studies among the Chinese population reported that BMI (AUC = 0.86 and 0.84) was slightly superior to the WHtR (AUC = 0.84 and 0.82).40,41
In the present study, WHpR and NC demonstrated relatively lower performance, with WHpR showing no significant association in the adjusted analysis. In agreement with our findings, WHpR was previously demonstrated to perform relatively poorly in predicting NAFLD among the general population in China, showing an AUC = 0.78. 41 Another study among Chinese males reported a comparable performance for WHpR with an AUC of 0.81. 38 Nevertheless, it is important to consider cross-ethnic and cross-population differences in anthropometric characteristics, as well as environmental and other factors associated with NAFLD.
One Chinese study explored 15 indices and found that combining the indices with triglyceride-glucose index (TyG) improved the predictive models from 0.86 for BMI to 0.89 for TyG-BMI and from 0.84 for WHtR to 0.88 for TyG-WHtR. 40 In this study, we did not attempt to combine indices, as our objective was to focus on easily conducted anthropometric measurements for initial screening in primary care settings.
Among the recently promoted anthropometric indices is conicity index, which was developed based on a priori model of geometric reasoning. 42 It is considered a simple method to estimate the abdominal obesity, 43 and was reported to be more accurate than WHpR as it is based on adjustment of waist circumference for height and weight with no involvement of hip circumference. 44 Furthermore, conicity index was found to be more accurate than BMI in predicting the risk of cardiovascular risk 44 and lung age in adults. 43 However, conicity index was previously demonstrated to perform less efficiently than WHtR in predicting NAFLD among the general population in China, showing an AUC = 0.74. 41 Therefore, in this study, we opted not to explore the conicity index as a predictor of NAFLD based on FLI score. This decision was made particularly because its formula shares waist circumference, weight, and height (similar to BMI) with FLI, potentially leading to misleading conclusions.
Interestingly, in this study, WHtR demonstrated better performance in females than in males, whereas WHpR showed greater sensitivity in males (72.1%) compared to females (61.4%). This highlights eventual gender differences in the effectiveness of risk assessment tools. Indeed, several studies have shown higher accuracy of anthropometric indices, such as WHtR and BMI, in females compared with males.37,40,45 On the other hand, WHpR 45 and C-index 46 were shown to perform better among males than females.
he WHtR cutoff values identified in our study (0.57 for males and 0.61 for females) are comparatively high. The discrepancies in cutoff values across studies can be attributed to differences in population characteristics, particularly ethnic variations, as seen between Black Americans 47 and Asian Indians. 48 Even within the same ethnic group, variations are noticeable; for instance, within the Chinese population, WHtR cutoffs ranged from 0.47 to 0.52 and BMI from 22.5 to 25 kg/m2, influenced by study design and geographical location.38,40,41 Methodological issues and measurement biases may also impact these cutoff determinations, including differences in gender representation. For example, several studies demonstrated that females had higher WHtR and BMI cutoff values than males.37,40,45,46 In agreement with the literature, findings of our study showed the cutoff points for WHtR to be lower in males (0.57) versus females (0.61). Nonetheless, establishing these cutoffs for any target population necessitates thorough investigations, including a representative sample and estimating specific values for significant subgroups within that population. Our study attempted to follow this approach, and we believe our sample accurately represents our target population, as previously described. Yet, gender differences were noted when sensitivity and specificity were calculated, consistent with findings from previous studies. For instance, one study found WHtR to be more sensitive in females (87%) than in males (81%), 40 and another study found a sensitivity WHtR that is close to our finding (90%) in females. 37
The primary implication of this study is to promote the utilization of WHtR as a simple and cost-effective initial clinical screening tool for NAFLD, prior to subjecting individuals to further biochemical testing for FLI calculation. Notably, WHtR’s accuracy is significantly higher in females. However, owing to this gender difference and potential other factors, additional research is necessary to validate these findings and refine the cutoffs for various subgroups within the local population. Another key implication involves assessing the efficacy of anthropometric measures in predicting NAFLD among subpopulations with metabolic conditions, such as T2DM, and examining potential disparities among ethnic groups within the local population.
The strength of the current study is to be the first in our region to analyze three commonly used and easily measured anthropometric indices in a relatively large, randomly selected, representative sample of Saudi population without T2DM. This provides a reliable comparison between the different parameters and advocates for the external validity of the findings among the general Saudi population without T2DM. Moreover, our study established cutoff points for the significant anthropometric parameters, providing a basis for future testing and implementation within the local population and other comparable populations with a predominantly Arab ethnic background.
The major limitation of the study is the use of FLI to define NAFLD, as an alternative for the golden standard histopathological assessment or imaging methods. 19 However, implementing these gold-standard diagnostic methods in the PHCCs is not feasible. An additional limitation is the underrepresentation of ethnic groups other than Arab tribes, impeding comparisons among ethnic subgroups. Furthermore, this study did not examine the influence of key lifestyle factors, including exercise and diet.
In conclusion, the present study estimated the prevalence of NAFLD to be as high as 30.9% among a representative sample of Saudi population without T2DM, with otherwise low cardiovascular risk. Among the anthropometric indices assessed, WHtR outperformed the others in terms of sensitivity, specificity, and NPV across the total participant pool and within male and female subgroups. Given its simplicity and cost-effectiveness, WHtR emerges as a promising tool for initial NAFLD screening in the PHCCs, prior to further biochemical assessments and potential referrals to specialized centers for management. Future research is needed to validate the accuracy of WHtR and its gender-specific cutoffs, as well as to establish its applicability and precise cutoffs within key subgroups of the local population.
Footnotes
Author Contributions
All authors are contributed equally to this work.
Declaration Of Conflicting Interests:
The author(s) declared no potential conflicts of interest with respect to the research, authorship, and/or publication of this article.
Funding:
The author(s) disclosed receipt of the following financial support for the research, authorship, and/or publication of this article: This work was supported by King Abdulaziz University, grant number (2-140-1434-HiCi).