
Abstract
We aimed to investigate the relationship between preoperative nutritional indicators and sarcopenia in patients diagnosed with stage III colorectal cancer for the first time. To this end, we evaluated the relationships of preoperative anthropometric and nutritional indices obtained by physical measurements and nutritional assessments with skeletal muscle mass index (SMI) measurements obtained using the bioelectrical impedance analysis (BIA) method. The participants were 135 patients (58 women; median age, 69 years). The anthropometric values obtained using an adipometer, and tape measure were evaluated in relation to the Japanese Anthropometric Reference Data (JARD 2001). The anthropometric values were associated with SMI and were highly sensitive to the sarcopenia reference cutoff values indicated by the Asian Working Group for Sarcopenia in 2019. Among the nutritional assessment tools, the Geriatric Nutritional Risk Index was associated with SMI. Thus, preoperative anthropometric values in stage III colorectal cancer patients were associated with measurements obtained using the BIA method and can be considered clinically significant.
Introduction
Although the nutritional physiology of the colon is such that it cannot absorb anything other than short-chain fatty acids and water, 1 the nutritional status of patients diagnosed 2 for the first time with stage III colorectal cancer with lymphatic metastasis, but without distant metastasis, has not yet been determined.
Bioelectrical impedance analysis (BIA) is effective in identifying individuals with sarcopenia. 3 In Japan, a database of 5,432 people’s nutrition assessment using a cheap, safe, and simple tape measure (extremity measurements based on Japanese anthropometric standard data: JARD 2001) is used.4,5 However, their relationship with the muscle mass measurements obtained by body composition monitors and extremity measurements based has not yet been validated in patients with cancer.6-8 In addition, no association between sarcopenia and nutritional assessment in stage III colorectal cancer has been reported. On the other hand, elevated inflammatory markers have been reported in malignant conditions. 9 Sarcopeniahas been reported to be correlated with inflammatory burden. 10 Increased blood inflammatory markers were reported in patients with sarcopenia and frailty. 11 Thus, sarcopenia could be associated with cancer via the inflammation pathway.
The objectives of this study were to investigate the relationship between preoperative nutritional indicators and sarcopenia in patients diagnosed with stage III colorectal cancer for the first time and to evaluate the significance of preoperative nutritional assessments.
Materials and Methods
Participants
The participants chosen for this study were patients who were diagnosed with stage III colorectal cancer at the Department of Colon and Rectal Surgery of the Shizuoka Cancer Center between July 2021 and April 2022, and who were eligible for first-time elective surgery and had a performance status of 0 or 1 before being admitted to the hospital.
Methods
The sequence of measurements, which were obtained from 10 am to 12 pm on the day of hospitalization, was as follows: height and weight, body composition (supine), body measurements (supine, left, and right limbs), and grip strength was measured twice alternately on the left and right sides, and the median value was taken (standing position).
When the participants were hospitalized, the muscle mass in their 4 limbs was determined using a BIA-based high-precision body composition analyzer (InBody S20®). This was then divided by the square of their height in meters to calculate their skeletal muscle mass index (SMI).12,13 Age, body mass index (BMI), and limb measurements based on the JARD 2001 4 were obtained with adipometers and body measuring tapes (arm circumference [AC], arm muscle circumference [AMC], arm muscle area [AMA], calf circumference [CC]), the grip strength (GS; measured twice when standing [T.K.K. 5401 GRIP-D Digital Grip Dynamometer]) of each hand was determined, and their relationships to SMI were assessed.
Using the reference SMI values indicating sarcopenia from the Asian Working Group on Sarcopenia (AWGS) 2019 (women: <5.7 kg/m²; men: <7.0 kg/m²), 3 cutoff values were calculated for the related body measurements. The number of patients with an SMI under the cutoff was compared with the number of patients with a GS and CC under the cutoff, indicating sarcopenia according to the AWGS 2019 3 (GS: <18 kg for women, <28 kg for men; CC: <33 cm for women, <34 cm for men). Triceps skinfold thickness (TSF), measured by an adipometer, and percentage fat mass (%FM), calculated by dividing the BIA-measured fat mass by the participant’s weight, were checked, and the relationship between the 2 was assessed. The total score on the Mini Nutritional Assessment (MNA; a chart that serves as a simple nutritional assessment tool), 14 Geriatric Nutritional Risk Index (GNRI), 15 Controlling Nutritional Status (CONUT), 16 and Prognostic Nutritional Index (PNI) 17 were checked, and their relationships with SMI were assessed. We investigated CRP and assessed its association with the number of patients presenting with sarcopenia from the AWGS 2019 3 (women: <5.7 kg/m²; men: <7.0 kg/m²). We investigated the association between the prevalence of diabetes, hypertension, and heart disease and the prevalence of the AWGS 2019 (women: <5.7 kg/m²; men: <7.0 kg/m²).
Measurements with the InBody S20® device were taken 2 h after breakfast (from 10:00 am to 12:00 pm). We set the reference extracellular fluid-to-total body fluid ratio as 0.35, and the extracellular water-to-total body water ratio as <0.43. All variables were measured using a high-precision body composition analyzer (InBody S20®); to value frequencies, the frequencies were calculated for every part of the body using 6 different frequencies (1, 5, 50, 250, 500, 1000 kHz). 12
Adipometer.
Body measuring tapes.

Statistical processing
The normality of distribution was verified using the Shapiro–Wilk test, 18 and all variables were expressed as medians (minimum–maximum). Pearson’s product-moment correlation coefficient values were used for evaluating the relationships of SMI to the body measurements and nutritional assessment indicators. Chi-square tests were used to compare the numbers of patients with measurements under the GS and CC cutoff values with those under the SMI cutoff value. Fisher’s exact test was used to compare the number of patients with sarcopenia and diabetes, hypertension, and heart disease and the number of patients. Univariate analysis was performed for the association between CRP and the number of patients with SMI. The cutoff values for body measurements that showed associations with SMI were calculated using a receiver operating characteristic (ROC) curve. The statistical analyses were performed using JMP® 12.0, with a 2-sided significance level set at P < .05.
Ethical considerations
This retrospective exploratory observational study was conducted with the approval of the Shizuoka Cancer Center Institutional Review Board (IRB approval number: J2022-37). Verbal consent was obtained from the patients in accordance with the SCC IRB’s recommendations.
Results
During the study period, 135 patients (58 women, 77 men) diagnosed with stage III colorectal cancer for the first time were assessed on the day of their first examination for colorectal surgery. The patients’ median age was 69 years (range, 24-90 years). Their body measurements and measurements’ reference values are shown in Table 1. On comparing the body measurements with the reference values, the measurements of 3 patients (2 women, 1 man) exceeded the reference ranges, while those of the remaining 132 patients were within the reference ranges. Median extracellular water (ECW) as a proportion of total body water measured by BIA was 0.39 (range, 0.37-0.42; women, 0.39 [0.37-0.42]; men, 0.39 [0.38-0.42]), and no cases of edema (ECW ⩾ 0.43) 3 were observed.
Comparison between body measurements and reference values by age (upper table, women; lower table, men; values in red denote cases that exceed the reference range).

The median SMI was 6.8 kg/m² (range, 3.7-9.1 kg/m²; women, 5.8 kg/m² [3.7-7.4 kg/m²]; men, 7.4 kg/m² [4.9-9.1 kg/m²]), and while SMI was not found to be related to age (r = 0.20, P = .20), a positive correlation was observed between SMI and BMI (r = 0.60: P < .01; Table 2). SMI was also related to the body measurements (GS, AC, TSF, AMC, AMA, and CC) (Table 2). Forty-three of the 135 patients (32%) had an SMI below the AWGS 2019 reference value (women, <5.7 kg/m²; men, <7.0 kg/m²), including 24 out of the 58 women (41%) and 19 out of the 77 men (25%). In contrast, 22 women and 23 men had a GS below the cutoff value (women, <18 kg; men, <28 kg), which were not significantly different (P = .70, P = .47: Chi-square test). However, 31 women and 32 men had a CC below the cutoff value (women, <33 cm; men, <34 cm), showing a significant difference for men (P = .19, P = .03: Chi-square test).
Relationship between SMI and nutritional indicators.

Abbeviations: AC, arm circumference; AMA, arm muscle area; AMC, arm muscle circumference; BIA, bioelectrical impedance analysis; BMI, body mass index; CC, calf circumference; COUNT, controlling nutritional status; GNRI, Geriatric Nutritional Risk Index; MNA, Mini Nutritional Assessment; PhA, phase angle; PNI, Prognostic Nutritional Index; SMI, Skeletal Muscle Index; TSF, triceps skinfold thickness.
P*: Shapiro–Wilk test
P: Partial correlation coefficient
The reference value (range) is quoted from JARD2001 of 5,492 Japanese participants. JARD2001 provides reference values using median percentiles (5%-95%). Indicates (Table 1) whether the cases in this study fit the reference values (ranges) of JARD2001.
The cutoff (sensitivity) values for the body measurements in relation to the AWGS 2019 reference values for SMI were as follows: GS, 19.3 kg (0.75) for women and 27.8 kg (0.79) for men; AC, 23.1 cm (0.67) for women and 24.9 cm (0.84) for men; AMC, 19.6 cm (0.71) for women and 22.0 cm (0.84) for men; AMA, 30.7 cm² (0.71) for women and 38.5 cm² (0.84) for men; CC, 32.2 cm (0.79) for women and 33.0 cm (0.84) for men (Figures 1-5). The median TSF was 9 mm (3-36 mm), and the median %FM (BIA fat mass divided by weight) was 25.2% (8.3%-44.5%), and they were found to be correlated (Figure 6).

ROC curves of sarcopenia and grip strength.

ROC curves of sarcopenia and arm circumference (AC).

ROC curves of sarcopenia and arm muscle circumference (AMC).

ROC curves of sarcopenia and arm muscle area (AMA 2 ).
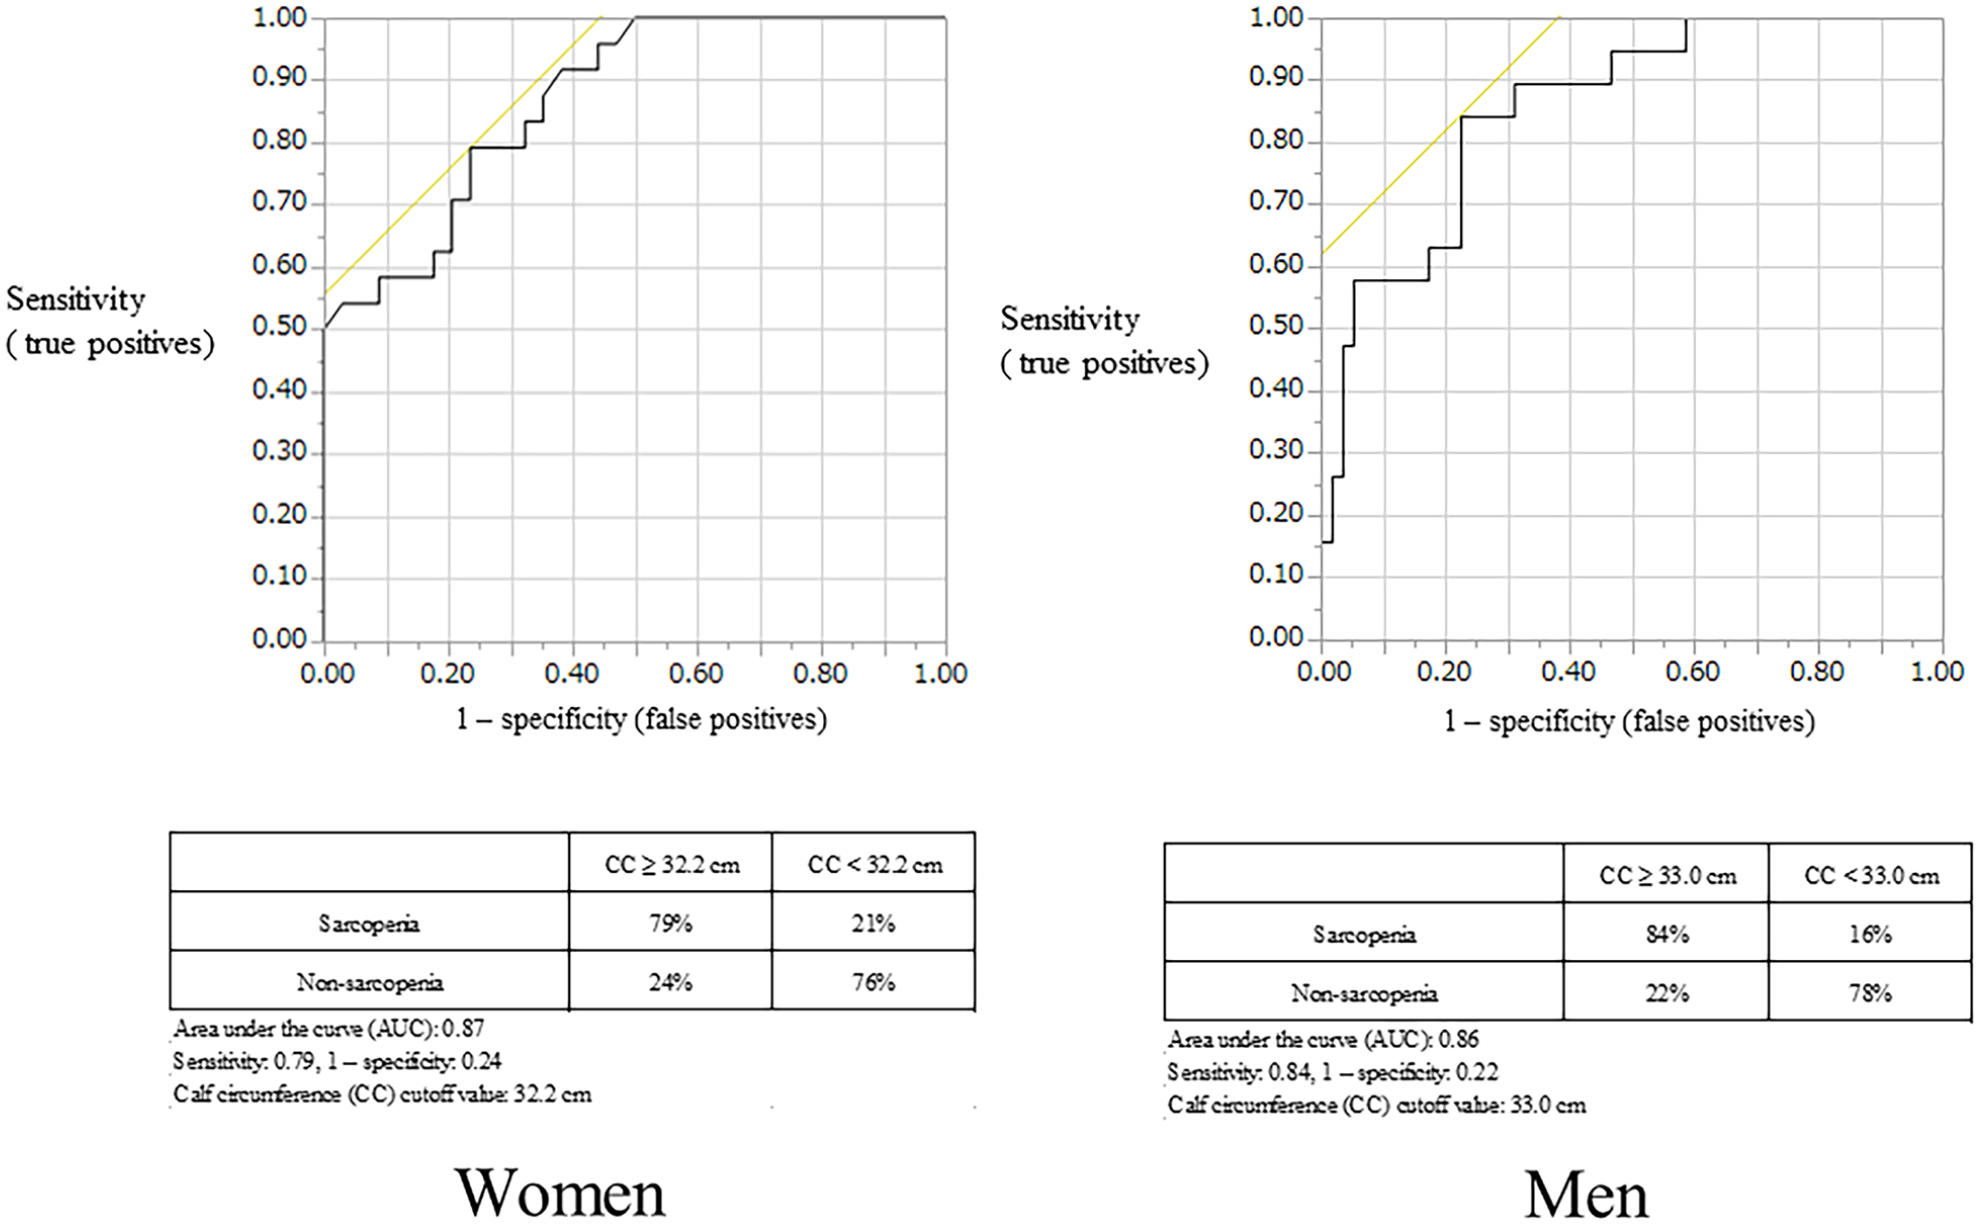
ROC curves of sarcopenia and calm circumference (CC).

Relationship between triceps skinfold thickness (TSF) and % fat mass (%FM) as measured by BIA.
The median MNA score was 24, the median GNRI score was 101, the median CONUT score was 1, and the median PNI score was 48.7, which were good results. SMI was found to be correlated with GNRI and MNA scores (r = 0.60, P < .01; r = .40, P < .01) but not with the CONUT or PNI scores (r = 0.10, P = .40; r = 0.30, P < .01).
CRP was associated with sarcopenia patients in men, but not in women (Female: Odds rate 1.3, 95%Cl:0.44-2.46, P = .21, Male: Odds rate 0.5, 95%Cl:0.21-0.97, P < .01). Among 15 women with sarcopenia and 43 women without sarcopenia, there was no difference in diabetes (2, 2), heart disease (0, 4), or hypertension (4, 20). (P = .30, P = .56, P = .57; Fisher’s exact test). Among 19 men with sarcopenia and 58 men without sarcopenia, there were no differences in diabetes (2, 13), heart disease (5, 11), and hypertension (8, 33), (P = .51, P = .55, P = .65, respectively, Fisher’s exact test).
Discussion
This study assessed the relationships between preoperative nutritional indicators of patients diagnosed with stage III colorectal cancer for the first time. The body measurements taken with a tape measure were roughly within the reference ranges reported in JARD2001, and the body measurements were found to be related to SMI measured by BIA. These results suggest that the colons of patients diagnosed for the first time with stage III colorectal cancer with lymphatic metastasis, but without distant metastasis, have nutritional physiology such that they cannot absorb anything other than short-chain fatty acids and water. 1 Furthermore, for many patients in this study, the body measurements taken with a simple tape measure were associated with SMI, which requires expensive medical equipment. This arguably increases the reliability of body measurements obtained using the methods described in JARD2001 in clinical settings. No relationship was seen between SMI and age, while BMI was found to be related to SMI. This is likely because both SMI and BMI are measured in the same units (kg/m²), but there is clinical significance in the fact that SMI, which requires expensive medical equipment to measure, was supported by BMI, a simple indicator. The result that SMI showed no relationship with age and was related to BMI should be examined in the future in the context of the significance of this indicator for long-term survival. 19
Sarcopenia, which could not be conclusively determined from body measurements, was found in 32% of patients based on SMI measurements obtained by BIA. The relationship of body measurements to SMI was highly sensitive to the reference values in AWGS 2019, which were obtained from Asians (Figures 1-5). The GS and CC cutoff values indicated in this study (GS: women, 19.3 kg; men, 27.8 kg; CC: women, 32.2 cm; men, 33.0 cm) were close to the GS and CC cutoffs that have been previously reported to indicate sarcopenia. 3 Comparison of the numbers of patients revealed a difference in CC in men but no difference in the GS of both sexes and the CC in women. AC (cutoff: women, 23.1 cm; men, 24.7 cm), AMC (women, 19.6 cm; men, 22.0 cm), and AMA (women, 30.7 cm²; men, 33.0 cm²), which had not previously been reported to be related to SMI, showed a sensitivity of 70%. The cutoff values for these body measurements are supported by SMI and thus do not contradict it as a rough marker of sarcopenia.
Meanwhile, TSF was shown to be correlated with overall %FM and was found to offer appreciable scientific support along with SMI. BIA involves the passage of multiple frequencies (impedances) through the body and is not affected by fat since fat does not conduct current. For this reason, the relationship of SMI with TSF, which can be measured by a simple adipometer, suggests that TSF could be a helpful clinical indicator in oncology when cancer cachexia is a potential problem.
The median results for the nutritional indices of patients diagnosed for the first time with stage III colorectal cancer, namely, the MNA, GNRI, CONUT, and PNI scores, were generally good. SMI was found to be related to GNRI 15 and MNA 14 scores, although not with CONUT 16 or PNI 17 scores. This may be because the GNRI and MNA include items related to body weight, whereas the CONUT and PNI focus only on biochemical tests. Multivariate analysis of these points in relation to outcomes, along with SMI and other factors in body composition, should be done in the future, and the author is currently researching this topic.
An association between sarcopenia and CRP was found in men but not in women. This may be due to the effect of body fat mass (Table 2), and its association with long-term survival needs to be assessed using multivariate analysis in the future. 20
Sarcopenia and frailty were reported to be associated with poor diabetic control. 21 Moreover, it is also associated with hypertension in the elderly, 22 and heart failure. 23 No association was found between patients with sarcopenia who were first diagnosed with stage III colorectal cancer and those with diabetes, hypertension, or heart disease. It was considered necessary to observe the long-term survival of patients with this disease in the future.
In this study, sarcopenia was found preoperatively in approximately 30% of the 135 stage III colorectal cancer patients, as indicated by the reference values in AWGS 2019. These SMI data support the usefulness of body measurements obtained with a simple tape measure as well the JARD 2001 reference values for these measurements.
A limitation of this study is that the outcomes could not be traced back, which was thought to affect the bias of the study.
Conclusion
Limb measurements of stage III colorectal cancer patients taken preoperatively with adipometers and a simple tape measure were related to SMI measurements obtained by BIA. Body measurements were highly sensitive to sarcopenia, which suggests that nutritional assessments using simple body measurements are significant.
Research Data
sj-xlsx-1-nmi-10.1177_11786388221129011 – Supplemental material for Relationship Between Preoperative Nutritional Indices and Sarcopenia in Patients With Stage III Colorectal Cancer
Supplemental material, sj-xlsx-1-nmi-10.1177_11786388221129011 for Relationship Between Preoperative Nutritional Indices and Sarcopenia in Patients With Stage III Colorectal Cancer by Takashi Aoyama in Nutrition and Metabolic Insights
Footnotes
Acknowledgements
Funding:
The author received no financial support for the research, authorship, and/or publication of this article.
Declaration of Conflicting Interests:
The author declared no potential conflicts of interest with respect to the research, authorship, and/or publication of this article.
References
Supplementary Material
Please find the following supplemental material available below.
For Open Access articles published under a Creative Commons License, all supplemental material carries the same license as the article it is associated with.
For non-Open Access articles published, all supplemental material carries a non-exclusive license, and permission requests for re-use of supplemental material or any part of supplemental material shall be sent directly to the copyright owner as specified in the copyright notice associated with the article.