
Abstract
Background:
Iodine deficiency causes various health problems such as mental defects, goiter, reproductive damage, hypo and hyperthyroidism, stillbirth, abortion, congenital abnormalities, cretinism, mental retardation, muscle anomalies, and reduced work output. Although the adverse effects on health and socio-economic development are well known, they persisted as a public health problem worldwide. Salt iodization is recommended as a simple cost-effective method to prevent iodine deficiency disorders. This study aimed to determine the magnitude, trends, and determinants of iodized salt availability in the household in Ethiopia.
Methods:
The current study used the Ethiopian Demographic and Health Surveys conducted from 2000 to 2016 with a total of 57 939 households. Descriptive statistics were performed on selected background characteristics to provide an overall picture of the sample after considering sample weights. To ensure the representativeness of the sample we applied a complex sample design considering household weights, primary sampling units, and the strata associated with it. The Cochran–Armitage test was performed to assess the trend of iodized salt availability in the household. Multivariate logistic regression was used to determine the association between the dependent variable and independent variables. A significance level of .05 was chosen for all analyses.
Results:
The magnitude of iodized salt availability in the household was 28.45% in 2000, 54.34% in 2005, 15.42% in 2011, and 89.28% in 2016. Iodized salt availability increased from 28.45% [95% CI: 27.69-29.21] in 2000 to 89.28% [95% CI: 88.79-89.75] in 2016. Despite the decline from 2005 to 2011 in the percentage of households with iodized salt, overall, there was a significant increment from 2000 to 2016 in Ethiopia (P-value <.001). There were differences in the status of salt iodization in the administrative region, wealth, family size, and ownership of radio or television.
Conclusion:
Remarkable progress has been made in Ethiopia regarding iodized salt availability in recent years. Besides the current efforts to achieve universal salt iodization, future interventions should prioritize specific groups like those with lower socioeconomic status and geographic areas with lower availability of iodized salt in the household.
Introduction
Normal thyroid function is crucial to metabolic activities of almost all tissues and vital to the development of the central nervous system and other somatic structures, especially in early life.1,2 Normal thyroid function is dependent on the presence of many trace elements for both the synthesis and metabolism of thyroid hormones. Iodine is the most important component of thyroid hormones-thyroxine (T4) and 3,3′,5 tri-iodothyronine (T3), and iodine deficiency affects a considerable number of the world population. 3 Despite the substantial progress over the last several decades, iodine deficiency remains a significant public health problem worldwide without geographical and economic boundaries. 4 For example, almost one-third of children (33%) and adults (32%) were iodine deficient in Germany in 2016, 5 adults and pregnant women are at risk of iodine deficiency in Europe generally with weak or non-existent governmental programs to address the problem. 6
Iodine deficiency causes various health problems such as mental defects, goiter, reproductive damage, hypo, and hyperthyroidism, stillbirth, abortion, congenital abnormalities, cretinism, mental retardation, muscle anomalies, and reduced work output.7,8 Although the adverse effects of iodine deficiency on health and socioeconomic development are well known, they persisted as a public health problem worldwide. World Health organization (WHO) recommends a daily intake of 150 μg of iodine for an adult to prevent iodine deficiency disorders (IDD). 9
From 2007 to 2017 there was a decline of IDD by 17.4% worldwide, but IDD was still affecting a significant number of population in 2017. 10 Data from the first global urinary iodine concentration measurement (in 2008) of pregnant women from 65 countries indicated, well more than half (37 countries) had inadequate intake of iodine. 11 Currently in Africa, studies suggested the likelihood of higher prevalence of insufficient iodine intake especially during pregnancy, including in some African countries classified as having adequate iodine intake in the general population. 12
A recent systematic review and meta-analysis conducted to pool the prevalence of goiter in Ethiopian children found 40.5% of them had a goiter. 13 In 2017, the total Disability Adjusted Life Years due to dietary iodine deficiency was estimated to be 89 600 [95% uncertainty interval 48.3–155.4]. 14 In nearly all countries where iodine deficiency occurs, it is now well recognized that the most effective way to achieve the virtual elimination of IDD is through universal salt iodization (USI). It is recommended as the most cost-effective, safe, and sustainable way to eliminate IDD. 15 Iodization of salt is currently undertaken followed by universal salt iodization initiative and has been ongoing in several countries over the past few decades. 16
National coverage of household’s adequately iodized salt varies among countries. A review conducted by Knowles and colleagues showed that the national household coverage of adequately iodized salt varied from 6.2% in Niger to 97.0% in Uganda. In Ethiopia national coverage of household adequately iodized salt was 26.1%. There was variation in coverage by residence and socioeconomic status of residents. 17 Generally, previous studies in Ethiopia have given important scientific input to policymakers, programmers, and other stakeholders. This study aimed to determine the magnitude, trends, and determinants of iodized salt availability among households in Ethiopia and provide a comprehensive insight into the problem. This study will provide an in-depth analysis of variables affecting the trend of household iodized salt availability. While the EDHS itself and other studies provided determinants, this study further investigated factors associated with the outcome over 16 years for national-level policymaking and programming by concerned bodies.
Methods
Data source, setting
Ethiopia is the second-most populous country in Africa next to Nigeria with a population of more than 100 million. Administratively, Ethiopia is divided into 9 geographical regions (Tigray, Afar, Amhara, Oromia, Somali, Benishangul-Gumuz, South Nations Nationalities, and Peoples Region [SNNPR], Gambella, and Harari) and 2 administrative cities, Addis Ababa and Dire Dawa. Found in East Africa, Ethiopia shares the boundaries in the North with Eritrea, in the South with Kenya and Somalia, in the West with South Sudan and North Sudan, in the East with Djibouti and Somalia. Four national surveys conducted in Ethiopia from 2000 to 2016 were utilized for analysis. The Ethiopian Demographic and Health Survey (EDHS) is a part of the international demographics and health survey (DHS) program led by the United States Agency for International Development, in collaboration with other organizations and host countries.
The dataset used in this study was obtained from the MEASURE DHS database at http://dhsprogram.com/data/ after getting the approval letter from the DHS program office. The current study used the data from the EDHS conducted from 2000 to 2016 with a total of 57 939 households.
Sampling procedures
The EDHS sample was stratified and selected in 2 stages (2-stage cluster sampling procedure). At the first stage, a stratified sample of enumeration areas is selected with probability proportional to size: in each stratum, a sample of a predetermined number of enumeration areas is selected independently with probability proportional to the enumeration area’s measure of size. In the selected enumeration areas, a listing procedure is performed such that all households are listed. At the second stage, after a complete household listing is conducted in each of the selected enumeration areas, a fixed number of households is selected by equal probability systematic sampling in the selected enumeration areas. 18
Sample selection
For this study, missing values, households which hadn’t salt during the survey and households without test result (not tested) were excluded. In 2000 EDHS a total of 14 072 households were surveyed, there were no households without salt and missed the test, but 442 households had missing value and were excluded from this study (not shown). The included households were 13 626 without considering the weight.
In 2005, 13 721 households were interviewed and 13 526 households had the test result for household salt iodine. This was after the removal (from this study) of 11 households without salt, 104 untested households, and 90 missing values. Whereas in 2011, 16 702 households were surveyed, and after excluding for no salt in the household (1305), not tested (107) and missing values (60) a total of 15 234 households were included for this study. In the same manner, 16 650 households were sampled in the 2016 EDHS; we excluded 1052 households without salt, 51 untested households, and finally reached 15 567 households for analysis.
Summing up, 13 626 (2000), 13 516 (2005), 15 230 (2011), and 15 567 (2016) were included for this study before applying household weights. This gives a total of 58 961 households for analysis after considering sampling weight. The sample selection and exclusion were given in Figure 1.

Sample selection and exclusions for determining trends and determinants of iodized salt availability in the household in Ethiopia, 2000 to 2016. A total of 57 939 households were selected for analysis, after considering sampling weight 58 961 households were used as a denominator for pooled analysis. Note that the numbers in the bracket inside the “selected’ boxes are weighted household numbers.
Data analysis
The statistical analysis was performed using STATA 16. Analysis was performed for all EDHS data separately and by pooling them together. Descriptive statistics were performed on selected background characteristics to provide an overall picture of the sample based on EDHS years and the pooled. Cross tabulation on background characteristics and household iodization status were presented as percentages. In computing the descriptive data, we applied sample weights in all cases. Again, to ensure the representativeness of the sample we applied a complex sample design considering household weights, primary sampling units, and the strata associated with it.
The Cochran–Armitage test19,20 was performed to assess the trend of iodized salt availability in the household. Multivariate logistic regression was used to determine the association between the dependent variable and independent variables. The dependent variable for this study was dichotomized, a household categorized as “not having iodized salt” if the measurement result was 0 ppm or presented as “NO,” and having “iodized salt” if the measurement was greater than or equal to 15 ppm or presented as “YES” in EDHS where there is no quantitative measurements. As a default for STATA, the first independent variable category was used as a reference. Some independent variables were categorized for statistical feasibility. The wealth index assumed into 3, “poor” indicates poorer and poorest, “middle” for middle, and “rich” for richer and richest. The altitude of the cluster categorized as high and low altitude using 2500 m as reference. The number of household members divided into 2 categories, less than or equal to 4 and greater than 4. A significance level of .05 was chosen for all analyses.
Results
Background characteristics
To give an overview of the study population, selected background characteristics were given in Table 1. Regional distribution in each year is shown. The percentage of urban households increased from 15.68 in 2000 to 19.90 in 2016. The number of female-headed households was increased from 23.76 in 2000 to 25.55 in 2016 EDHS. There were increments in percentages of radio and television owners with EDHS year. All relevant background characteristics of study households were summarized in Table 1.
Background characteristics of selected households to study iodized salt availability in the household in Ethiopia from 2000 to 2016, based on EDHS data.

Abbreviations: NR, not reported; SNNPR, South Nations, Nationalities, and People’s Region.
NB; the number of populations in each cell has decimal points due the use of weights.
Table 2 presented trends of iodized salt availability based on selected background characteristics. The trend cross-tabulated on different characteristics of the household is almost consistent with the overall trend, indicating progress toward 2005, decline toward 2011, and remarkable increment toward 2016. Despite this nearly consistent trend, cross-tabulation by region showed Benishangul Gumuz region showed almost unchanged coverage in 2011. Even Addis Ababa struggled to maintain the coverage from 2005 to 2011 (declined to 29.57% from 49.57 in 2005).
Percentage of households with iodized salt based on background characteristics in Ethiopia, 2000 to 2016.
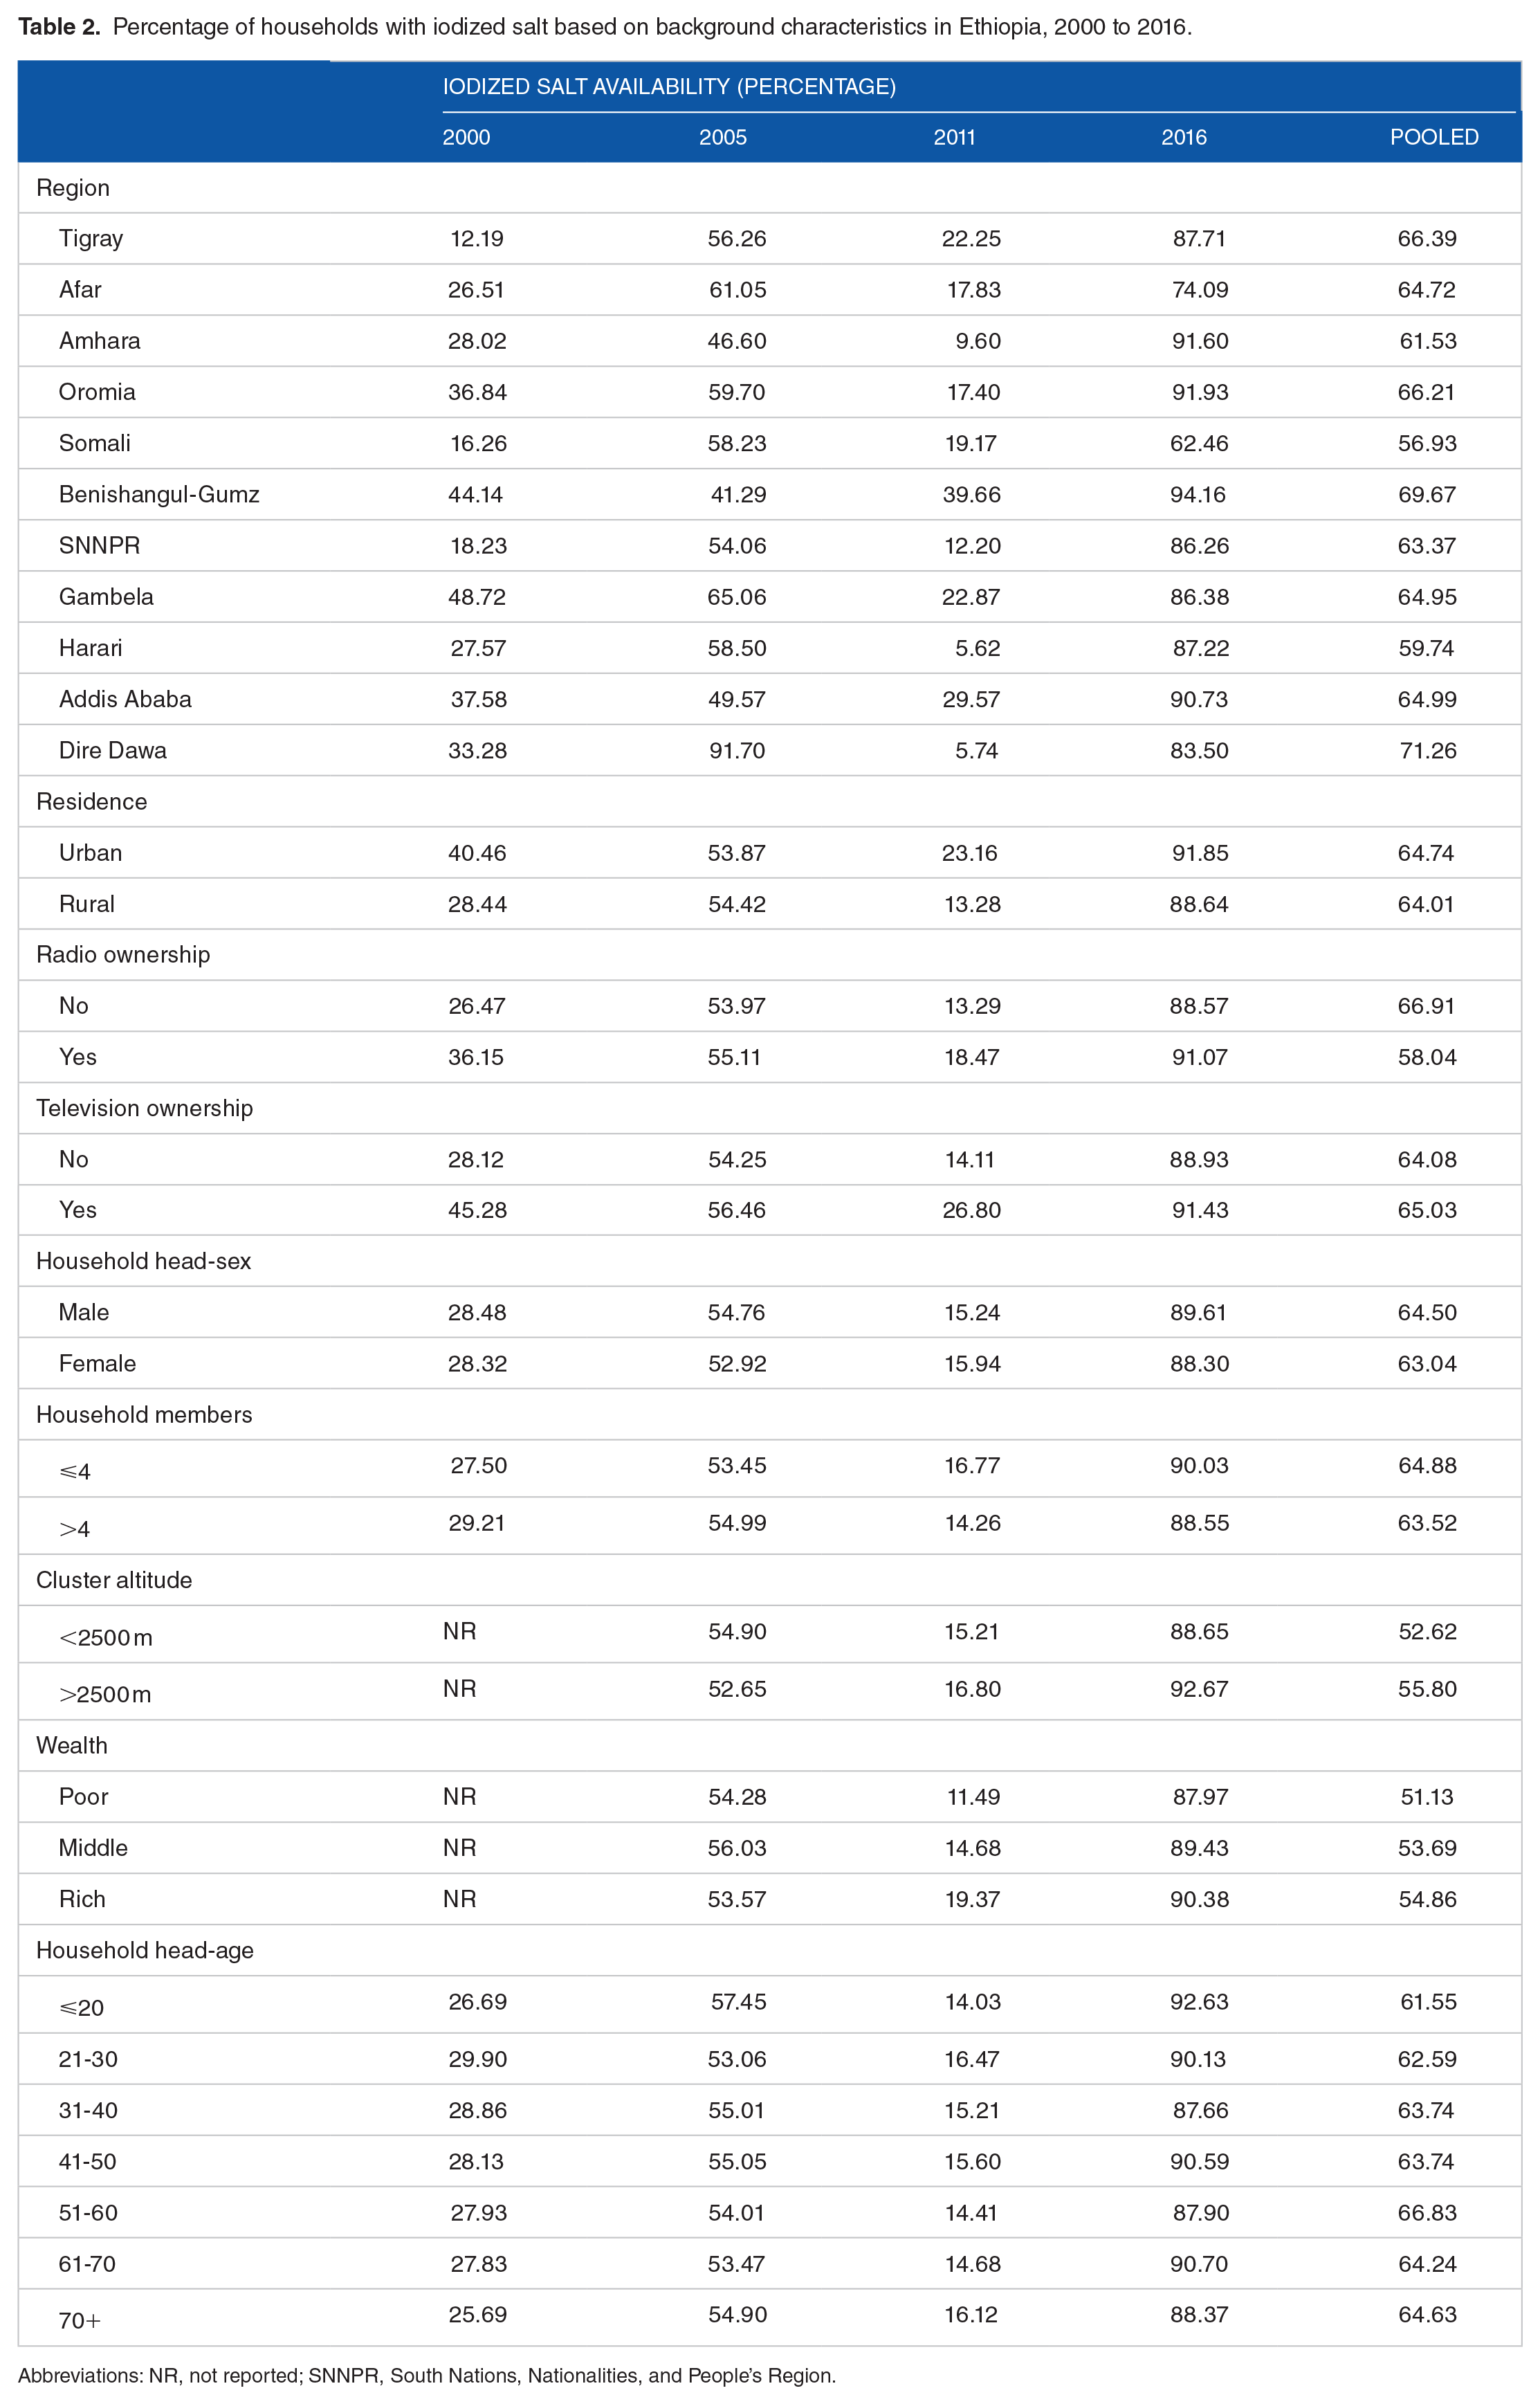
Abbreviations: NR, not reported; SNNPR, South Nations, Nationalities, and People’s Region.
Trends in iodized salt
Figure 2 presented the progress of iodized salt utilization in Ethiopia. Remarkable progress has been made toward 2016, in which Ethiopia was closer to the WHO’s recommendation of universal salt iodization program; 89.28% [95% CI: 88.79-89.75]. Generally, the trend was significant with a positive slop of 0.026, P-value <.001.

Progress of households in salt iodization in Ethiopia, 2000-2016. By the year 2000 28.45% [95% CI: 27.69-29.21] of household had iodized salt, approximately twice the percentage of the 2000 EDHS were observed in 2005-54.34% [95% CI: 53.49-55.18]. Despite this progress notable reduction in percentage of households with iodized salt was recorded in 2011-15.42% [95% CI: 14.86-15.99]. A steeper slope was observed from 2011 to 2016, the percentage of households boosted from 15.42% to 89.26%. The percentage of increment from 2000 to 2005 was 91%. Whereas, from 2005 to 2011 there was a downfall to 15.42, which is equivalent with 71.62% decrement.
Determinants of iodized salt availability in the households
Predictors of iodized salt availability in the household are given in Table 3. In 2000 regional differences exist regarding iodized salt availability among households. Except for the Somali region, all regions had better iodization status compared with the Tigray region. In the same EDHS urban residents, radio ownership, greater than 4 family members in the household had higher odds for iodized salt availability in their household in comparison with their respective reference, see Table 3. In 2005, the regional difference still exists and some had a deteriorated situation compared with the Tigray region and the differences in 2000 EDHS. The Amhara, Benishangul Gumuz, and Dire Dawa had lower odds compared with Tigray. The urban-rural gradient, the ownership of radio, and the number of family members in the household were not significant variables in 2005 unlike 2000.
Multivariate logistic regression to determine predictors of iodized salt availability in the household in Ethiopia from 2000 to 2016.

Abbreviations: NR, not reported; SNNPR, South Nations, Nationalities and People’s Region, Ref: reference.
⩽0.05, ‡<0.01.
Whereas in 2011 SNNP and Harari entered into the lower odds group (in addition to Amhara and Harari), the Benishangul Gumuz region had higher odds. Besides the appearance of wealth index as a predictor of iodized salt availability, no significant variable was observed. In the last EDHS, Afar, Somali, and Dire Dawa had lower odds, and Oromia and Benishangul Gumuz had higher odds for iodization. In that year, the age of the household head was a significant predictor. Roughly, older household heads had lower odds compared with the reference (less than 20 years of age).
Pooling these together, we identified predictors of salt iodization in Ethiopian households. The geographic region, sex of household head, age of household head, wealth index, radio and television ownership, and the number of household members were significant predictors (Table 3). Compared with the Tigray region, the Amhara and Harari regions had significantly lower odds for iodization OR = 0.71 [95% CI: 0.53-0.95] and OR = 0.65 [95% CI: 0.47-0.89] respectively. Female household heads had lower odds for iodized salt OR = 0.88 [95% CI: 0.82-0.95]. As the age of household head increases the odds also increased, significantly 41 to 50 and 61 to 70 years OR = 1.32 [95% CI: 1.06-1.65] and OR = 1.27 [95% CI: 1.02-1.58] respectively.
The wealth index of the household was a significant predictor. As the household wealth index increases, the odds of iodization increased in a dose-dependent manner. Compared with the poor, the middle had 1.17 times higher odds [95% CI: 1.04-1.32] and the rich had 1.27 higher odds [95% CI: 1.07-1.49] for iodized salt availability in the household. Pooling the 4 EDHS data together radio ownership negatively associated with household iodized salt availability. Those households who own radio had 0.71 times lower odds [95% CI: 0.64-0.78] than those who didn’t. On the other hand, ownership of television was positively associated. Those who own television had 1.72 times higher odds [1.37-2.17]. Households having more than 4 members also had lower odds OR = 0.86 [95% CI: 0.79-0.93].
Discussion
In this study, we analyzed iodized salt availability in the household based on the 4 nationally representative EDHS data. We also pulled these individual surveys to determine predictors of household iodized salt availability. Due to the multistage nature of the survey, we used sampling weights for descriptive statistics and complex sample analysis methods. We found that, despite the zigzag characteristics of the graph, much has been improved in iodized salt availability in Ethiopia since 2000. Several factors were determined to have an influence on household iodized salt availability. There have been changes in determinant variables as well. For example, there was a significant difference in the iodization status of urban and rural households in 2000, favoring the urban households. This urban-rural difference was not apparent afterward. The progress could be attributed to the increased market availability of iodized salt in many parts of the country, extensive salt testing in markets and shops, health education involving community-proximate health extension workers, support from international organizations, and strict legislation. 21
Generally, the pooled percentage of households having iodized salt was 64.14%, and the recent EDHS indicated 89.28%, which was 28.45% in 2000. Cross-sectional studies conducted in different parts of Ethiopia indicated adequate salt iodization was available from 31.2% to 68.8% of the households.22 –24 There have been improvements in the percentage of households having iodized salt from the turning of the millennium, especially in Africa. 25 Notable progress has been observed in Ethiopia since 2011. 17 The decline in iodized salt availability in 2011 could be due to the split between Ethiopia and Eritrea; from where most of the iodized salt was coming from. From 2011, Ethiopia passed a USI legislation with enforcement started soon after, with boost production of the Afar region.
Several factors affected the presence of iodized salt in the households. The geographic Region, sex of household head, age of household head, wealth index, radio and television ownership, and the number of household members were significant predictors. Other cross-sectional studies in different parts of Ethiopia have found such variables to be determinants for iodized salt availability in the household.24,26,27 There have been regional differences in household iodized salt coverage in this study as well as previous studies. 28 From literature including recent analysis from EDHS, these geographical differences might arise from lack of access to messages regarding the use of iodized salt which may encompassed the lack of access to mass media,29,30 another factor could be market availability of iodized salt. 31 Other factors for regional discrepancies could be knowledge and attitude gaps regarding the deficiencies and associated consequences. 32
Male household heads had higher odds for iodized salt availability in the household. In Ethiopia, usually males have better educational status, media exposure, and decision power.33,34 As we observed from previous studies higher educational status was associated with better availability of iodized salt in the household. 27 Wealth index was also a strong predictor in dose-dependent manner. Literally, we can think of in terms of the market cost of iodized salt, where iodized salt is costly compared to un-iodized salt. Accessibility might be also another issue for poorer households, which can be explained by the general service availability, infrastructure, and technology. Poorer and remote households may not have access to and information at all.
Ownership of television increased the odds of having iodized salt by 1.71. Radio ownership through the years had a positive influence on household iodized salt, pooling the 4 EDHS data, radio ownership decreased the odds of salt iodization. While previous studies28,29 have found media exposure (which possibly follows the ownership) was effective in rising iodized salt coverage, the pooled effect of radio ownership to decrease the odds is strange. Firstly, ownership is not necessarily media exposure secondly, the type of message could be determinant and thirdly, the influence might be explained by other peculiar characteristics that radio owners exposed and not entered into the analysis. Despite these findings households who had media exposure usually believed to have more information about their health including the importance of iodized salt compared to households without media exposure.
This study is the first nationally representative secondary analysis of household iodized salt magnitude, trends, and determinants in Ethiopia. One limitation of this study was, due to the lack of quantitative measurements regarding the amount of iodine in the salt especially in the last 2 EDHS data the categorization of dependent variables followed only the presence and absence of iodine in the salt. This might inflate the percentage especially in the former two surveys; an inadequate amount of iodine might be categorized under iodized because of the nominal nature of the recent two.
Conclusion
Remarkable progress has been made in Ethiopia regarding iodized salt availability in households in recent years. Besides the current efforts to achieve USI, future interventions should prioritize specific groups like those with lower socioeconomic status, large family size, female-headed households, and should account for regional disparities. Health promotion activities should be selective of the media outlet in broadcasting iodized salt-related messages.
Footnotes
Acknowledgements
The authors would like to acknowledge the DHS program office for giving permission to access the dataset.
Funding:
The author(s) received no financial support for the research, authorship, and/or publication of this article.
Declaration of conflicting interests:
The author(s) declared no potential conflicts of interest with respect to the research, authorship, and/or publication of this article.
Availability of Data and Materials
Ethical Issues
This is a secondary data analysis requiring no direct data collection from human subjects. However, a request to access datasets from DHS was made, and permission was given to use the data.