
Abstract
Objective:
Study the association of dietary habits and other indicators of lifestyle with dysglycemia in Saudi adults.
Methods:
In a cross-sectional design, data were obtained from 1403 Saudi adults (⩾20 years), not previously diagnosed with diabetes. Demographics, lifestyle variables and dietary habits were obtained using a predesigned questionnaire. Fasting plasma glucose, glycated hemoglobin and 1-hour oral glucose tolerance test were used to identify dysglycemia. Regression analysis was performed to determine the associations of dietary factors and other indicators of lifestyle with dysglycemia.
Results:
A total 1075 adults (596 men, and 479 women) had normoglycemia, and 328 (195 men, and 133 women) had dysglycemia. Following adjustment for age, BMI and waist circumference, in men the weekly intake of 5 portions or more of red meat and Turkish coffee were associated with decreased odds of having dysglycemia odds ratio (OR) 0.444 (95% CI: 0.223, 0.881; P = .02) and 0.387 (95% CI: 0.202, 0.74; P = .004), respectively. In women, the intake of fresh juice 1 to 4 portions per week and 5 portions or more were associated with OR 0.603 (95% CI: 0.369, 0.985; P = .043) and OR 0.511 (95% CI: 0.279, 0.935; P = .029) decreased odds of having dysglycemia, respectively compared with women who did not drink fresh juice. The intake of 5 times or more per week of hibiscus drink was associated with increased odds of having dysglycemia, OR 5.551 (95% CI: 1.576, 19.55, P = .008) compared with women not using such a drink. Other lifestyle factors were not associated with dysglycemia.
Conclusion:
Dietary practices by studied Saudis have some impact on risk of dysglycemia, with obvious sex differences.
Introduction
Dysglycemia, which include impaired glucose regulation (LDL-C), and diabetes mellitus (DM), is one of the major factors contributing to high risk for developing cardiovascular disease (CVD),1-3 the number one cause of death globally. 4 Both IGT and type 2 DM (T2DM) are highly prevalent in Saudi Arabia.5,6 Age as well as genetics were reported to be major non-modifiable risk factors for dysglycemia in various populations. 7 However, there are a number modifiable risk factors, mainly dietary habits and other lifestyle factors with a varying degree of importance depending on studied population. 8 Modifying lifestyle and dietary practices has been reported to prevent or even reverse dysglycemia in various clinical trials on populations of different ethnicities.9-15 The association between lifestyle, dietary habits and dysglycemia has not been well studied in people living in the Kingdom of Saudi Arabia. Recently our group investigated these factors in a population sample who had not been previously diagnosed with diabetes in Jeddah to formulate a risk score to identify people at risk of dysglycemia. 16 In the present study we aimed at studying the association of dietary habits and other lifestyle indicators with dysglycemia in Saudi adults with a hope of finding information for developing a T2DM prevention program.
Materials and Methods
Study design and data collection
Samples were collected from Saudi adults (⩾20 years), not previously diagnosed with diabetes, between July 2016 and February 2017, following a detailed protocol outlined earlier. 16 The “Committee on Ethics of Human Research” at Faculty of Medicine, King Abdulaziz University (KAU), and the “Committee on Research Ethics” at Ministry of Health, Kingdom of Saudi Arabia approved the study.
In summary, a cross-sectional design was used aiming to recruit 1500 (750 men and 750 women) participants from selected public healthcare centers by employing stratified, 2-stage cluster sampling method. 17 A consent form was signed by recruited participants. Demographics, lifestyle variables, dietary habits, and personal medical and family history were obtained using a predesigned questionnaire based on factors associated with dysglycemia found in other populations.9-15,18-22 Participants were instructed to fast overnight for 8 to 14 hours, and fasting blood sample was collected to estimate fasting plasma glucose (FPG) and glycated hemoglobin (HbA1c). Another sample was collected 1 hour after ingestion of 50-g glucose solution (CASCO NERL Diagnostics, East Providence, RI, USA) for estimating plasma glucose (1-hour oral glucose tolerance test; 1 h-OGTT).23,24 Results were used to identify dysglycemia. Anthropometric measurements, (height, weight, waist, and neck circumference) and blood pressure (BP) were measured using standardized equipment and techniques as outlined earlier. 16 Weight and height measurements were used to calculate body mass index (BMI) in kg/m2, and categorize participants into underweight (<18.5), healthy weight (18.5-<25), overweight (25-<30), and obese (>30). Abdominal adiposity, based on waist circumference (WC), was defined as level 1 >94 cm for men, and >80 cm for women, and level 2 as >102 cm for men and >88 cm for women.25,26
Biochemical assays
All samples (whole blood or plasma) were analyzed at the Clinical Chemistry Laboratory at National Guard Hospital in Jeddah. HbA1c was measured with HbA1c analyzer G8 (TOSOH Corporation, Japan). Plasma glucose was measured by spectrophotometric methods using Architect c8000 auto-analyzer (ABBOTT, USA).
Definition of dysglycemia
Dysglycemia was defined as an abnormality in blood sugar including prediabetes, and diabetes.1,2 Diabetes was diagnosed using cutoff point HbA1c ⩾6.5%, and/or FPG ⩾7 mmol/L and/or 1 h-OGTT ⩾11.1 mmol/L, while prediabetes was defined when FPG was 6.1 to 6.9 mmol/L (impaired fasting glucose, IFG), and/ or HbA1c 5.7% to 6.4% (39-46 mmol/mol) and/or 1-hour plasma glucose (1-hPG) 8.6 to 11.0 mmol/L (impaired glucose tolerance, IGT).1,2,24,27
Statistical analysis
Data analysis was done using IBM SPSS statistics version 20.0 for Windows. Baseline characteristics were expressed as, frequencies, and mean ± standard deviations (SD). Demographic, clinical, dietary, and lifestyle variables of people with dysglycemia were analyzed by comparing to those with normoglycemia. Independent t-test was used to compare factors with continuous variables between the 2 groups, while chi-square test or Fisher’s exact test, as appropriate, was used to compare categorical variables. Unadjusted and adjusted logistic regression models were used for assessing association between demographic, lifestyle, and dietary variables, and outcome variables namely dysglycemia. Stepwise regression analysis was performed to determine the dietary factors that had an influence on dysglycemia. Only related independent variables, where P < .15 after an initial logistic regression between the dependent and independent variable were used in the corresponding stepwise regression model. A P < .05 value (2-sided test) was accepted as statistically significant.
Results
A total of 1477 adults were recruited for the study by the end of August 2016. Complete data were obtained for 1403 people. Following biochemical measurements, a total of 1075 people (596 men and 479 women) were found to have normoglycemia, and 328 (195 men and 133 women) had dysglycemia. Hence, dysglycemia prevalence was 23% in the studied population.
Association between dysglycemia with anthropometric measurements, lifestyle, clinical, and biochemical characteristics
Lifestyle, demographic, and anthropometric characteristics of the 2 study groups are presented in Table 1. There were significant differences in the means of demographic and anthropometric measurements between the normoglycemic and dysglycemic groups; the dysglycemic group had significantly higher means of age, BMI, weight, fat percentage, and neck, waist, and hip circumferences, and waist to hip and waist to height ratios (all P < .001, Table 1). Men and women dysglycemia groups also had significantly higher means of systolic and diastolic blood pressure compared with people with normoglycemia (P < .05 at least), and significantly higher means of total cholesterol (TC), triglycerides (TG), LDL-C, HbA1C and both fasting and 1 hour plasma glucose and lower high density lipoprotein cholesterol (HDL-C) compared with normoglycemic people (P < .01 at least, Table 1).
Demographic, anthropometric, clinical, and biochemical characteristics of studied groups.

Data are presented as mean ± SD. Differences in measurements between individuals with and without dysglycemia was analyzed using Student’s t-test.
Abbreviations: Circ., circumference; BP, blood pressure; TC, total cholesterol; HDL-C, high density lipoprotein cholesterol; LDL-C, low density lipoprotein cholesterol, TG, triglycerides, HbA1c, glycated hemoglobin.
Denotes significantly different between dysglycemia groups (P ⩽ .05).
Denotes significantly different between dysglycemia groups (P ⩽ .01).
Denotes significantly different between dysglycemia groups (P ⩽ .001).
Comparison of the distribution of various characteristics between the normoglycemia and the dysglycemia groups is presented in Table 2. Of the participants 77.7% with dysglycemia were over 30 years of age, 34.5% of were overweight and 47.3% obese. Additionally, 62.8% of them did not have a regular daily physical activity for at least 30 minutes. Only age, BMI, waist circumference, and physical inactivity were found to be significantly and directly associated with dysglycemia (P < .01 at least, Table 2). Sex, sleeping duration, sitting duration, and smoking habits were not associated with dysglycemia.
Demographic, anthropometric, and lifestyle characteristics of normoglycemia and dysglycemia study groups presented as number of participants and (% of group).

Data is shown as frequency and percentages. Participants were classified according to their BMI as underweight (<18.5 kg/m2), normal 18.5->25 kg/m2, overweight 25-<30 kg/m2 and obese ⩾30 kg/m2. Participants were classified according to their waist circumference as normal adiposity (⩽94 cm for men, ⩽80 cm for women), level 1 (>94 cm for men, >80 cm for women) and level 2 (>102 cm for men, >88 cm for women). Association between measures and dysglycemia was analyzed using chi-square test.
χ2 is the chi-square test value followed by its P-value. Significant differences between groups are shown in bold font.
Sex-differences in dietary habits
The difference in the recorded pattern of dietary habits between men and women is shown in Table 3. Women reported eating more fresh and cooked vegetables compared to men, whereas men had a higher intake of red meat (P < .001). In addition, men reported drinking more fresh and non-fresh juice, soft drinks, energy drinks, red tea, cappuccino and hibiscus drinks compared with women (P < .01 at least), whereas women reported drinking more Arabic and Turkish coffee than men (P < .05 at least). There were no sex-difference in the consumption of fruits, whole grain products, American coffee or cinnamon drink (Table 3).
Dietary habits patterns by sex.
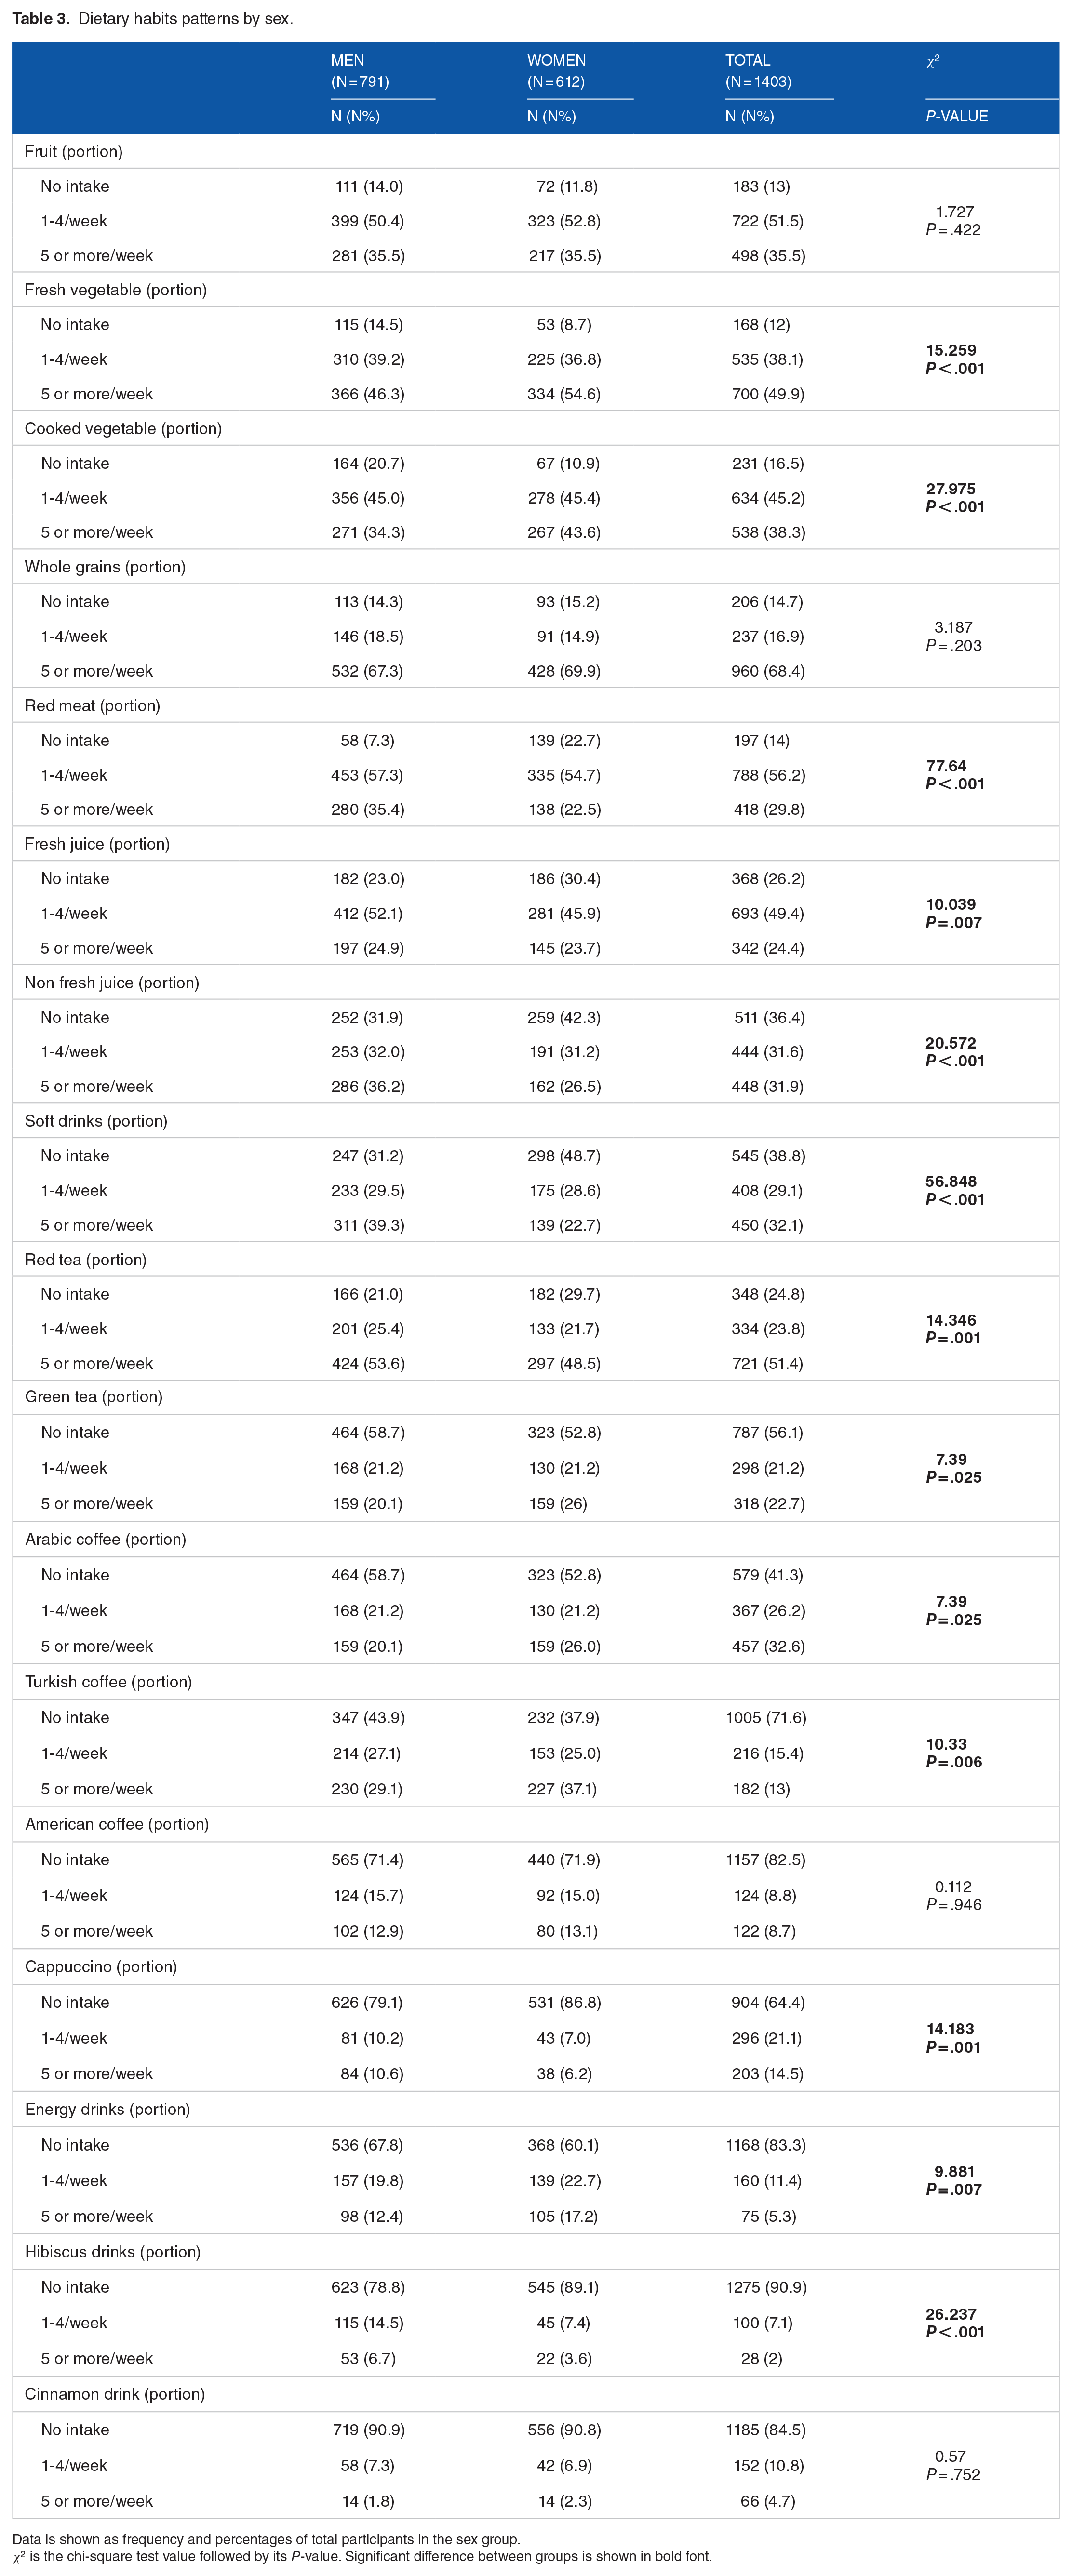
Data is shown as frequency and percentages of total participants in the sex group.
χ2 is the chi-square test value followed by its P-value. Significant difference between groups is shown in bold font.
Association between dietary habits and dysglycemia
Association between dietary habits, physical activity, and dysglycemia in men
Comparing the dietary habits in men between the normoglycemic and dysglycemic groups, the lower intake of red meat, Turkish coffee, American coffee, and energy drinks were significantly associated with dysglycemia (P < .01 at least; Table 4), whereas the higher intake of cappuccino and cinnamon drink was found to be significantly associated with dysglycemia (P = .002 at least; Table 4). Of normoglycemic men, 38.9% had an intake of 5 portions or more per week of red meat compared with 24.6% of men with dysglycemia (P = .001; Table 4). The consumption over 5 cups of other types of coffee (except Arabic coffee that is not roasted) showed a tendency to be higher in normoglycemic people in unadjusted analyses. The intake of Turkish and American coffee 5 portions or more per week was 14.8% and 12.1% of normoglycemic men respectively, compared with 12.3% and 6.2% in men with dysglycemia (P = .003 and P = .002, respectively; Table 4). In addition, 8.1% of normoglycemic men drank 5 portions or more of energy drinks per week compared with 2.6% of men with dysglycemia (P = .002; Table 4).
Dietary habits in men with normoglycemia and dysglycemia.

Data is shown as frequency and percentages.
χ2 is the chi-square test value followed by its P-value. Significant difference between groups is shown in bold font
In logistic regression with adjustment for age, BMI and waist circumference as additional confounders in men, the low intake of red meat and Turkish coffee were the strongest factors associated with dysglycemia (P = .029 and P = .005; Table 5). The weekly intake of 5 portions or more of red meat and Turkish coffee were associated with decreased odds of having dysglycemia (OR = 0.444 (95% CI: 0.223, 0.881) P = .02 and OR = 0.387 (95% CI:0.202, 0.74) P = .004, respectively, Table 5). In multivariable regression analysis, no associations between other dietary factors and dysglycemia were observed in men.
Unadjusted and adjusted odds ratio (OR) with its 95% confidence interval (CI) for dietary predictors of dysglycemia in men.

NS, variable was not included in the model as it was not significant after an initial logistic regression between the dependent and independent variable were used in the corresponding stepwise regression model.
Significant differences between groups are shown in bold font.
Among other lifestyle variables, physical activity was the only predictor for dysglycemia in men when analyzed without adjustment, but the significance disappeared after adjusting for age, BMI and waist circumference (Table 6).
Unadjusted and adjusted odds ratio (OR) with its 95% confidence interval (CI) for physical activity as a predictor of dysglycemia in men.

Significant differences between groups are shown in bold font.
Association between dietary habits, other lifestyle factors and dysglycemia in women
Comparing the dietary habits in women between the normo- and dysglycemic groups, a low intake of fresh juice (P = .027) and high intake of hibiscus drinks (P = .005) and cinnamon drinks (P = .001) were significantly associated with dysglycemia (Table 7). There was a non-significant trend towards for the association between the high intake of green tea and dysglycemia (P = .056, Table 7). Of normoglycemic women had an intake of 1 to 4 portions per week of fresh juice and 24.4% of them had an intake of 5 or more potions per week compared with 39.1% and 21.1% of women with dysglycemia respectively (P = .027, Table 7). On the other hand, 6% and 12.8% of women with dysglycemia had an intake of hibiscus drink 5 times per or more compared with only 1.3% and 3.5%, respectively of normoglycemic women (P = .005 and P = .001 respectively, Table 7).
Dietary habits in women with normoglycemia and dysglycemia.
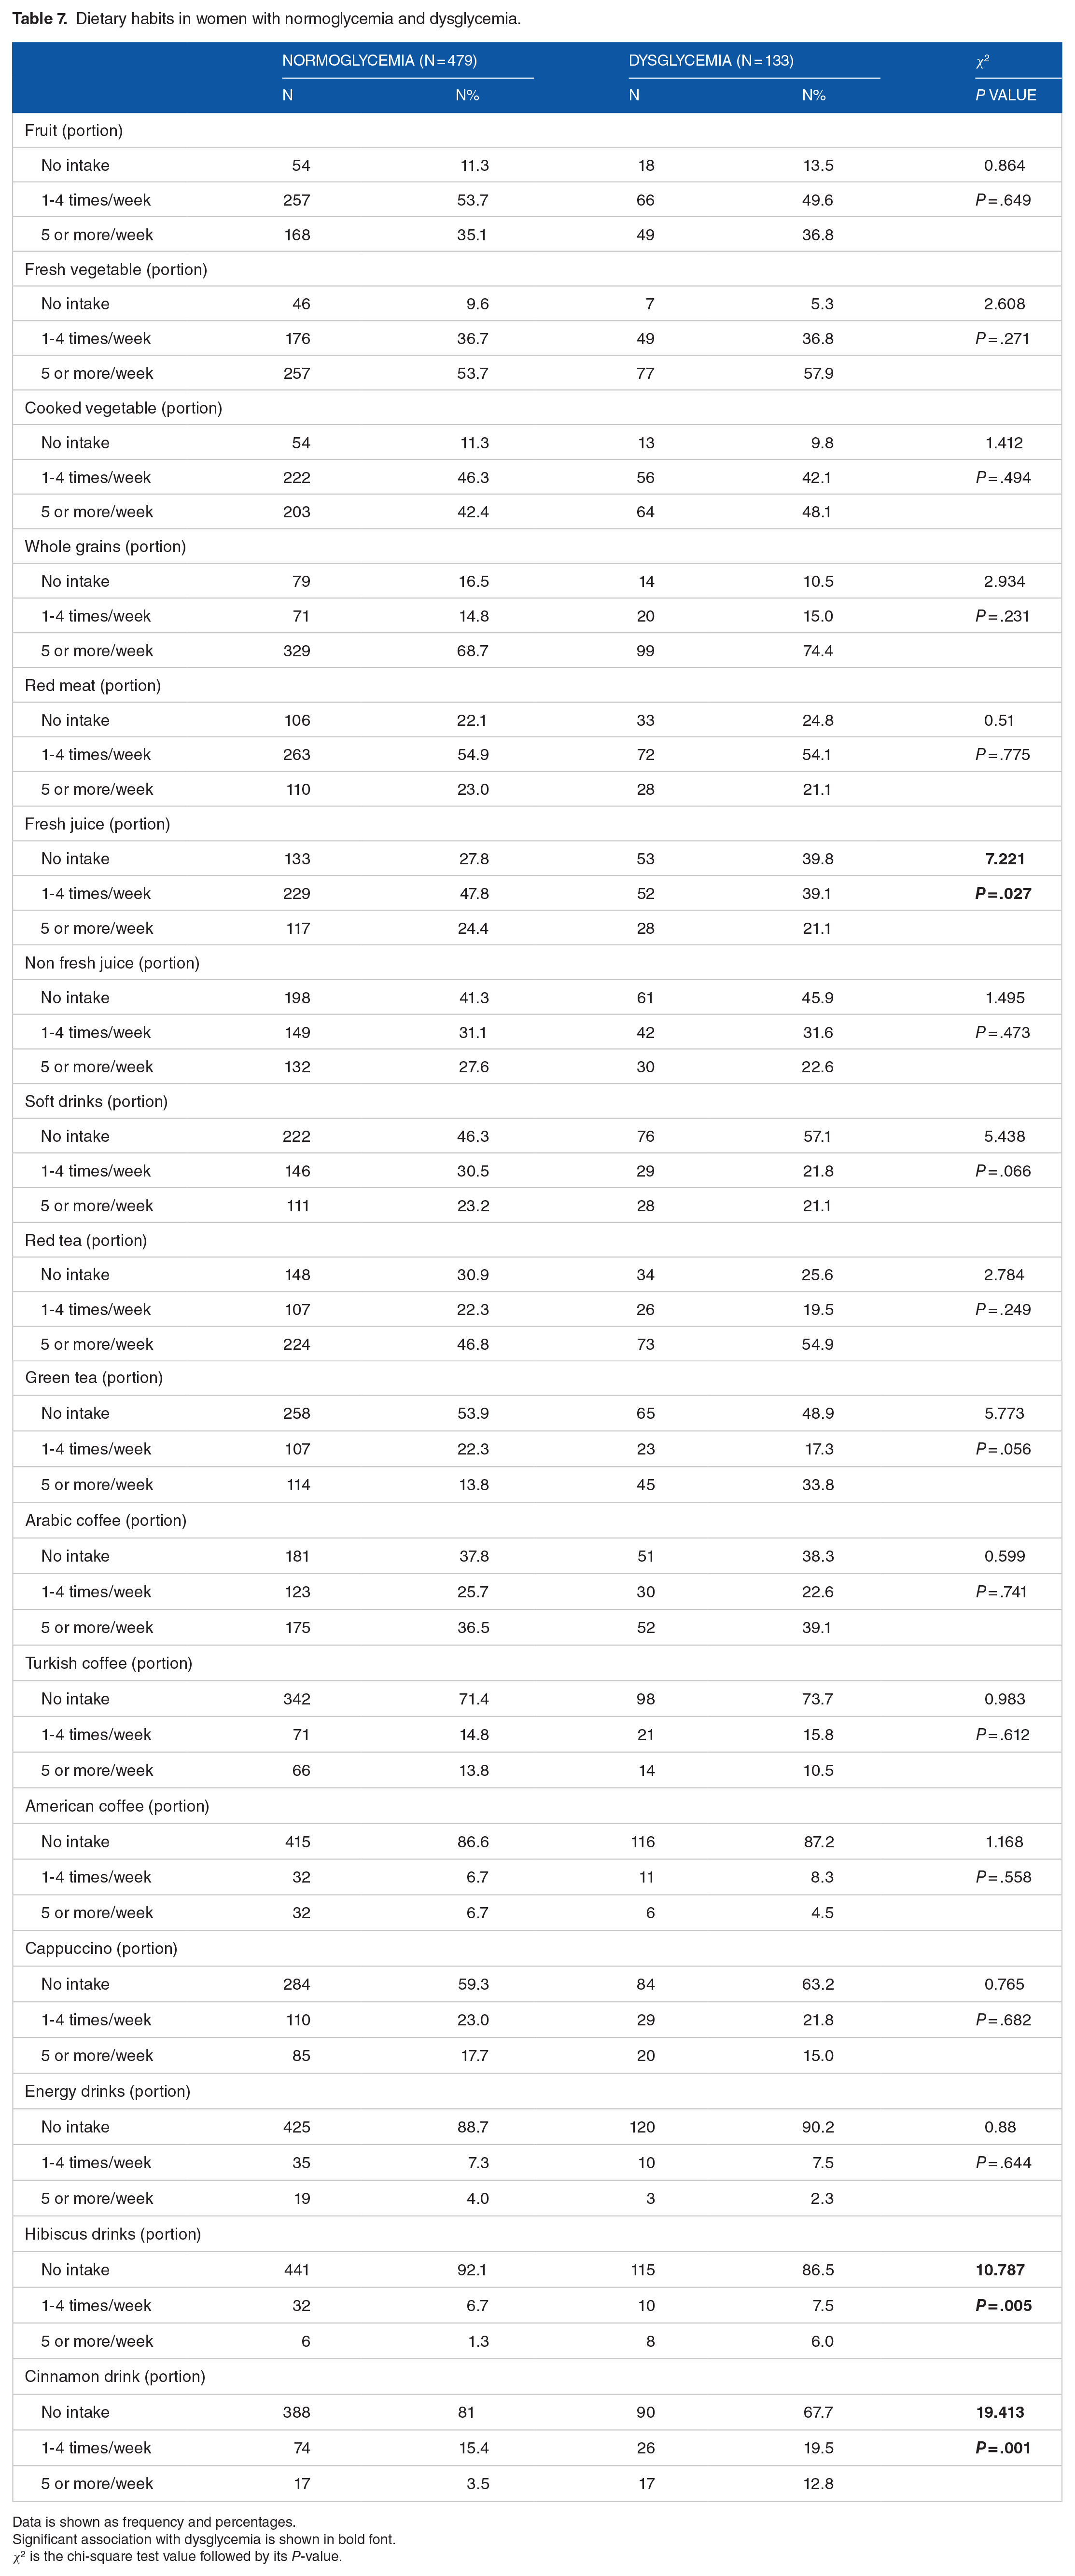
Data is shown as frequency and percentages.
Significant association with dysglycemia is shown in bold font.
χ2 is the chi-square test value followed by its P-value.
In logistic regression with adjustment for age, BMI, and WC as additional confounders in women, the low fresh juice and high hibiscus drink intake were the strongest factors associated with dysglycemia in women (P = .047 and P = .023, respectively; Table 8). The weekly intake of 1 to 4 portions per week and 5 portions or more of fresh juice was associated with 0.603 and 0.511 decreased odds of having dysglycemia in women respectively compared with women who did not drink fresh juice (OR = 0.603, 95% CI: (0.369, 0.985), P = .043 and OR = 0.511, 95% CI: (0.279, 0.935), P = .029, respectively). The intake of 5 times or more per week of hibiscus drink was associated with 5.551 increased odds of having dysglycemia in women compared to no intake (OR = 5.551, 95% CI: (1.576, 19.55), P = .008; Table 8). There were no associations between other dietary factors and dysglycemia in women. No other lifestyle variables were predicting dysglycemia in women (data not shown).
Unadjusted and adjusted odds ratio (OR) with its 95% confidence interval (CI) for the predictors of dysglycemia in women.
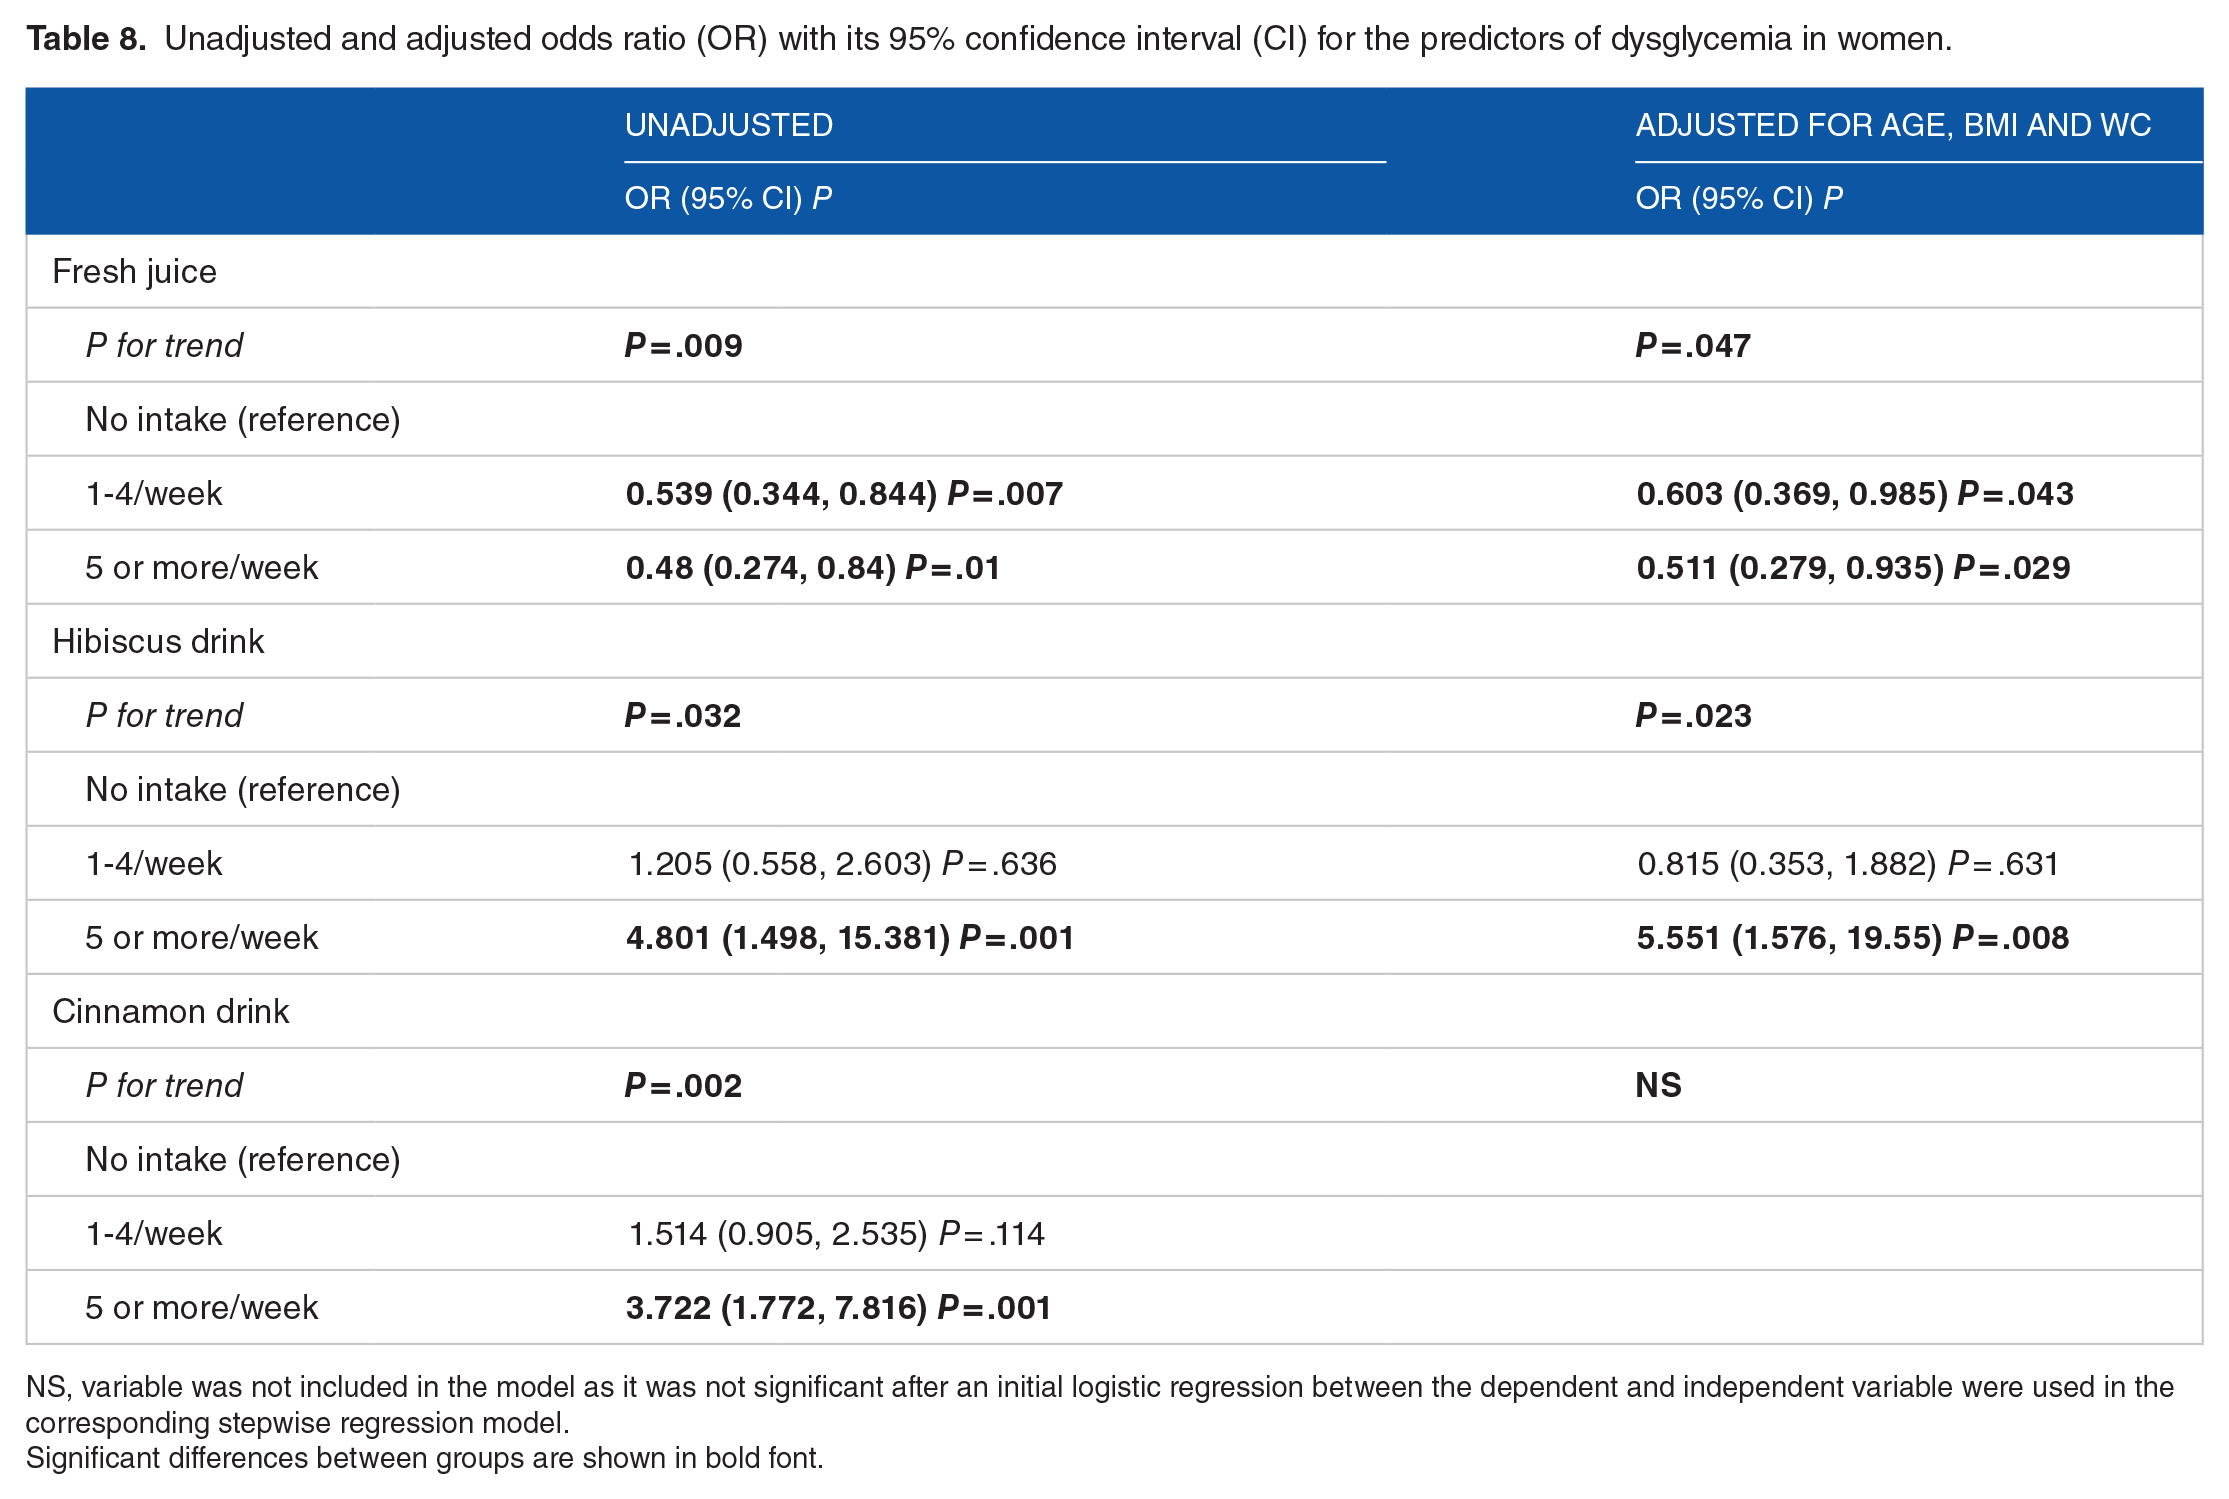
NS, variable was not included in the model as it was not significant after an initial logistic regression between the dependent and independent variable were used in the corresponding stepwise regression model.
Significant differences between groups are shown in bold font.
Discussion
Successes of programmes focusing on modifications of lifestyle and dietary practices in preventing or reversing type 2 diabetes mellitus and prediabetes (ie, dysglycemia) has been reported in different populations.9-15 In view of the high prevalence of dysglycemia in Saudi Arabia,5,6 investigating factors associated with the condition is urgently needed in order to develop a local, evidence-based, dysglycemia prevention programme. Therefore, in this study we aimed at investigating the association between dietary habits and other lifestyle factors with dysglycemia in Saudi adults not previously diagnosed with diabetes.
Our study was conducted in Jeddah, the largest city in the Western region of the country, with a population of mixed ethnicities, reflecting a good representation of the multi-ethnic nature of the country as noted in earlier survey, 6 and a myriad of dietary and other lifestyle habits and practices. Excluding people with previously diagnosed with diabetes helped to ensure that the reported lifestyle and dietary habits were the actually practiced without knowledge of person’s diabetes and not modified following diagnosis.
Most available risk scores to identify individuals at increased risk of developing dysglycemia have included high age, BMI and abdominal obesity, decreased physical activity, smoking status, and low vegetable intake as risk predictors.19-22,28,29 A high intake of red meat, low intake of whole-grain bread, and low coffee consumption have also been identified as a risk predictors by some studies.30,31 We included all of these factors in our study and also other factors reported to be associated with dysglycemia such as sleeping duration, sitting hours/day, and the intake of various beverages including herbal teas which have been found to have an implication on disglycemia.32,33
In our recently developed dysglycemia risk score to identify people at high future risk of developing T2M in Saudi Arabia, 16 men sex, age, abdominal obesity, past history of dysglycemia, and family history of T2DM were the only factors included in the final mode. Therefore, we adjusted for these factors while analyzing our data.
The current study found that the prevalence of dysglycemia is 23% in this Saudi population sample and that age, obesity and dyslipidemia were significant determinants of dysglycemia, agreeing with what was previously reported. 34
Among other studied lifestyle variables, only low physical activity (defined as <150 minutes per week) was associated with dysglycemia in the current study. It was a predictor for dysglycemia in men only when analyzed without adjustment, and its significance disappeared although a trend toward significance remained after adjusting for age, BMI and waist circumference. This suggests that some obese people probably have started physical activity in an effort to control their weight gain. The upper limit of the 95% CI, 1.973, also suggests that high physical activity could be a significant protective factor for dysglycemia when studied on a larger sample. This association may relate to the effect of exercise on increasing insulin sensitivity. 35 It is reported that a single session of moderate exercise increased the glucose uptake by 40% at least, and this occurred through an increase in insulin-stimulated glucose transport-phosphorylation which allowed a 2-fold increase in insulin-stimulated glycogen synthesis in muscle, and hence, higher uptake of glucose. 36 In addition, this inverse relationship between exercise and dysglycemia could be explained by its effect on reducing general inflammation. 37 A previous intervention study reported that reducing body weight in obese women through reducing the caloric intake and increasing physical activity resulted in a significant reduction in the levels of IL-6 and IL-18 pro-inflammatory cytokines and CRP (C-reactive protein) which play a significant role in the pathogenesis of diabetes mellitus, and an increase in adiponectin levels which has anti-inflammatory properties 37 and insulin-sensitizing effects. 38
Sleep duration was reported to have a U-shaped relationship in a previous meta-analysis with the risk of T2DM with sleeping 7 to 8 hours per day carrying the lowest risk. 32 Similar U-shaped relationship was observed in this study, but the sample size was not enough to reach statistical significance. Similarly, we noted that dysglycemia was higher in smokers and previous smokers agreeing with previous findings, 39 but the sample size was not enough to reach statistical significance.
Fruit and vegetable consumption was not associated with decreased dysglycemia in the current study. However, the higher intake of fresh fruit juice was associated with decreased dysglycemia in women only even after adjustment for age, BMI and waist circumference. This suggests that individuals who are following a healthier lifestyle might be replacing some sugar sweetened beverages with fruit juices in an effort to have healthier options.
However, our findings disagree with findings from a previous large prospective study on a cohort of middle-aged American women with an over 18 years of follow up which reported a positive association between fruit juice consumption and diabetes risk. 40 This disagreement could be explained by the fact that there is a far less consumption of fruit juice by the Saudi population than the American population. A previous study reported that only 2.6% of Saudis aged 15 years or older met both the Saudi and the Center of Disease Control and Prevention (CDC) guidelines for daily consumption of fruits and vegetables as measured by the average daily consumption of fruits, 100% fruit juices, and vegetables suggesting that the intake of 100% fruit juices is too low in the Saudi population. 41 In addition, a huge variety of fruit juices exist and they may also vary among countries for the simple sugar concentration and fiber.
Red meat consumption was inversely associated with dysglycemia in men only in the current study. This disagrees with the findings from previous multiethnic cohort studies in USA and meta-analysis that both unprocessed and processed meat intake was associated with type 2 diabetes.42,43 This variability in the association between red meat consumption and risk of dysglycemia between our study and previous international studies42,43 could be due to the difference in the animal source of consumed red meat. Lamb meat is the most consumed red meat in Saudi Arabia. Camel meat is also commonly consumed. Moreover, processed meat is not widely consumed among Saudis, but meat is often directly used in stews and casseroles. Apart from a cohort study of individuals from 30 communities from different parts of Finland reported that unprocessed red meat consumption was not a risk factor for diabetes, 44 there are no studies that investigated the effect of each meat type separately on dysglycemia. Also there are no studies that investigated this association in populations were lamb meat is common such as in Arab populations. In addition, the difference in the nutritional value and health effects of lamb, beef and camel meat is poorly studied. It has been previously mentioned that lamb meat contains higher concentrations of n-3 polyunsaturated fatty acids compared with beef meat. 45 A recent meta-analysis reported that the increased intake of n-3 polyunsaturated fatty acids is related to a decreased risk of metabolic syndrome, 46 which might explain the inverse association between red meat intake and dysglycemia observed in the studied Saudi population where the most consumed meat is lamb. Men had a higher consumption of meat than women in the current study which might explain the absence of the inverse association between red meat intake and dysglycemia in women.
The higher intake of Turkish coffee was associated with decreased dysglycemia in men in the current study. Also the consumption over 5 cups of other types of coffee (except Arabic coffee that is not roasted) showed a tendency to be higher in normoglycemic people in unadjusted analyses. A meta-analysis suggests that an increase in coffee consumption reduces the risk of T2DM by 6% for each cup-per-day. 47 A cup of Turkish coffee contains 6 to 12 mg of diterpenes, mainly Cafestol and kahweol as it does not undergo filtration process. 48 In vitro studies suggested that cafestol in coffee may aid in protection of coffee drinkers from T2DM as small concentrations of cafestol (10−10-10−6 M) showed a significant increase in insulin secretion by insulinoma cells and also in glucose uptake by skeletal muscle cells. 49 A systematic review suggested that the possible mechanisms behind this association is the high concentration of polyphenol, chlorogenic acid, and that coffee components induce modulation of adenosine receptor signaling; and microbiome content and diversity, in addition to their thermogenic, antioxidative, and anti-inflammatory properties. 47 The intake of Turkish coffee was reported to be higher in women in our study but the its inverse associated with dysglycemia was observed only in men suggesting that there might be variations in the metabolic response to it between sex groups, or that other components in the diet of women mitigate this effect.
High intake of hibiscus tea was associated with dysglycemia in women in the current study. Despite the fact that hibiscus tea was previously established to slow the rate of rise in blood glucose following consumption of high glycemic index food and have hypoglycemic properties, 33 it is commonly consumed with high amount of sugar due to its high acidity explaining its association with dysglycemia in the studied Saudi population. Future studies investigating diet-disease associations should modify the used FFQs to include information about sugar sweetening of drinks.
Our study has limitations as well as points of strength. Our study is the first in our region to include detailed dietary and other lifestyle practices, and to investigate sex differences in association between these practices and dysglycemia. In addition, since sample selection to avoid bias is most important, we have avoided bias by random selection of PHC and included volunteers. Furthermore, data collections was carried out by well-trained data collectors using standardized methods.
Our main limitation lies in the cross-sectional design, which can only suggest associations, but does not allow inferences about cause and effect. Secondly, since our data relied on self-reported dietary and lifestyle practices, errors in reporting are expected. This is common in all similar papers relying on questionnaires to collect information. However, we tried to minimize errors by conducting face to face interviews by trained data collectors. Finally, our sample size was relatively small, but it was enough to detect several associations.
Conclusion
In conclusion, dietary practices among the sample of adult Saudis studied have some impact on risk of dysglycemia, with obvious sex differences. A study of the impact of lifestyle habits in a larger sample, preferably using a prospective study design, needs to be carried out. Such more detailed studies are needed before reaching firm recommendations for the construction of dysglycemia prevention programmes in Saudi populations.
Footnotes
Acknowledgements
We thank the Deanship of Research in King AbdulAziz University in the highly cited program for supporting this work. We also thank Lubna Al-Shaikh for cleaning the data.
Funding:
The author(s) disclosed receipt of the following financial support for the research, authorship, and/or publication of this article: This work was supported by King Abdulaziz University, grant number (2-140-1434-HiCi).
Declaration of conflicting interests:
The author(s) declared no potential conflicts of interest with respect to the research, authorship, and/or publication of this article.
Authors’ Contributions
Conception and design: all authors. Administrative support: SB, HJ, RA, GA, JA. Provision of study materials or patients: SB, HJ, RA, GA, JA. Collection and assembly of data: SB, HJ, RA, GA, JA. Data analysis and interpretation: SE, SB, HJ. Manuscript writing: all authors. Final approval of manuscript: all authors.