
Abstract
Background:
Zimbabwe lacks information on physical activity levels, the available information is based on estimates.
Aim:
This study compared physical activity levels in rural and urban settings. The relationship between the level of physical activity and metabolic risk factors for non-communicable diseases was also analysed.
Setting:
The study took place in Bulawayo city (urban) and Mashonaland East province (rural).
Methods:
Multi-stage probability-based sampling was used to select 200 male respondents from Bulawayo Province (urban) and 200 male respondents from Mashonaland East Province (rural). The study used the enumeration areas (EAs) used during the 2012 census and represented wards. In total, 10 enumeration areas were randomly selected, and 40 households were randomly selected in each of these enumeration areas. Logistic regression was used for all statistical analyses.
Results:
Rural respondents were 62% more likely to meet the World Health Organisation (WHO) required physical activity level than urban respondents. The rural group was 158% more likely to have intermediate physical activity levels (600-2999 METs) than the urban group. Those meeting the WHO recommended physical activity level were 51% less likely to have elevated blood glucose. Facilities to promote physical health are not being used.
Conclusions:
The rural group was more physically active than the urban group. High physical activity reduces the risk of metabolic risk factors for non-communicable diseases such as diabetes.
Contribution:
Promotion of good health by reducing risk factors for non-communicable diseases.
Introduction
About 3.2 million deaths worldwide are caused by lack of physical activity. 1 The report by the World Health Organisation (WHO) notes that lack of physical activity causes approximately 21% to 25% of breast and colon cancer, 27% of diabetes and approximately 30% of all ischaemic heart diseases. 1 Physical activity in adults has been linked to reduced prevalence of type 2 diabetes, mental health problems, obesity, stroke and cancer. 2 Physical activity is linked to reduced all-cause mortality and increased life expectancy. 3 This led to 1 scholar considering physical exercise a miracle drug. 4 Physical activities protect people from suffering from non-communicable diseases, and those that embark on physical activities for at least half an hour on most weekdays are at a reduced risk of developing NCDs by 20% to 30%. 5 Literature has shown clearly the benefits of physical activity but worldwide, there are very high levels of physical inactivity. In 2020, 31% of adults were physically inactive, that is, less than 150 minutes of physical activity per week and 20% of males failed to reach the target of 150 minutes a week. 6 The number of people who are not physically active in high-income countries doubles that in low-income countries. The levels of physical activity vary from region to region, that is, eastern Mediterranean region (40%), Southeast Asia (40%), West Pacific region (28%), African region (16%) and European region (25%). 6 Studies on physical activity levels have been done mainly in developed countries leaving an information gap on Sub-Saharan Africa. 7 However, analysis of the available data on physical activity in Sub-Saharan Africa showed that 83.8% of men met the WHO recommended level especially those in rural areas. 8
In Zimbabwe 39% of deaths are due to the NCDS and these deaths have been linked to lifestyle risk factors like lack of physical activity. 9 Reports on physical activity in Zimbabwe mainly focus on adolescents. According to a 2022 report on adolescents, 63% of adolescents are involved in moderate physical activities with scores less than 600 METs. 10 This shows that physical activity levels are still low. However, this report only focussed on adolescents aged 8 to 16 years, showing that there are gaps in terms of information on physical activity in Zimbabwe. A WHO report of 2022 states that 23% of males aged 18 years and above are physically inactive. 9 However, these statistics were based on estimates and have a high degree of uncertainty. There is a need for a study that can take actual measurements and obtain more realistic statistics for Zimbabwe. This study sought to bridge this gap by conducting a survey in 2 provinces (rural and urban settings). This study aimed to link physical activity levels to metabolic risk factors for NCDs, such as blood pressure, blood glucose and body mass index. These are risk factors for NCDs. This study sought to measure the physical activity levels of people in rural and urban settings. It also assessed the demographic factors influencing physical activity level. The other objective was to assess the influence of physical activity on metabolic risk factors for NCDs like blood pressure, blood glucose and body mass index.
Alpha: the probability of making a Type I error (-level), that is, the probability of rejecting the null hypothesis when in fact it is true, set at .05 for a 2-sided test to determine if there is a statistically significant difference
Beta: the probability of making a Type II error (-level), that is, the probability of accepting the null hypothesis when in fact it is false, set at .20 power
Proportion 1 (%): the exposed group from the urban province (18.1%)
Proportion 2 (%): The exposed group from the rural province (8.3%)
The calculation gave 184 and 9% was added to cater for non-response to give a sample size of 200 from each province. The inclusion criteria for participants was any male aged 18 years and above and those that slept in the household at least 4 nights in the last week of the study. Exclusion criteria was any male below the age of 18 years and were visitors that is, those that did not spent at least 4 nights in the last week of the study. Provinces were reduced to districts, districts were reduced to wards, and households were randomly selected from the wards. The study used the enumeration areas (EAs) that were used during the 2012 census, and the wards were represented by these EAs. These EAs have household locations, which makes it easy to sample households. In total, 10 EAs were randomly selected and 40 households were randomly selected in each of these enumeration areas.
The total number of MET-Minutes/Week was calculated as MET value of activity*number of minutes per day*number of days per week. The WHO recommended level of physical activity for health is 150 minutes of moderate-intensity physical activity 0 r,75 minutes of vigorous-intensity activity, or an equivalent combination of moderate- and vigorous-intensity activity achieving at least 600 MET-minutes. The calculated values were compared to the 600Met-munites and any values below this were considered insufficient. Show cards were used to help participants determine the type of activities they embarked on to help determine the MET value.
A weighing scale was used to measure people’s weight, and the respondents were asked to remove their shoes. A portable height/length measuring board was used to measure height according to WHO recommendations. Body mass index (BMI) and waist-to-height ratio were calculated to compare the obesity levels between the 2 areas. For BMI, the ranges used were as follows: ⩾30 (obese), 25 to 30 (overweight), 18.5 to 24 (normal) and <18.5 (underweight). A blood pressure monitor was used to measure the blood pressure, and 3 readings (2 minutes apart) were taken for each participant. Normal blood pressure ranged from 120/80 to 139/89 mmHg. For blood glucose measurement, a glucose metre was used and each measurement was taken 2 h after taking a meal. Blood glucose levels were determined from measurements using a glucose metre. The metres were calibrated between strip batches, and a code with a correction factor was used. Measurements were performed in the morning, before the participants had breakfast. The advantage was that these readings were taken at night and are important for sugars related to diabetes control. Normal blood sugar levels were between 4 mmol/l to 6.9 mmol/l. Univariate regression analysis was used to determine the relationships between variables and evaluate the predictors of diabetes, hypertension and obesity.
Analysis: SPSS version 23 was used for analysis of data. Distance from the facilities that promote physical exercises was measured in km and time spend reclining in a chair was measured in hours (relied on reported information). For analysis, Information on age was divided into 4 categories (18-24, 25-34, 35-44, 45+), education was also divided into 3 categories (primary, secondary, tertiary), monthly income (US$) was categorised into 4 classes (0-200, 201-400, 401-600, 601+) and marriage status was divided into 3 classes (single, married/cohabiting, divorced/separated/widowed). Multivariate analysis was performed for the effects of demographic variables on physical activity level. For analysis we adjusted for place of residence, age, marital status, education level, income, distance from facilities that promote physical exercise. Physical activity level was used as an independent variable to determine its influence on metabolic risk factors (blood glucose, blood pressure, body mass index). For comparison of variables, t-tests were used for continuous data and chi-square tests were done for categorical data. Multinomial regression analysis was performed for the predictor variables at a significance level of P < .05.
Results
Demographic characteristics
Rural respondents were 92% more likely to earn between $0 and $200.00 but were 93% less likely to earn above $601.00. The rural group was 187% more likely to be aged between 18 and 24 years and 65% less likely to be aged between 35 and 44 years and 46% less likely to be aged 55 years and above. Respondents from the rural setting were 53% more likely to have secondary education but they were also 44% less likely to have a post graduate degree. Although respondents from the rural setting were 96% more likely to be single, they were also 81% less likely to be separated, divorced or widowed as shown in Table 1.
Demographic characteristics.

Physical activity characteristics
Table 2 shows that the rural group was 69% less likely to participate in moderate work activities than the urban group. The rural group was 162% more likely to participate in vigorous sports than the urban group. Rural respondents were 38% less likely to have low physical activity levels of METs between 0 and 599, than the urban respondents. The rural group was 158% more likely to have intermediate physical activity levels (600-2999 METs) than the urban group. Respondents from rural areas were 43% less likely to be involved in high-level physical activities (3000+ METs) than those in urban areas. Rural respondents were 62% more likely to meet the WHO-required physical activity levels.
Physical activity characteristics.
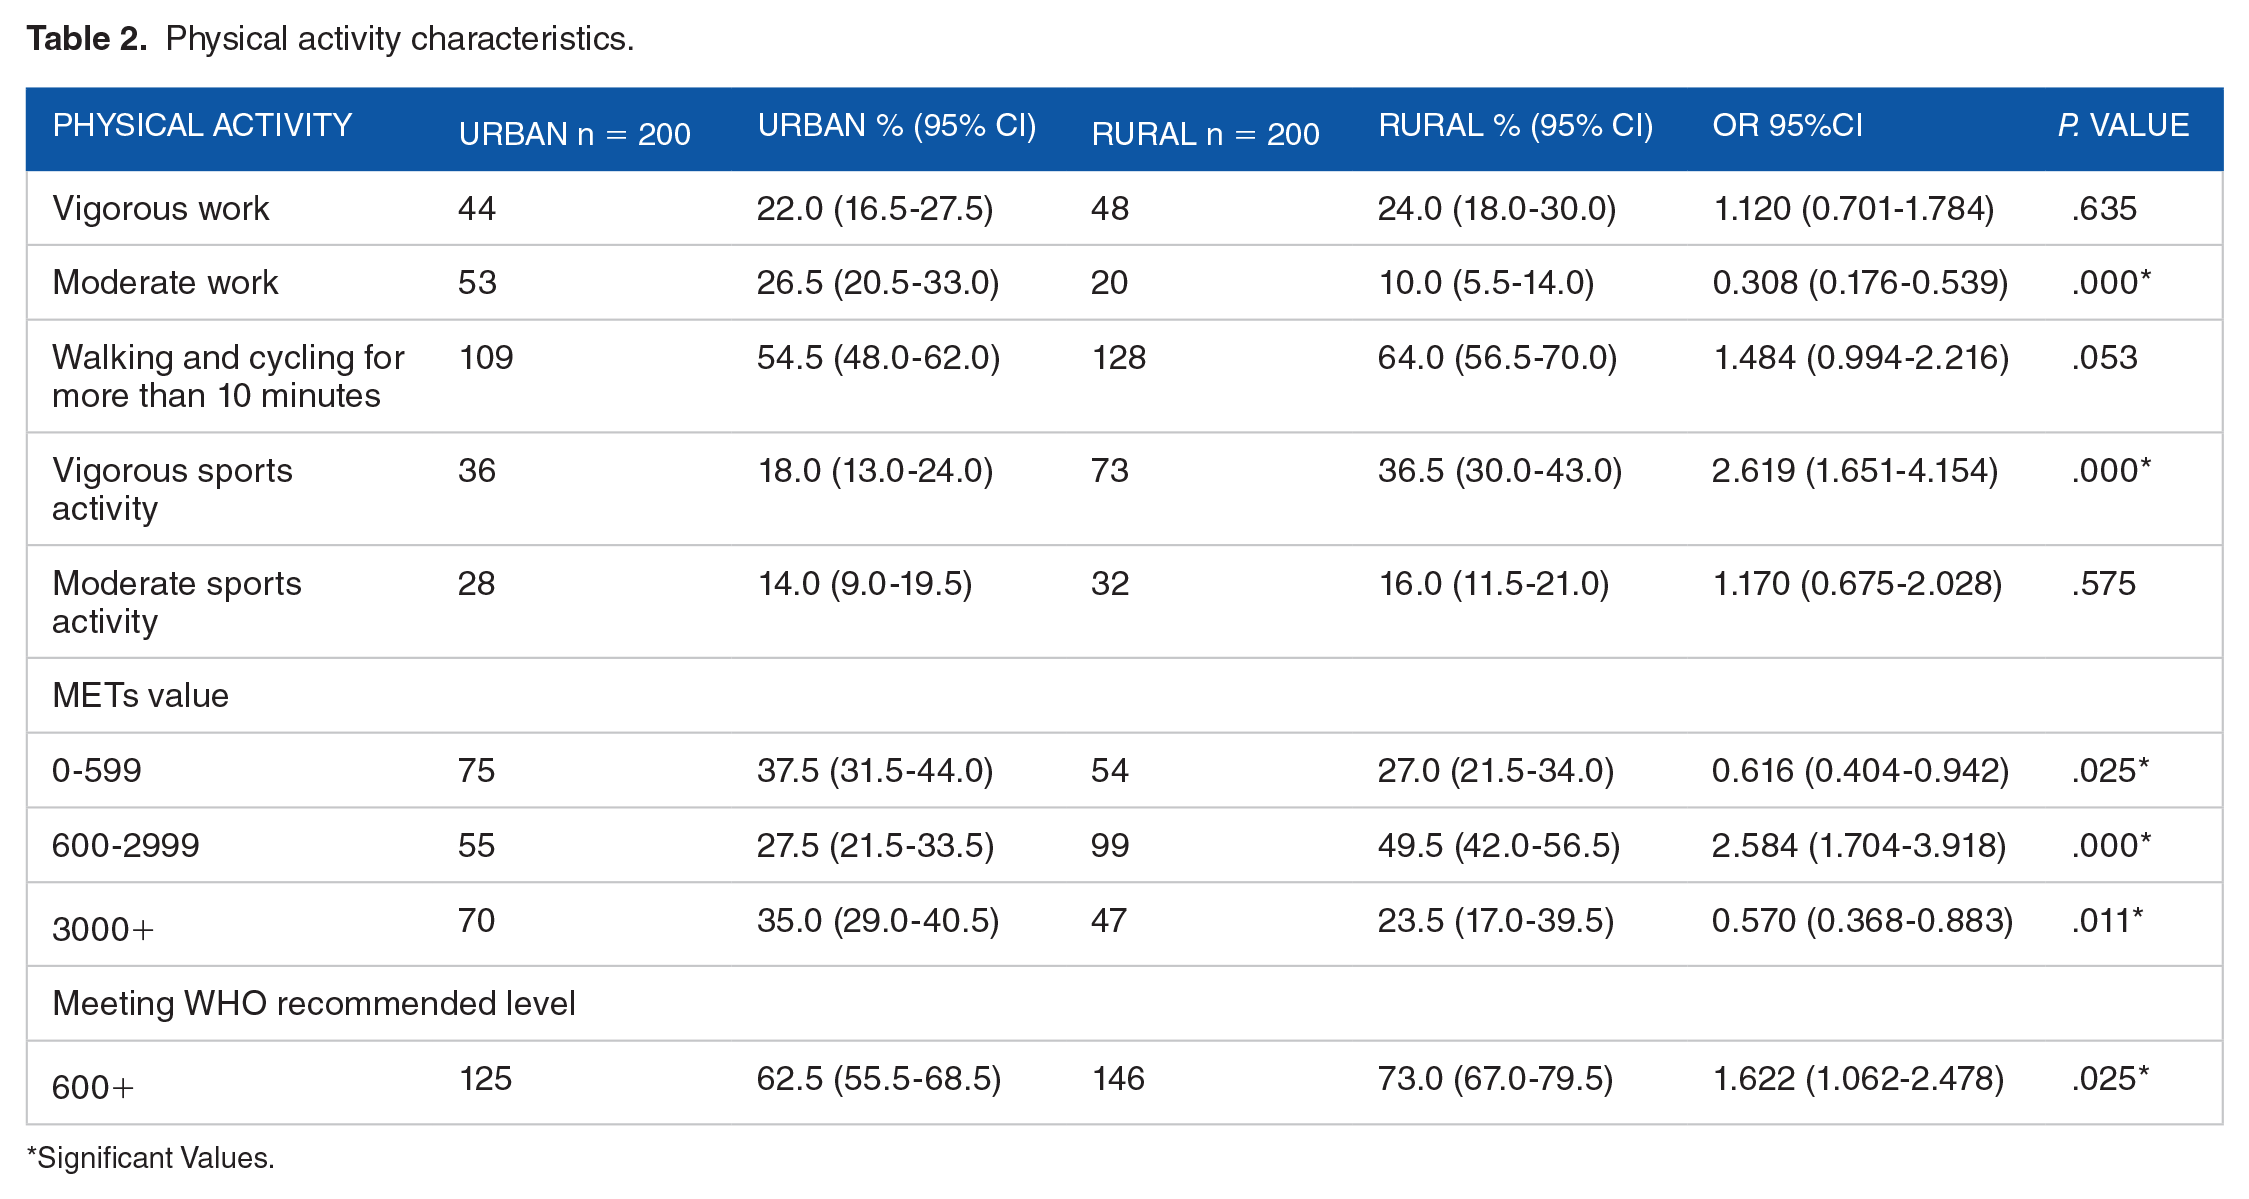
Significant Values.
Facilities and activities promoting physical exercises
Rural respondents were 4% more likely to fetch firewood and water than urban respondents were. Rural respondents were 41% less likely to report no involvement in physical activity. The rural group was 35% less likely to travel less than 1 km to their nearest facilities than the urban group as shown in Table 3.
Physical exercise facilities.

The relationship is significant (less than 0.05).
Physical activity and demographic and socioeconomic factors
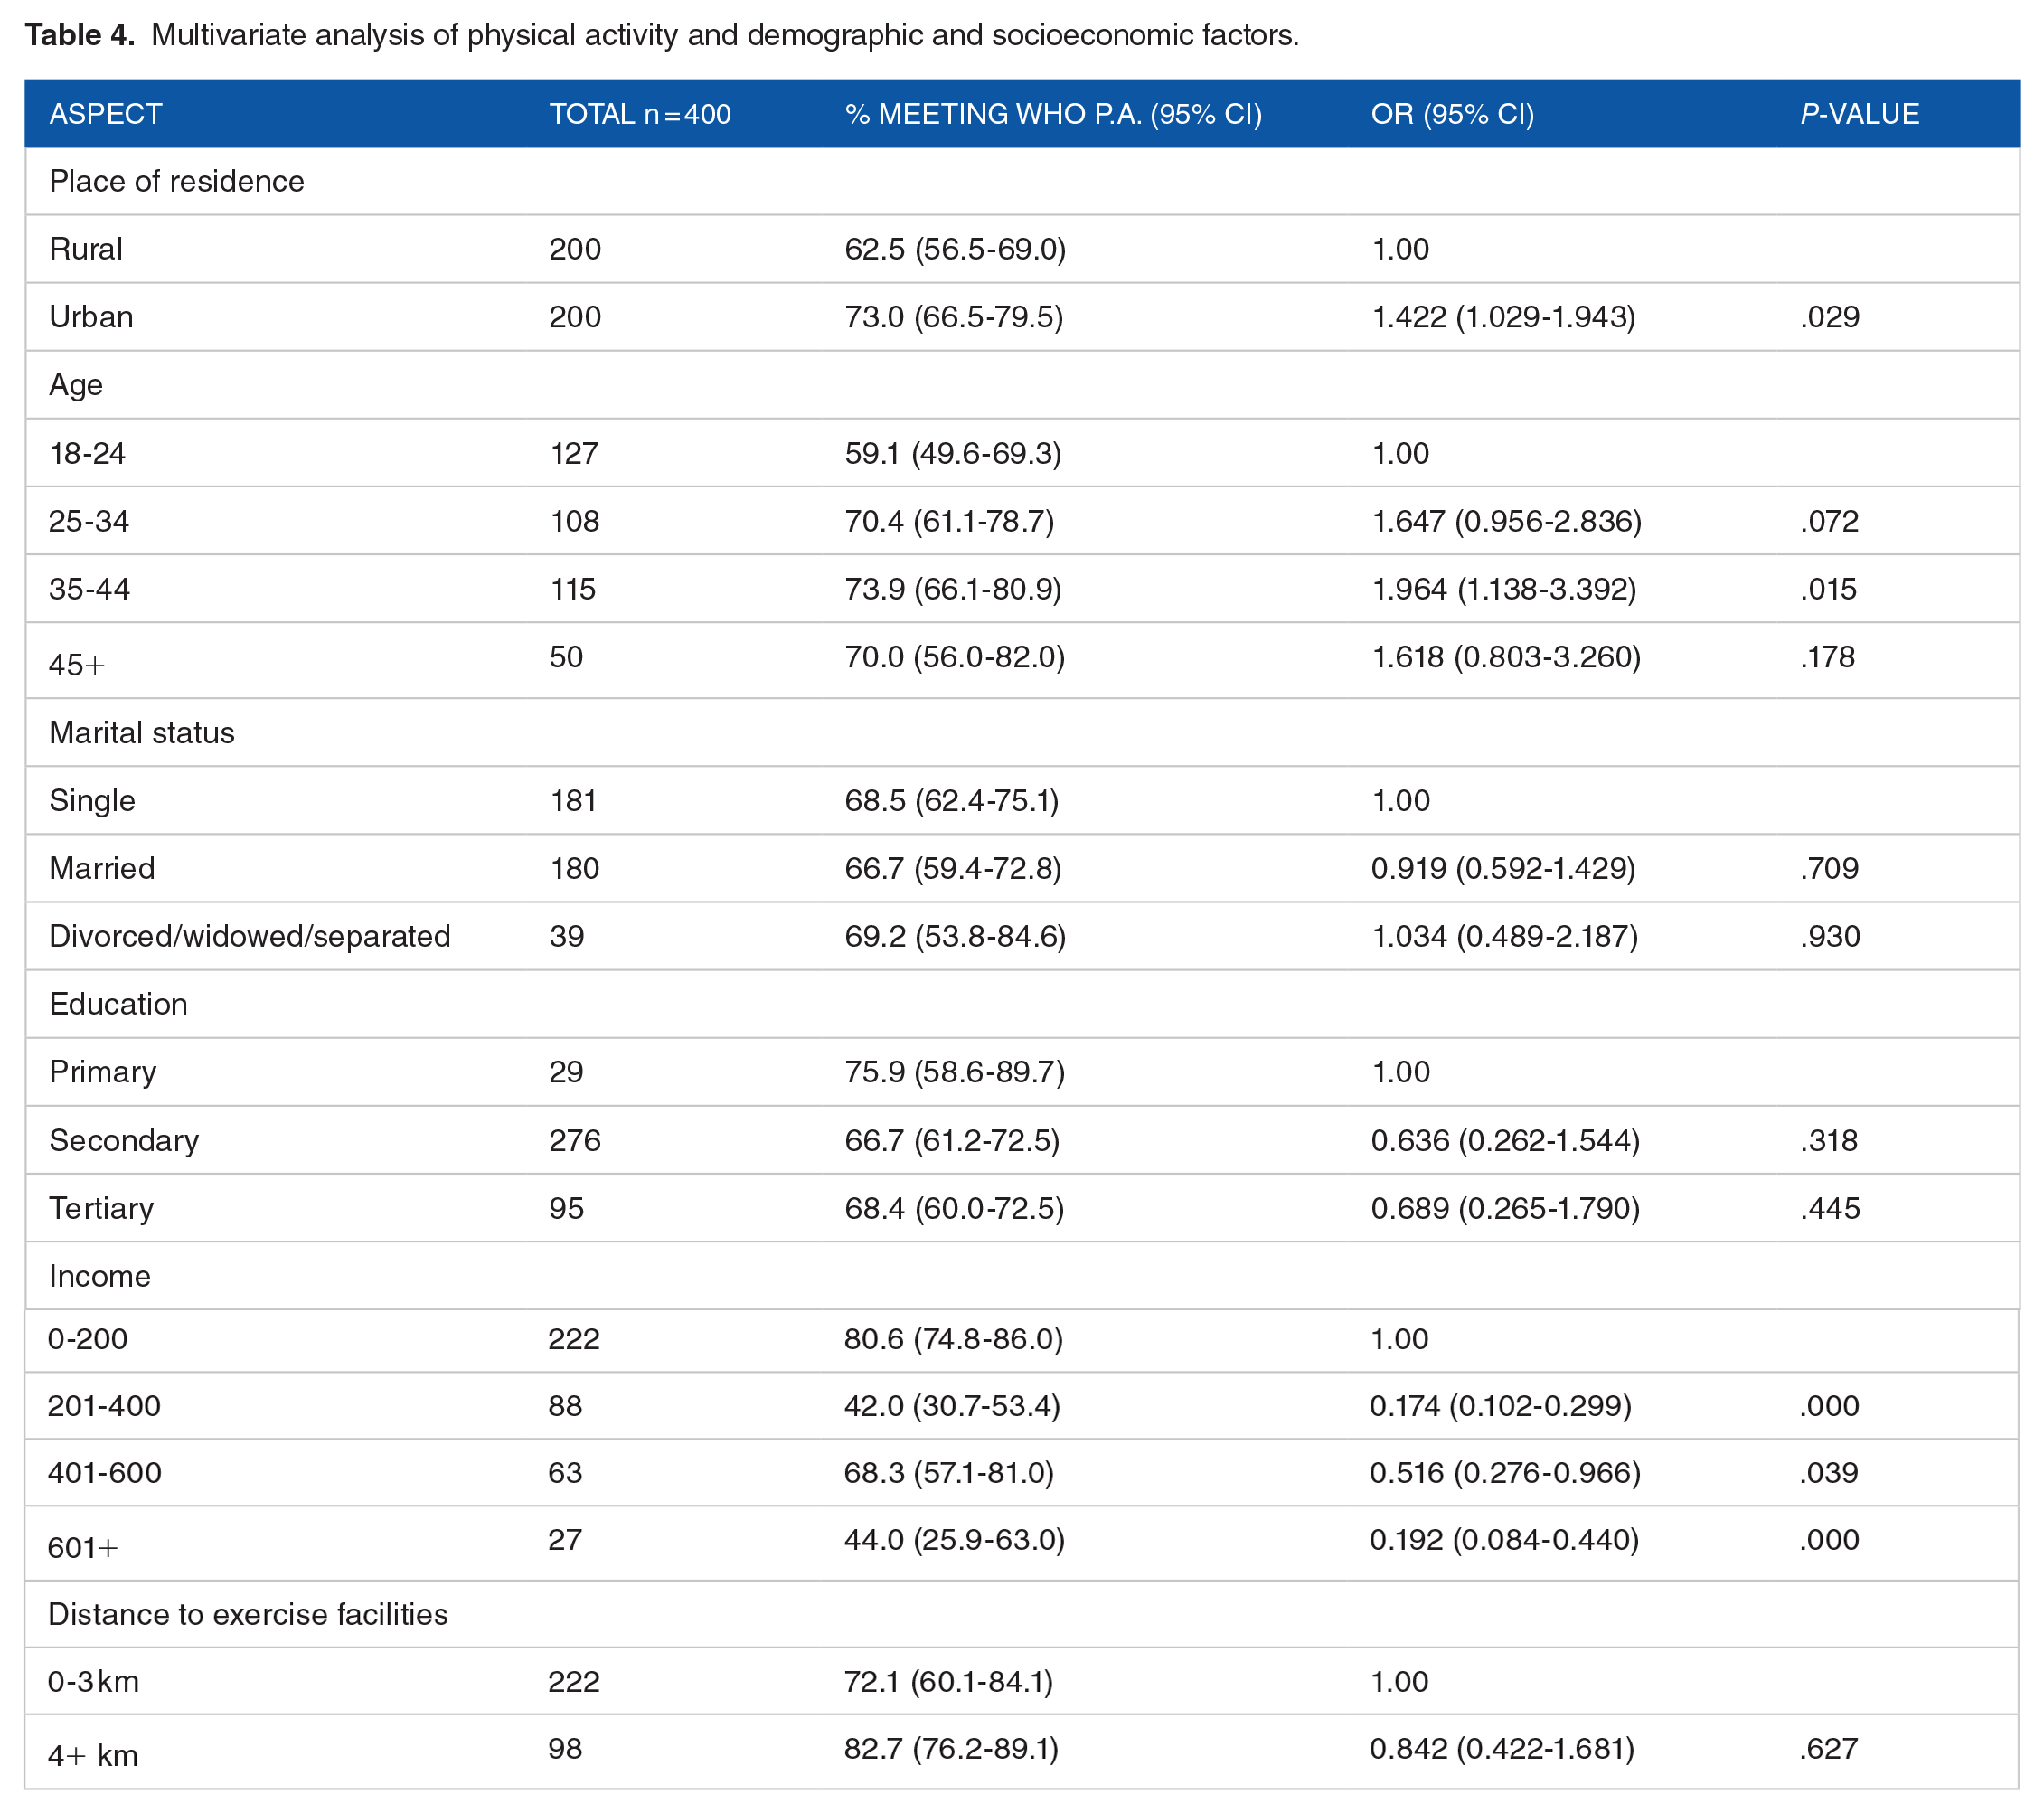
Respondents from the rural setting were 42.2% more likely to meet the WHO-recommended physical activity level than those from the urban setting. Respondents in the age group 35 to 44 years were 96% more likely to meet the recommended WHO physical activity level than the respondents in the age group 18 to 24 years. Those with an income higher than $200.00 were less likely to meet the WHO recommended physical activity level that is, those earning between $201.00 and $400.00 were 82.6% less likely to meet the required physical level than those earning below $201.00. Respondents earning between $401.00 and $600.00 were 48.4% less likely to meet the required physical level than those earning below $201.00. The group that is earning above $601.00 was 80.8% less likely to meet the required physical activity level when compared to the group earning less than $2001.00 as shown in Table 4. The model explained between 24.6% and 29.7% of the variation in the dependent variable (physical activity), Chi – 90.061, P. .000 < .05.
Multivariate analysis of physical activity and demographic and socioeconomic factors.
Multivariate analysis of physical activity and metabolic risk factors for NCDs
Table 5 shows that respondents with higher physical activity levels (3000 METS and above) had lower mean of fasting blood glucose (P, .034) than those with lower physical activity. Physical activity levels explained 2.3% of the variation in fasting blood glucose.
Multivariate analysis of physical activity and metabolic risk factors for NCDs.

Discussion
The study sought to compare physical activity levels between a rural and an urban setting. Rural respondents were 42.2% more likely to meet the WHO-recommended physical activity level. This indicates that rural areas have higher levels of physical activity. These findings are confirming evidence in literature where urban residents have lower levels of physical activity.5,13-20 The reasons given for lower physical activity levels in urban areas range from a reduction in distances travelled to fetch firewood and water, 17 changes in modes of transport, 13 shifts to technology with less human intensity labour, 21 and shifts from agricultural labour to service industries that require less labour. 22 All these are possible reasons for the differences observed in the current study. Farming activities in Mashonaland East Province could have contributed to the higher physical activity levels in rural areas in this study.
The current study revealed that 37.5% of urban areas and 27% of rural areas failed to meet the WHO recommended physical activity level, showing high levels of inactivity. These statistics are higher than the national statistics as recorded in the WHO (2022) report, which indicates that 1 in 5 (23%) men do not meet the required level of physical activity. 9 The reason may be that the statistics from the WHO report are based on estimates and may not reflect the true picture on the ground. The findings of the current study reflect the situation on the ground, as measurements were taken. However, the percentage of participants with inadequate physical activity in this survey was lower than that in the 2005 national NCD survey (38.1%). 23 The differences are due to differences in methodology, where the 2005 NCD survey did not include those aged below 25 years and also that there could be changes that took place since there is a long gap of nearly 20 years. The current findings for Bulawayo province (37.5%) are higher than for Matabeleland South province, even though the Ndebele people with the same culture predominantly occupy both areas. This shows the effects of urbanisation since Matabeleland South province is largely rural. The current findings confirm the statistics observed at the University of Zimbabwe for male students who had an inactivity rate of 32.7%. 24 There is generally low physical activity in Zimbabwe, and this pattern confirms the patterns observed in other Sub-Saharan African countries.25,26 This may be linked to climate change, which affects agriculture and leads to reduced levels of physical activity, even in rural areas. The observed patterns show that urbanisation leads to reduced physical activity, as suggested elsewhere.18-20,27
The current study also revealed that more people in rural areas walk and cycle more than those in urban areas (64% and 54.5%, respectively). People in urban areas have more access to different forms of transport, unlike rural residents, who usually walk from 1 place to another. This contributes to a higher number of people meeting WHO-recommended levels in rural areas. This result confirmed the findings in South Africa. 17
It should be noted, however, that a sizeable number (54%) of urban respondents walked and cycled to work in the current study because of economic hardships. Economic hardships within an urban setting may promote high physical activity levels, as people resort to cheaper means of transportation which comes mostly in the form of walking and cycling to work. Urbanisation has also resulted in a decline in physical activity levels due to improved water and power supplies. In the current study, rural respondents were more likely to be involved in fetching water and firewood, although this type of work has traditionally been undertaken by women. This adds to the physical activity levels in rural areas, as observed in other countries.17,23,28 The rural group was 54% more likely to report working in farming activities than the urban group, contributing to high physical activity levels. The current study revealed that there were more people in rural areas (24%) involved in vigorous work than in urban areas (22%). There is however, no significant differences between the 2 areas. This pattern may be due to changes in agricultural seasons, where during the period from May to October, not much is done in the agricultural fields. The current study was conducted during this off-season period, which may explain the low number of people involved in vigorous activities in rural areas. This may have been a limitation in determining physical activity levels in rural areas. Thus, the influence of seasonal changes on the calculation of physical activity levels cannot be underestimated. 29
In terms of facilities, the current study has shown that urban areas have more facilities that promote physical exercise and a lower mean distance travelled to these facilities, that is, 2.45 km and 3.6 km respectively. However, 26% of urban respondents did not use these facilities. This indicates that availability alone is not sufficient enough to promote high physical activity. However, 1 may not overlook cost attrition effects because these services come at a cost. 30 Zimbabwe faces economic challenges; hence, the use of these facilities may be at low levels. This differs from developed countries, where regions with facilities have higher physical activity scores.31,32
Those with higher educational attainment had lower physical activity levels than those with lower qualifications. Those with higher educational attainment were 36.4% less likely to meet WHO-recommended levels. This was because the educated in the current study are those with higher chances of being employed in towns, and more people with higher qualifications are found in towns and are thus influenced by urbanisation that promotes sedentary life. The initial changes brought about by urbanisation lead to sedentary lifestyles, and Zimbabwe is in the early stages of the transition. This pattern is different from those observed in China and Malaysia.16,33,34 It is understood that those with higher qualifications have better knowledge of the benefits of physical exercise. 35
The economically active age groups (25-44 years) had higher levels of physical activity than the younger age groups. The economically active age groups are those who work and may have higher physical activity scores than older people who have retired.16,36 It should be noted that walking and cycling to work in the current study contributed to high physical activity levels among the economically active.
Those who were physically active were less likely to have increased systolic blood pressure since those with physical activity scores of greater than 3000 Mets had the lowest values. However, the difference was not statistically significant. This confirms the findings of other studies.37-40 The study has also revealed that those with higher physical activity scores had slightly higher diastolic blood pressure. This is contrary to what has been discovered in literature. This maybe as a result of methodological weaknesses where this study only focussed on men and that the sample size was small. Furthermore, more than 69% of the participants had normal diastolic blood pressure affecting the validity of the relationship. The current study revealed an inverse relationship between physical activity and blood glucose level. The group that met the WHO-recommended physical activity levels was less likely to have elevated blood glucose levels. These findings have been confirmed in England and Malaysia.41,42 This is because physical exercise decreases insulin resistance, thereby reducing the risk of elevated blood glucose levels. 43 During periods of physical activity, skeletal muscles contract, thereby enhancing the uptake of glucose into muscle cells and reducing the risk of elevated blood glucose. 44 This study has also discovered that BMI slightly increased with Physical activity, a scenario which is contrary to general literature. It is not definite that the relationship between physical activity and body mass index is causal since there are many confounding factors affecting physical activity and health not covered by the current survey. Furthermore, 39% of the respondents in the current study did not consent to taking measurements on their weight. The study tried to cater for this weakness by increasing the sample size by 9%. The other factor that influenced interpretation of physical activity and BMI was that 72.5% of the respondents had normal weight. The pattern observed in this study was different from other studies in that the current study only focussed on men and yet men and women have different characteristics that may lead to different health outcomes. 45 Limitations of the study may include random-response bias where participants may just guess the time they took on their physical activities. The information collected in this study was based on memory and yet participants may suffer from memory lapse leading to collection of biased information.
Conclusion
The results showed that rural residents have higher physical activity levels than their urban counterparts. Respondents with low income were more physically active than those with high income. Participants with high physical activity levels were less likely to have elevated blood glucose levels.
Footnotes
Acknowledgements
We would want to thank the Ministry of Health and child care for allowing us to carry out this study and also the study participants.
Declaration of conflicting interests:
The author(s) declared no potential conflicts of interest with respect to the research, authorship, and/or publication of this article.
Funding:
The author(s) received no financial support for the research, authorship, and/or publication of this article.
Author Contributions
Norman Manyeruke: conceptualisation, research design, data collection supervision, analysis and interpretation of data, drafting the article, revising for publication. Kerry Vermaak: Conceptualisation, analysis and data interpretation, final approval, Wilfred Nunu: Research design, analysis and interpretation of data, revising for publication, Nicholas Mudonhi: analysis and interpretation of data, revising for publication.
Consent for Publication
Not Applicable
Ethical Statement
Ethical clearance certificate number FF505/16 was obtained from the biomedical research ethics committee (BREC) of a university in Southern Africa. Permission was sought from the Ministry of Health and Child Care (MMHCC) and all participants were given a consent form and those that agreed and signed participated in the study. As required by the Declaration of Helsinki, a letter was granted to seek consent and voluntary participation from all the respondents. The participants were free to decide whether to participate or decline and were reminded that their participation was voluntary. Anonymity and confidentiality of the participants were preserved by keeping their names and identities away from the research findings and reporting of the study. All Helsinki Declaration principles on studies involving human participants were observed and adhered to.
Availability of data and material
Not Applicable