
Abstract
Background:
The Affordable Care Act (ACA) aims to expand coverage and increase access to health insurance. Despite the increase of insured individuals, there are a number of concerns about whether coverage and care are affordable. Prior studies document a growing concern with rising premiums and cost-sharing, including deductibles, particularly for those with chronic conditions.
Objective:
Compare the ACA marketplace plan availability and costs across 17 states for individuals with varying diabetic engagement profiles and their related medical needs.
Design:
Descriptive Cost Analysis.
Methods:
Using Healthcare.gov individual state marketplace websites, we utilized a descriptive cost analysis to compare plan availability and costs for premiums, deductibles, co-payments, and co-insurance for an individual aged 63 years old, who was either a non-diabetic, high-engagement or low-engagement diabetic in urban and rural areas. Using the second lowest monthly premium silver plan (the benchmark plan), we calculated annual costs for premiums, co-insurance, co-payments, and deductibles for these individual profiles. We assessed statistical differences between health care component costs, within and across urban and rural areas, using t-tests.
Results:
The findings highlight within and across states, individuals with diabetes, particularly low-engagement diabetics, spend a significantly higher percent of their income on additional health care costs, above their premium, than non-diabetic individuals. In some states, low-engagement diabetic patients spend upwards of 3 times more than high-engagement diabetic patients, highlighting an additional cost burden. For low-engagement diabetics, deductibles are driving health care spending with an average of 59% of health care spending coming from deductible payments. Results do not show statistically different costs across urban and rural diabetic patients.
Conclusion:
Despite the ACA’s success, results highlight variation in plan availability across states and disproportionate cost burden placed on moderate income individuals, especially related to deductible, and co-payments for those with chronic diseases.
Introduction
In 2010, one of the largest health care reforms in American history, the Affordable Care Act (ACA) was signed into law, with the intention to expand coverage and increase access to health insurance. 1 Since the implementation of the ACA in 2014, an estimated 21.4 million Americans have been insured in Marketplace plans as of 2024 (Kaiser Family Foundation [KFF]). 2 Despite this increase in enrollment since the initial implementation, there are a number of concerns about whether coverage and care are affordable. There are numerous studies that document a growing concern with rising premiums and cost-sharing, including deductibles, even after the implementation of ACA, particularly for those with chronic conditions, who require more care.3-6
The concern with affordability and rising costs is well-documented across United State (US), showing varied implementation and uptake of the ACA. For example, a number of studies have examined how the ACA has been implemented with regard to the Medicaid expansion, with 40 states now having expanded (Fox et al 7 ; KFF 8 ; Laird et al 9 ). Furthermore, KFF examined how premiums have fluctuated across counties and states, noting a 5% increase in benchmark silver plan premiums from 2023 to 2024. 10 ACA marketplace plan availability and enrollment is also well documented, with notable variation in exchange plans benefits and enrollment fluctuations across states.2,11-13 Variation in implementation and access across states is important as it leads to inequalities in how individuals interact with the health system within each state.
Understanding marketplace expansion through the experience of individuals with diabetes provides a good lens to explore coverage and affordability, because these individuals could benefit from lower-cost, high quality care to manage their chronic condition(s). 14 Not only is the prevalence of diabetes high in the US but also incidence is increasing, 15 exacerbating the burden of diabetes especially for individuals from varying racial and ethnic minority groups, demonstrated by higher rates of type 2 diabetes in older adults, Asians, Blacks, and Hispanics, 16 as well as those with lower education, lower income and higher Body Mass Index (BMI).17,18 Rising health care costs presents a significant burden for individuals with diabetes in terms of costs, lost productivity, and adverse health outcomes. 19 Additionally, prior research has found that individuals with diabetes who are insured by high deductible plans are less likely to seek and adhere to treatment and prescription refills, and are more likely to have acute emergency visits. 20 While ACA implementation may have increased coverage and affordability of healthcare for individuals without diabetes, such studies have not compared this affordability for individuals with diabetes and other chronic conditions. 21 Individuals with diagnosed diabetes, on average, incur medical expenditures 2.3 to 2.6 times higher than they would be in the absence of diabetes.19,22 In 2022, the per capita medical expenditure for individuals with diagnosed diabetes was $19 736 annually, of which, 61% ($12 022) was attributed to diabetes-related services. 22 Having insurance is directly linked with management of diabetes, as studies have shown insurance fluctuations and costs lead to delayed and forgone care, which can result in adverse health impacts of diabetes and higher health care costs.23-25
Given the concern about rising costs, especially for individuals with a chronic condition like diabetes, this investigation seeks to gain a new understanding of the implications of the variation in ACA marketplace plan costs. Through the lens of an individual with diabetes this, we compare marketplace plan costs across states and determine estimated out of pocket (OOP) costs, including coinsurance and deductibles, based on different diabetes profiles for an individual with high and low-engagement in their diabetes care. Using individual state’s marketplace websites through Healthcare.gov, we compared marketplace plans, premiums, deductibles, and co-payment amounts for individuals aged 63, who had either high or low-engagement in their diabetic care 26 across 17 states. Our results highlight the variation in marketplace plan availability within and across states, especially for the growing number of diabetic patients in the US, who require reliable, affordable care to manage diabetes and likely other chronic conditions. This research is important to understand the setup of the ACA and how the OOP costs (ie, the cumulative value of deductibles, co-payments, and co-insurance) of marketplace plans can directly and indirectly affect health care seeking for patients with complex medical needs. Our study’s findings have implications for future health reforms and interventions designed to reduce costs of care, improve the value of insurance coverage and narrow disparities in health and health care access.
Methods
Using individual state marketplace websites through Healthcare.gov, we compared 2024 plan premiums, deductibles, co-payments, and co-insurance costs based on the profile for an individual age 63 and female with varying diabetic engagement. The inclusion criteria for states included in this analysis were states that had marketplaces open to the public and did not require address verification. These states include: CA, CO, CT, ID, KY, ME, MD, MA, MN, NV, NJ, NM, PA, RI, VT, VA, and WA. States that did not have an open marketplace were excluded.
Within state marketplaces, we used ZIP codes to select the most and least populous counties in each state to represent urban and rural areas, respectively. We then established an inclusion profile, consistent across all states: female, aged 63, with annual income of $30 120 (200% of Federal poverty level [FPL]). This analysis used a female profile as the ACA strictly prohibits the use of gender as a factor in determining healthcare costs. Additionally, females were selected for the profile individual as there was minimal difference in the number of plans offered and premium prices between men and women. Age 63 was chosen as these individuals were not yet Medicare eligible, and thus a particularly vulnerable age to shop on the exchange. Additionally, an income of 200% FPL was chosen to capture the highest income level that would qualify for the ACA premium subsidies, but was not low enough that the individual would be Medicaid-eligible. We recorded total plans offered for this profile (female, 63 years old, $30 120 income), as well as the number of bronze, silver (turquoise in the case of New Mexico’s state Marketplace), gold, and premium plans available, shown in Supplemental Table 1. To examine premiums and costs associated with different plans in a standardized manner, we selected the silver benchmark standard plan, or the silver plan with the second lowest monthly premium. Utilizing the similar silver plan for all calculations, we extracted the insurance plans details and calculated the deductible, OOP maximum, and co-payments for generic prescription drugs, primary care visits, specialist visits, and inpatient hospital stays for the 17 states include in the study, utilizing 1 urban and 1 rural ZIP code per state.
In order generate a baseline of expected annual health care costs, we examined the expected health care costs for an individual with varying diabetic profiles: non-diabetic profile, low-engagement diabetic, and high-engagement diabetic, keeping all other profile characteristics the same (female, age 63, $30 120 income). For the non-diabetic profile, health care utilization consisted of 1 routine health care visit and 1 specialist visit. Following guidelines outlined by the Centers for Disease Control and Prevention (CDC), high-engagement diabetics’ health care utilization needs were expected to include high-engagement 1 primary care and 3 endocrinologist visits for annual A1C testing, and monthly Metformin hydrochloride (MHCl) prescriptions high-engagement, a first line oral drug treatment for Type 2 Diabetes that works to reduce high glucose levels in the body.27,28 We created 2 types of low-engagement diabetic profiles. While terms such as non-compliant may be utilized in clinical settings, for the purpose of this analysis, low-engagement captures individuals who may face difficulties in managing their diabetes for both clinical and non-clinical such as health-related social needs factors. 26 For both profiles, we assumed these patients did not have well-managed diabetes and did not utilize the appropriate primary care and endocrinology appointments and did not take their MHCl as prescribed. For both profiles, we assumed medication non-adherence would lead to uncontrolled diabetes and 1 to 2 plausibly avoidable inpatient hospitalizations per year. 26 For 1 low-engagement profile, we assumed there would be 1 inpatient hospitalization per year; for the second low-engagement profile, we assumed there would be 2 hospitalizations per year. While these definitions may not reflect the broader impact of social determinants of health and health-related social needs diabetic patients may face, we used these definitions to maintain consistency for the study’s analyses.
For all diabetic profiles (non-diabetic, high-engagement and low-engagement), we then calculated the total OOP costs (ie, co-insurance, co-payments, and deductible payments) for each diabetic profile for any health care visit (inpatient or outpatient) and prescriptions. To estimate the out of pocket costs of an inpatient stay for a low-engagement diabetic in each state, we extracted data from the Health care Costs and Utilization Project (HCUP) cost category “diabetes with multiple chronic conditions” to capture the inpatient costs for a diabetic patient with multiple chronic conditions for the year 2021. We differenced the “Total Medicare Payment Amount” (the amount that Medicare pays to the provider for Medicare’s share of that specific Medicare Severity Diagnosis Related Groups) from the “Medicare Payment Amount” (the Total Medicare Payment Amount net beneficiary co-payments, deductible amounts and any additional payments from third parties for coordination of benefits) to arrive at the approximate amount individuals would pay in OOP payments above and beyond premiums. HCUP costs were inflated to 2024 US dollars using the U.S. Bureau of Labor Statistics Consumer Price Index (CPI) for hospital and related services. 29 We extracted co-insurance, co-payments, and deductible amounts for primary care visits, specialty visits and generic prescriptions from the plan details provided though Healthcare.gov. Using the benchmark plan (ie, the second lowest monthly silver plan) premiums, co-payment and co-insurance cost information, along with the HCUP costs for inpatient visits, we calculated annual premiums, co-insurance, co-payments, and deductibles amounts for the diabetic profiles in the study. Summarizing all costs resulted in an estimated total annual health care costs (sum of annual premium plus deductible, co-payment, and co-insurance costs for respective health care utilization) for each profiles patient for each state, which was then used to calculate the percentage of annual income spent on health care.
A final calculation examined what percent of annual health care costs were from the deductible portion of the patient costs; to examine the impact of rising deductible payments across all plans. 10 For plans in 6 states for low-engagement diabetics with higher deductibles as part of their silver plans, the deductible exceeded annual health care costs and as a result the percent of annual health care costs that were from the deductible portion of the patient costs, could be calculated. Results were calculated for all diabetic profiles, using plan information from 1 urban ZIP code and 1 rural ZIP code location. We utilized t-tests and to examine statistical differences in mean value of healthcare cost components across diabetic compliance profiles. P-values less than .001 and .01 were reported to capture significant differences in mean values between groups. The main results presented below are for urban individuals across diabetic profiles, and results for rural patients are presented in the annex. The annex results (Supplemental Tables 2–4) also utilized t-test and P-values to capture significant differences between urban and rural profiles.
Results
Table 1 shows the percent of income spent on health care for a non-diabetic, high-engagement diabetic, and low-engagement diabetic profiles in urban areas for 17 states. The results in Table 1 show that on average, across diabetic engagement profiles, individuals with diabetes spend a significantly greater percent of their annual income on healthcare (P < .001) than non-diabetics. Results show that average, low-engagement diabetics with 2 hospital visits spend 14.42% of their annual income on health care, while high-engagement diabetics spend on average 3.34% of their annual income, and non-diabetic individuals spend about 2.37%, on average. High-engagement diabetics spend as low as 2.11% of income on health care, whereas low-engagement diabetics can spend upwards of 22% of their annual income. Table 1 also shows the variation of income spent within states, for example, in Washington, a non-diabetic individual spends less than 1% of their income, whereas a low-engagement diabetic spends nearly 22% of their income on health care. Results for individuals in rural areas with varying diabetic profiles are shown in Supplemental Table 2, showing that the average percent of annual income spent on healthcare across diabetic profiles are similar across urban (2.37%, 3.34%, 10.00%, and 14.42%) and rural areas (2.56%, 3.45%, 10.35%, and 14.80%). Supplemental Table 2 also shows similar pattern as across diabetic engagement profiles, individuals with diabetes spend a significantly greater percent of their annual income on healthcare (P < .001).
Percent of annual income spent on health care across diabetic profiles in urban areas.

Standard Deviation is shown in percentage points. Significance level: *** P < .001, with non-diabetic as the reference group.
Table 2 decomposes the health care cost components, including monthly premiums, deductibles, and annual health care costs for the highest cost profile, low-engagement diabetics in urban areas with 2 hospital visits. The average monthly premium for a silver standard plan is $52, with an average deductible of $3284. The average annual health care costs, which capture the sum of annual premiums, deductibles, and co-insurance costs related to the 2 hospitalizations, are $4343, leading to an average health care spending of 15% of annual income. In some states, individuals pay as low as 5% of their income for health care costs, while some may spend upwards of 22%. Premiums vary between states surveyed from $10 to $91, with deductibles ranging from zero to $5700. Deductibles as a percent of annual health care costs on average represent about 59% of annual health care costs, range between 99% and 6%, and in most cases accounting for more than 50% of health care costs. Results of statistical tests show there are no significant differences between monthly premiums and deductibles across diabetic profiles within urban areas and within rural areas, compared to those without diabetes. However, results show that individuals with diabetes, across engagement levels, have a significantly greater total annual health care cost and a significantly greater total annual health care cost as a percent of income in both urban and in rural areas, compared to individuals who do not have diabetes. Results are shown in Supplemental Tables 3 and 4, for urban and rural areas, respectively.
Cost components and total annual health care costs (% of income) and deductible costs (% annual health care costs) for the low-engagement profile (2 hospitalizations) in urban areas, by state.
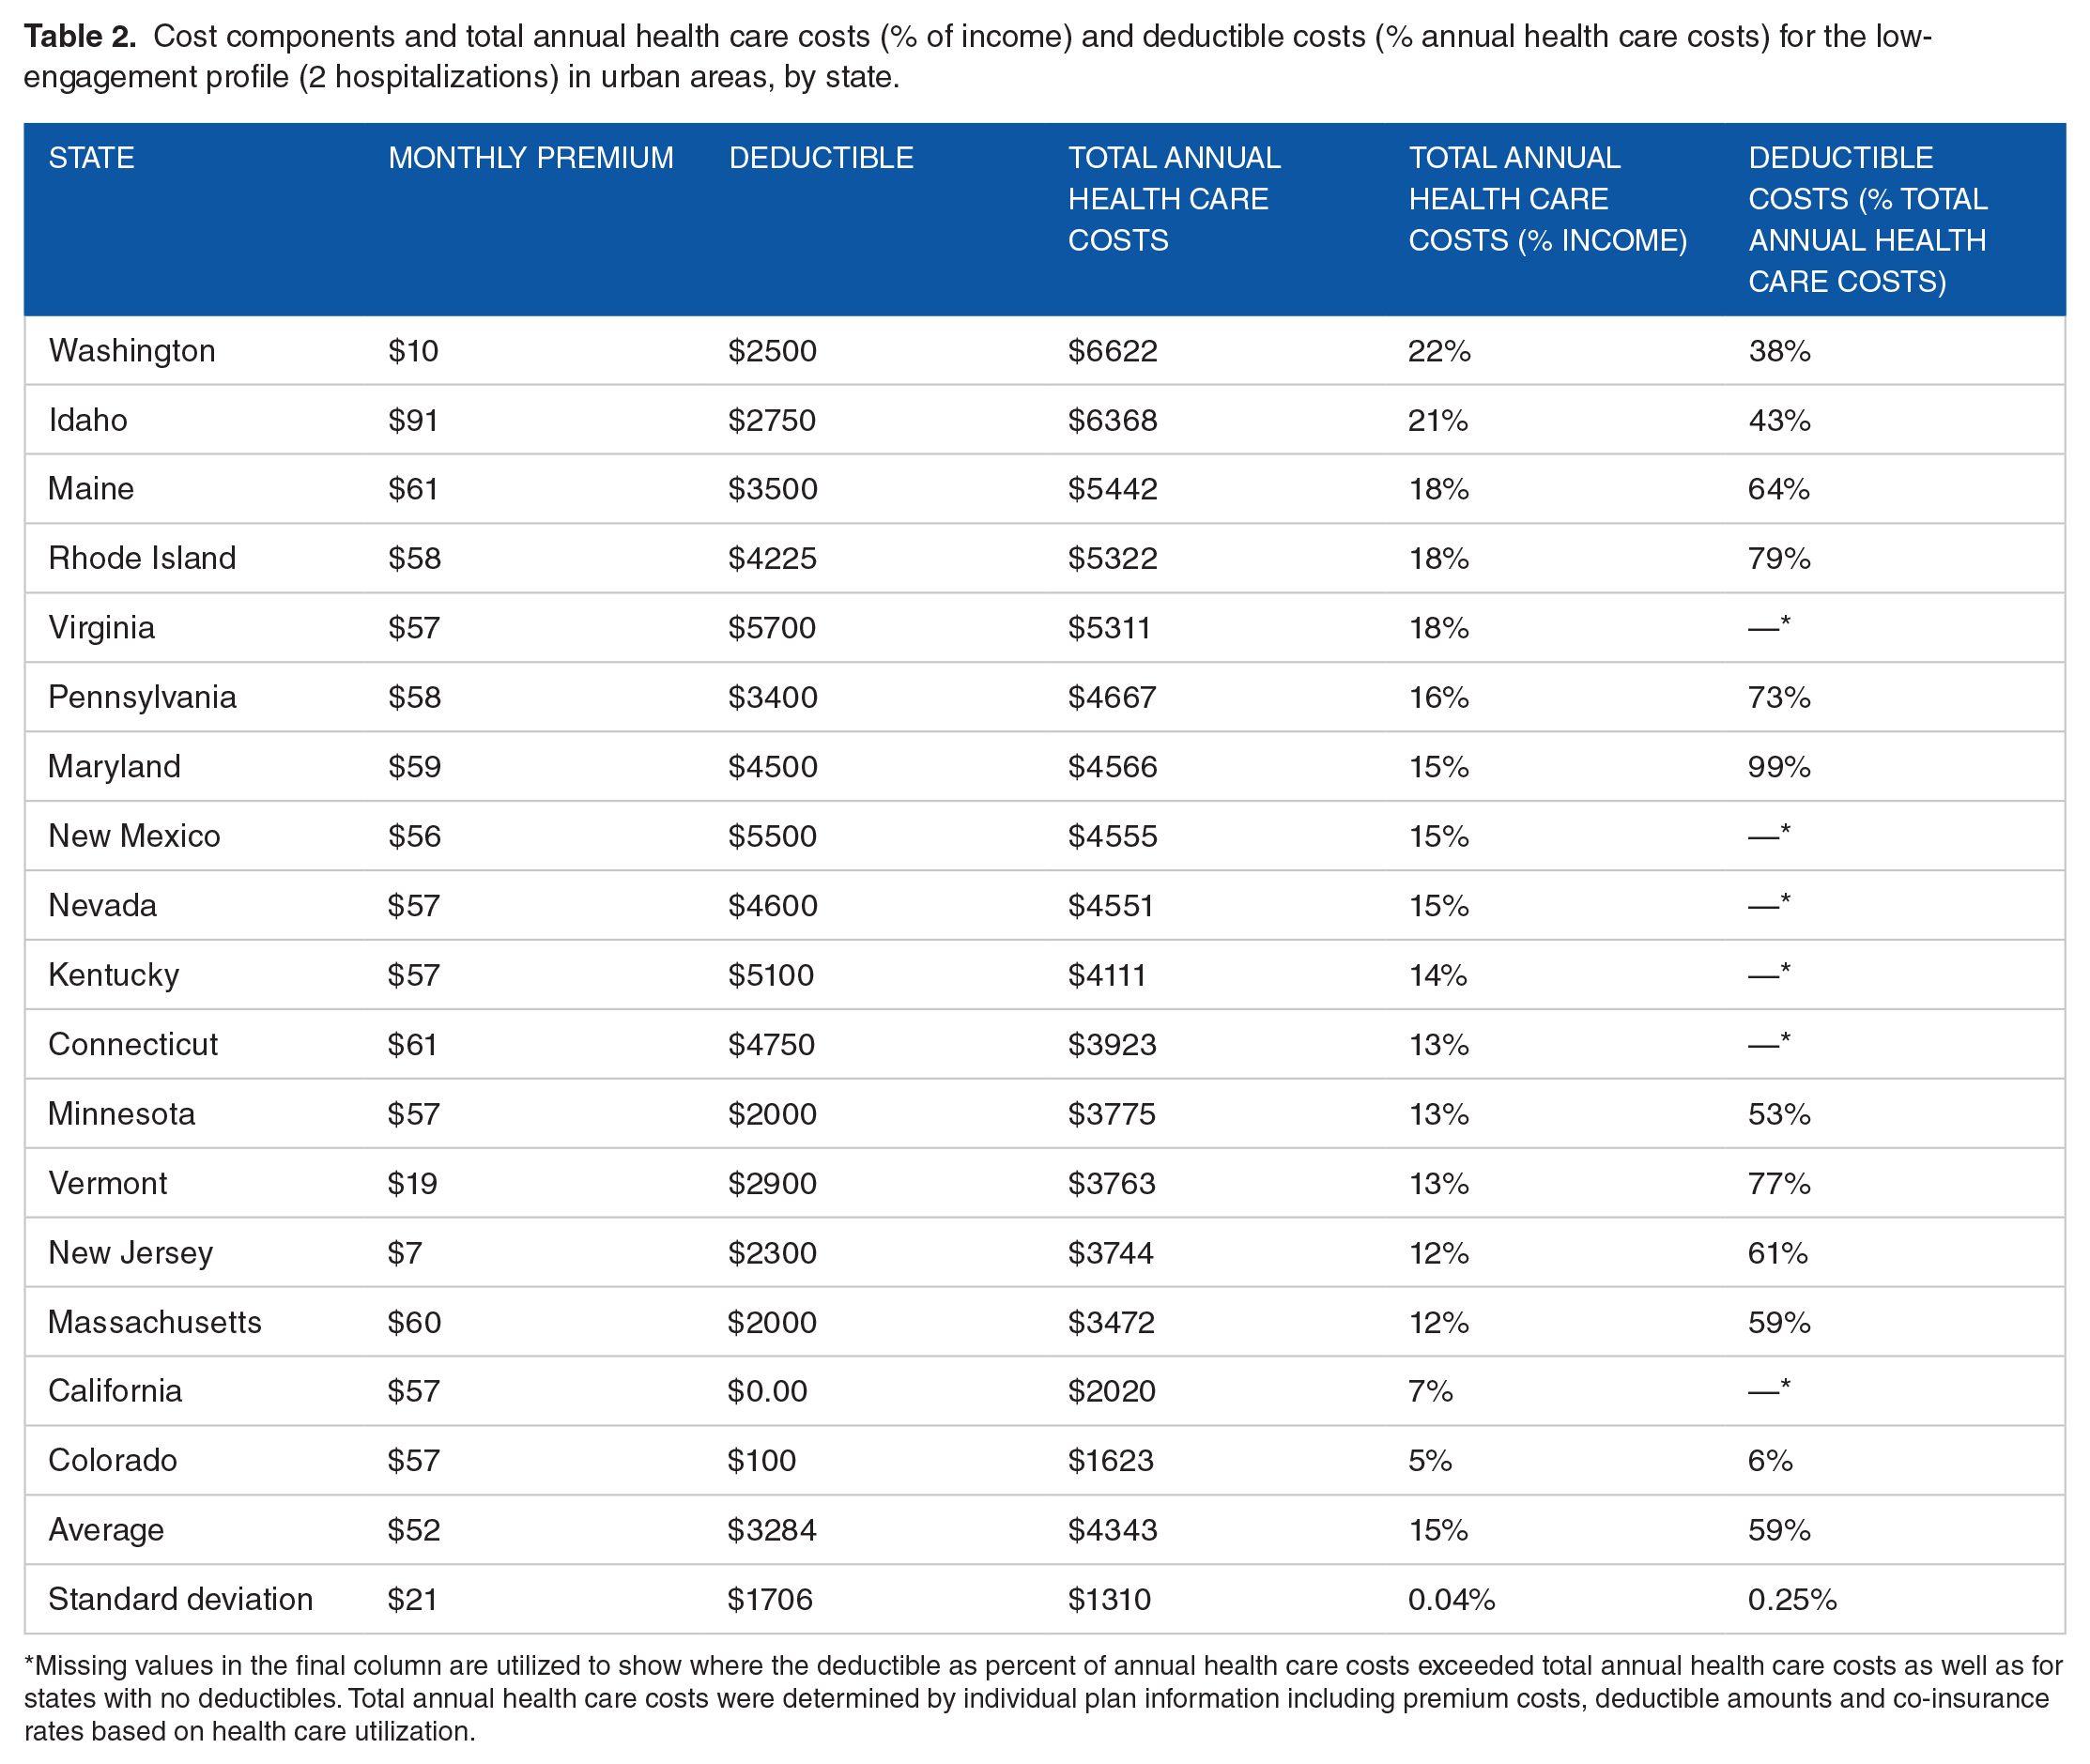
Missing values in the final column are utilized to show where the deductible as percent of annual health care costs exceeded total annual health care costs as well as for states with no deductibles. Total annual health care costs were determined by individual plan information including premium costs, deductible amounts and co-insurance rates based on health care utilization.
Figure 1 demonstrates the variation in percent of income that low-engagement diabetics spend on health care in urban areas for states surveyed. Low-engagement diabetics in some urban areas may spend over 21% of their income, whereas others spend less than 5%. In urban areas, non-diabetic individuals across all states included in the analysis pay less than 5% of their income on health care.

Percent of income spent on health care costs for low-engagement diabetics withonehospital visit compared to non-diabetic individuals in urban areas, by state. Figure shows the percent of income spent on health care costs for a low-engagement diabetic compared to a non-diabetic individuals in urban areas for states analyzed.
Discussion
The results of this analysis demonstrate that despite all the efforts and achievements of the ACA, for individuals with chronic conditions, like diabetes, market place plans can be expensive. The findings show that an individual with a low level of engagement in their diabetic care, even with a standard market place plan, is at risk of spending upwards of 22% of their income on health care costs, with an average of 59% of these costs being paid directly to their deductible. Diabetes in this analysis is used as a tracer indicator to capture the health care cost burden for individuals who may face complicated, chronic care, hence the results can be extrapolated to other individuals with other chronic conditions. Study results may provide insights to policymakers seeking to understand the impact of marketplace insurance plans for individuals with chronic conditions and could focus on the high deductible health plans which transfer much of the financial risk to the patient, especially for those with chronic conditions, which may then discourage these individuals from seeking needed care.20,24,30
While it is not surprising that those with a chronic condition, like diabetes, are paying a higher percent of their annual income on health care costs,31-33 it is interesting that these higher costs are for those with the silver benchmark plan and mainly paid toward their deductible. We chose the silver benchmark plan as the focus of our analysis in order to facilitate comparison across states and also because the silver benchmark plan is supposed to be 1 of the more generous plans in terms of coverage and cost-sharing. 34 For this reason, the results above are worrisome as even with this plan, the cost share for individuals with low-engagement in the health care system is quite high. The results showing that on average 60% of the direct costs are paid toward the plan deductible is in line with other recent literature highlighting the increasing burden on patients due to deductibles.4,35-37 These results are also in line with the increase in the number of high deductible health plans in the market. 38 The results should be considered as we continue to improve the marketplace options available through the marketplace to ensure lower health care costs for individuals with diabetes. For example, future policy proposals for the ACA marketplace could consider implementing modifications of cost-sharing to reduce the burden of high-deductibles for patients, which may help improve diabetes engagement and outcomes. 20
The results showing that a high percent of health care costs for those with marketplace plans are from co-insurance, co-payments and deductibles emphasizes that despite benchmarked premiums, higher costs are driven by health care utilization, such as hospital visits, and other non-benchmarked components of health insurance plans. These costs place a disproportionate burden on patients with complex medical needs, such as those with diabetes, and may cause further lack of medical adherence. 32 The individual profile created for this analysis did not have a racial profile as data were extracted from Healthcare.gov, which does not consider factors such as an individuals’ race and ethnicity or broader social determinants of health. However, prior literature has documented that these minority groups often face not only disparities in diabetes rates and complications,18,39 but also additional cost and access barriers, suggesting that healthcare costs would likely be higher and driving low diabetes engagement for these individuals. 40 These findings, combined with prior literature, emphasize the need to tailor future health care plans with these populations in mind, as both chronic illness prevalence and health care costs continue to rise, and in particular, the burden from deductibles.
The results presented in the main text focus on costs for those in urban areas, however the results for those in rural areas (presented in the Annex) show similarly high costs for low-engagement diabetics. As rural patients, across diabetic engagement profiles pay a slightly greater percent of their annual income on healthcare, the results suggest that the state and county where an individual lives may have an impact on the quantity of insurance plans available to prospective enrollees and the costs associated with the available plan. While previous work has noted the variation in costs of the marketplace plans, 41 to the author’s knowledge, there is less research examining this variation in rural areas, or within states. Some variation may be a result of state run marketplaces, which have more insurance issuers, more plans available, and are more likely to have expanded Medicaid, than those using the federal marketplace. 42 States with fewer issuers tend to be rural, have small populations, and lower physician to population ratio. 42 Additionally, under the American Rescue Plan (ARP) premium tax credit enhancements and extensions have expanded access to both zero- and low-premium health plans in rural counties, which suggests that ARP efforts have been successful in ensuring cost protections for individuals in rural areas, and more specifically, rural diabetics. 43 However, further research is needed to fully understand the impact of this variation between rural and urban areas as prior research suggests differences may be experienced not only in cost of care but also overall access to health care and quality of services received. 44
While this analysis only examined 1 year of insurance plan data, research shows that marketplace plans prices vary from year to year, often increasing the cost to maintain health insurance, suggesting that plans may become unaffordable, even with subsidies.41,45 Additionally, outside of cost barriers, prior research has shown that individuals also struggled to enroll in marketplace plans, faced gaps in coverage, and additional barriers due to limited knowledge of health insurance and the ACA program rules. 46 This poses a particular challenge for individuals with chronic conditions, as these individuals must ascertain which plans best suit their needs, established medical history, and care team.41,47-49 Rural patients may face additional challenges due to lower access to healthcare services and availability of providers. Given the barriers and high and increasing costs for individuals with diabetes in particular, navigation aids and plan recommendation technology may be beneficial to aid consumers in decision making and overcoming health insurance comprehension gaps. 47 However, the results of this analysis suggest that further policy intervention, such as bench marking additional aspects of ACA marketplace plan, is required to mitigate the disproportionate cost burden experienced by individuals with chronic illnesses.
There are several limitations to this study. First, we defined low-engagement diabetics without consideration of broader socioeconomic factors and health related social needs that may impact these patient’s ability to access insurance or health care. The individual profile created and tested (female, age 63, with $30 120 annual income) does not capture all individuals who would be utilizing ACA marketplace plans, however, this profile does capture a uniquely vulnerable population that represents a growing share of the U.S. population. 50 Future studies may aim to utilize additional individual profiles and broader income categories. Next, at the time of data collection, we were limited to reviewing states that had open marketplace portals as some states previously imposed account requirements, and address verification to view their portals. However, as of July 2024, Healthcare.gov has created a new webpage that does not require address verification with all 50 states viewable. This will allow for future related research questions that incorporate data from all 50 states. It is also critical to investigate how enrollment in marketplace plans has changed given the removal of address verification. Additionally, this analysis is limited to 1 year of data on marketplace plans as viewing and extracting data on historical marketplace plans was not possible through Healthcare.gov. However, examining premiums and affordability over time is a key area for future research if historical data become available. It is important to note that the estimated costs do not reflect actual health care utilization, which may lead to over or under estimation. The authors utilized the referenced literature and input from clinical experts to create estimated annual health care utilization. Due to the use of HCUP data, we were limited to using Medicare payments, rather than commercial payments, which suggests that our results may be over estimates or under estimates as commercial payments would likely be higher. Further studies should analyze more granular utilization and individual level data to understand additional variation in costs, utilization of services and the role of social determinants of health.
Conclusions
Even with the success of the ACA, our results highlight the disproportionate cost burden placed on individuals enrolled in a marketplace plan, especially those with chronic diseases. We also highlight the important contribution of costs due to high deductibles. These findings are critical for understanding how to improve the ACA in the future to continue to increase health insurance enrollment especially for those individuals with chronic illnesses.
Supplemental Material
sj-docx-1-his-10.1177_11786329241304618 – Supplemental material for Out-of-Pocket Costs Burden in Marketplace Plans for People With Diabetes
Supplemental material, sj-docx-1-his-10.1177_11786329241304618 for Out-of-Pocket Costs Burden in Marketplace Plans for People With Diabetes by Brielle Ruscitti, Caroline Kern and Diana Bowser in Health Services Insights
Footnotes
Acknowledgements
The authors would like to thank Nancy Turnbull and Joseph Benitez for providing guidance and input in the manuscript drafting process.
Funding:
The author(s) received no financial support for the research, authorship, and/or publication of this article.
Declaration of conflicting interests:
The author(s) declared no potential conflicts of interest with respect to the research, authorship, and/or publication of this article.
Author Contributions
BR: Conceptualization; Data analysis and interpretation; Writing—drafting& revisions.
CK: Conceptualization; Data analysis and interpretation; Writing— revisions.
DB: Conceptualization; Data acquisition and interpretation; Writing— revisions.
All authors reviewed the manuscript.
Supplemental Material
Supplemental material for this article is available online.
References
Supplementary Material
Please find the following supplemental material available below.
For Open Access articles published under a Creative Commons License, all supplemental material carries the same license as the article it is associated with.
For non-Open Access articles published, all supplemental material carries a non-exclusive license, and permission requests for re-use of supplemental material or any part of supplemental material shall be sent directly to the copyright owner as specified in the copyright notice associated with the article.