
Abstract
Background:
Ambulatory blood pressure monitoring (ABPM) is considered the gold standard for proper diagnosis of hypertension. Yet, access to ABPM in the U.S. is limited, and the extent of coverage by commercial health plans remains uncertain, potentially limiting access to ABPM among commercially insured patients.
Objective:
This study aims to assess the net cost impact of using ABPM in comparison to clinical blood pressure monitoring (CBPM) in the U.S. over a 5-year time period.
Design methods:
Using a Markov Model, we estimate the 5-year cumulative cost impact of using ABPM to confirm a prior diagnosis of primary hypertension using CBPM to avoid treatment for white-coat hypertension (WCH) in a hypothetical cohort of 1000 patients from a U.S. healthcare system perspective. The probability and cost inputs for the model were derived from available literature. Base-case model parameters were varied to account for different scenarios.
Results:
Base-case results indicate using ABPM instead of CBPM over 5 years saves a total of $348,028, reflecting an average per-person-per-year (PPPY) cost saving of $70. In sensitivity analyses, almost all cases reveal ABPM as a cost-saving approach compared to CBPM, with cost savings reaching up to $228 PPPY in the highest hypertension treatment cost model. Regression results reveal that ABPM was cost-saving compared to CBPM if ABPM annual payment rates are $100 or less and annual hypertension treatment costs are ⩾$300.
Conclusion:
The potential cost-savings of using ABPM instead of CBPM found in our simulation model underscores the need for confirmatory research using real-world data to support increased use of ABPM as the standard diagnostic approach for hypertension.
Keywords
Introduction
Hypertension is a major risk factor for diseases such as stroke, heart attack, heart failure, and kidney damage, affecting 1 in 3 adults worldwide. 1 This chronic disease has contributed to nearly 500 000 deaths in the U.S. with an estimated economic burden ranging from $131 to $198 billion annually. 2
Accurate blood pressure (BP) measurement is essential for effective hypertension diagnosis and subsequent management. A false BP reading that is below the recommended thresholds for treatment, also known as masked hypertension, may give a false sense of security about one’s health and potentially delay necessary interventions. Conversely, a false high BP reading when actual BP is within the normal range, also known as white-coat hypertension (WCH), could lead to potentially unnecessary treatment, imposing burdens on both patients and healthcare resources.3,4 Recent guidelines have questioned the accuracy of in-office BP measurements for diagnosing hypertension 5 and strongly recommend the adoption of out-of-office techniques, for their proven cost-effectiveness.6-9 However, home blood pressure monitoring (HBPM), 5 an out-of-office approach, lacks sufficient sensitivity or specificity to be recommended as a single diagnostic approach. Treatment decisions based on clinical or home measurements alone may result in overdiagnosis compared to ambulatory blood pressure monitoring (ABPM). 10 ABPM, which utilizes a portable device to automatically measure a patient’s BP at regular intervals, such as every 20 to 30 minutes throughout the day and night, 7 is considered the gold standard for accurate diagnosis of hypertension.8,11,12
In June 2019, the Centers for Medicare and Medicaid Services (CMS) determined that there was sufficient evidence to cover ABPM for Medicare patients with suspected WCH or masked hypertension. 13 Although ABPM utilization subsequently increased dramatically, the extent to which commercial plans in the U.S. cover ABPM is unclear, 14 which might limit access to ABPM among commercially insured patients. Patient preferences should also be taken into consideration when adopting BP measurement techniques, 9 especially knowing that ABPM has been associated with patient discomfort and inconvenience. 15
In this study, we investigate the net cost impact associated with the use of ABPM rather than CBPM over a 5-year period, in terms of properly identifying patients with WCH, thereby avoiding costs of potentially unnecessary hypertension treatment, which will at least partially offset the costs of using ABPM. Our investigation aims to shed light on the economic implications of this diagnostic approach, recognizing that a cost-impact analysis is an important tool for policy makers to assess the affordability of new healthcare technologies. 16 Results from this cost-impact model, along with findings from previously published literature on the cost-effectiveness of ABPM, may not provide sufficient evidence to direct informed resource allocation. 16 However, our results may encourage additional research to inform healthcare payers considering expanding ABPM use within their health systems to reduce their per-person-per-year (PPPY) costs.
Methods
Model structure and probability inputs
Using a Markov decision tree model, we estimated the cost impact of the use of ABPM (intervention group) compared to CBPM (comparison group) for a hypothetical cohort of 1000 patients over a 5-year time horizon with a 1-year transition cycle. The cohort consists of individuals with suspected primary or essential hypertension at baseline, defined as an average clinical BP ⩾ 140/90 mm Hg, with no prior hypertension diagnosis. 12
The structure of the Markov model for the intervention and the comparison are shown in Figures 1 and 2 respectively. All patients in the ABPM intervention group are assumed to have been classified as hypertensive based on CBPM, and then all patients use ABPM to verify the diagnosis. Based on the ABPM results, at baseline they are categorized as either WCH patients or truly hypertensive patients. WCH patients are characterized by high BP readings using CBPM but BP readings below the hypertensive thresholds using ABPM. The model assumes all truly hypertensive patients initiate antihypertensive treatment whereas WCH patients do not. In the CBPM arm, the model assumes all patients were classified as hypertensive at baseline based on CBPM and subsequently initiated antihypertensive treatment.

Markov model structure for the intervention group.

Markov model structure for the comparison group.
Hypertensive treatment for patients with WCH is likely to have some clinical benefit over time, as patients with WCH are at higher risk for cardiovascular (CVD) events compared with normotensive patients (individuals with normal in-office BP and out-of-office BP who are not on antihypertensive treatment).17,18 However, the reduction in the absolute risk of CVD events associated with treating WCH patients over the 5-year horizon in the cost-impact simulation is likely to be small. The base-case model scenario excludes any potential CVD costs avoided by treating WCH within the AMPM cohort, but the potential impact of untreated WCH on CVD event rates and their associated treatment costs on model estimates of net cost for ABPM is assessed in sensitivity analyses. More generally, the model does not attempt to quantify the health benefits associated with treating WCH patients in terms of CVD events avoided, as these are elements of cost-effectiveness analysis in the CBPM group. Further, because the model focuses on the use of ABPM to confirm a preliminary high BP diagnosis based on CBPM, it does not attempt to quantify the costs or health benefits associated with using ABPM to identify and treat masked hypertensive patients.
In our base-case analysis, we assumed the probability of having WCH for patients with elevated clinical BP as 20%. We then adjusted the probability of WCH in our sensitivity analysis to vary from 5% to 45%.17,19-21 In the ABPM arm of the model, untreated patients with WCH in each year may transition to ABPM-confirmed hypertension in the next year and initiate hypertensive treatment. In our base-case analysis, we assumed a 5% annual probability of transition from the WCH group to the truly hypertensive group, referred to as the new hypertension incidence rate. 19 This incidence rate assumption is also varied in the sensitivity analysis from 5% to 45%.19,20 In subsequent years, we assumed that only patients identified as WCH in the prior year will undergo ABPM at the start of each year, while those identified as truly hypertensive patients will continue to receive hypertension treatment. 18
All patients in the CBPM comparison arm of the model are assumed to receive hypertension treatment throughout the 5-year model period. The annual rate of hypertension therapy discontinuation is estimated to be 5% for both groups. Although patients discontinuing treatment face an increased risk of CVD events due to untreated BP, if quit rates and subsequent CVD risks are equivalent for both groups, the costs of CVD events occurring due to discontinuation should be similar across groups, with a minimal impact on net cost impact.
Cost inputs
The base-case cost-impact analysis is conducted from the perspective of the U.S. healthcare system. Base-case model inputs are reported in Table 1. The cost of ABPM is based on total Medicare payment amounts for 2023 from the CMS. Medicare covers ABPM (CPT code 93784) once per year with payment rates that vary across different localities in the U.S., ranging from $40.8 to $60.1, with a standard deviation of $4.5. 22 For our base-case scenario, we used the average cost of all localities which is $47 (95% CI, $46.9 to $48.6).
Model inputs.

Abbreviations: ABPM, ambulatory blood pressure monitoring; WCH, white-coat hypertension.
In the base-case model, the annual cost of treating hypertension includes both the costs of antihypertensive medication over 12 months as well as the cost of one office visit attributable to hypertension therapy management per year. In sensitivity analyses, the frequency of office visits over 12 months attributable to hypertension management is varied, and the costs of potential diagnostic testing associated with hypertension management are added to the estimated cost of hypertension therapy.
Hypertension medication costs were based on a study utilizing data from the Medical Expenditure Panel Survey (MEPS) to assess the average annual expenses for antihypertensive medications among hypertensive adults in the U.S. across all payers (private or public insurance and patient out-of-pocket payments), representing various patient demographics and characteristics. Baseline antihypertensive drug treatment costs derived from estimates reported in the MEPS analysis are adjusted to 2023 U.S. dollars using the consumer price index (CPI) inflation calculator. 23 In general, the study findings indicated that 43% of individuals taking medication for hypertension used a single antihypertensive medication, incurring an estimated annual cost of $255 per person. The remaining patients (57%) used multiple antihypertensive medications, resulting in an estimated annual cost of $558 per person 24 (Table 1).
Hypertension-related outpatient visit costs are based on 2023 CMS payment rates for an established patient office or other outpatient visit lasting 20 to 29 minutes (CPT code 99213).6,22 Payment rates for various localities range from $82.7 to $115.8, with a standard deviation of $6.9. 22 The average for all localities used as an input in our model is $93 (95% CI, $82.7-$115.8).
Analysis
In our base-case scenario, we calculated and compared the 5-year cumulative costs for both the CBPM comparison group and the ABPM intervention group, employing base-case probabilities, and cost input assumptions (Table 1). The net cost impact of implementing ABPM versus the comparison group (all CBPM) is calculated as the difference in cumulative 5-year costs between the intervention and comparison groups. A sensitivity analysis was conducted by varying the probabilities of WCH and new hypertension incidence within a range of 5% to 45%, examining how changes in these individual probabilities affect the overall net cost impact. Average PPPY costs are calculated by dividing the 5-year net cost impact by the 5 (the number of model-years) and by the total number of patients (1000).
Given that our assumptions regarding ABPM costs and office visit costs are specifically based on CMS payment rates for Medicare patients, we conducted a multivariable linear regression model with the net cost impact as the dependent variable, the cost of utilizing ABPM, and total cost of hypertension treatment (medication and office visits) as the independent variables. The resulting regression model may be used to project the net cost impact of ABPM from a private payer or patient perspective by using cost variable estimates based on private insurance payment rates or patient out-of-pocket costs.
Moreover, based on results reported in the same study utilizing MEPS data, we calculated the PPPY cost impact stratified by patient demographics and characteristics. This calculation involves baseline probabilities for WCH, new hypertension incidence, costs for ABPM coverages, and hypertension office visits. 24 To introduce variability, we adjusted the cost of annual antihypertensive medications by incorporating factors such as regional differences, race, and comorbidity levels. For instance, the highest annual hypertension medication costs can be observed for people in the northeast region $415 (95% CI, $372-$457), black non-Hispanics with $416 (95% CI, $364-$467), and patients with a high level of comorbidity, indicating a CCI Score ⩾ 3, with an annual cost of $393 (95% CI, $339-$447). 24
Finally, as part of our sensitivity analyses, we assessed the net cost impact of using ABPM instead of CBPM assuming higher hypertension therapy management costs related to the costs of potential diagnostic tests and more frequent hypertension-related office visits annually among all treated hypertensive patients in our model. Treatment guidelines recommend several diagnostic tests for patients receiving hypertension treatment to assess any CVD risk and to rule out specific clinical diagnoses as possible causes for hypertension (ie, secondary hypertension). The specific tests included in the sensitivity analyses are fasting blood glucose, complete blood count, lipid profile, serum creatinine with estimated glomerular filtration rate (eGFR), serum sodium, potassium, calcium, thyroid-stimulating hormone, urinalysis, and electrocardiogram (EKG). 5
Medicare payment rates for 2023 were used to estimate costs for the recommended tests (Table S3 in Supplemental Material), which were added to the cost of drug therapy and hypertension-related office visits used in the base-case model, assuming recommended testing occurs during every year of hypertension therapy. We also consider scenarios that add the costs of up to 4 hypertension-related office visits during each year of therapy. However, given the possibility that physicians may not adhere to treatment recommendations in usual practice, the sensitivity analysis also considers a scenario where diagnostic testing only occurs in the year hypertension therapy was initiated (ie, the first year of a diagnosis of primary hypertension confirmed by ABPM in the ABPM group, and at baseline for all patients in the CBPM group).
Results
With initial WCH prevalence and new hypertension incidence set at 20% and 5%, respectively, among a hypothetical cohort of 1000 patients, we observe the number of WCH patients decrease from 200 during Year 1 to 131 in Year 5, as displayed in Table 2, indicating the cumulative effect of yearly transition from the WCH group to the truly hypertensive group as well as the treatment discontinuation rate (antihypertensive drugs and in-office therapy management visits) across the intervention group. In the comparison group, we observe the number of treated hypertensive patients decrease from 1000 during Year 1 to 815 due to the assumed equal rate of hypertension treatment discontinuation. The highest total annual expenditure for the intervention cohort is $463 568 in the first year (Year 1). This accounts for the use of ABPM for all 1000 patients and hypertension treatment for 800 patients. However, total expenditures for treating all 1000 patients for hypertension in the comparison group in Year 1 amounts to $520 710, resulting in a net cost saving for utilizing the intervention instead of the comparison of $57 142 for Year 1. Annual total expenditures in the ABPM intervention group decrease by $54 161 from Year 1 to Year 2 then gradually decrease by an annual average of $15 362 in subsequent years (Years 2-5). The gradual decrease in subsequent years results from ABPM being utilized only for the WCH patients identified during the prior year to ascertain their current hypertension status. Over the 5-year time horizon, the total years of treatment was 3710 in the intervention group, compared to 4525 in the comparison group. Thus, the intervention avoids a total of 815 years of treatment over 5 years per 1000 patients in the ABPM cohort. The associated reduction in total hypertension treatment costs offset the added cost of ABPM in the intervention group, resulting in total cost savings of $348 028 for the 1000 patient cohort over 5 years using ABPM versus CBPM, for an average PPPY cost saving of $70 (Table 2).
Cost savings of ABPM strategy (base-case model).

Abbreviations: H, treated hypertensive; PPPY, per person per year; TH, truly hypertensive; WCH, white-coat hypertension.
The sensitivity analysis from our study underscores the dynamic interplay between WCH probabilities and new hypertension incidence rates on the cumulative net cost savings from implementing ABPM. The two-way sensitivity analysis (Table 3) portrays a direct, proportional relationship between an increased WCH prevalence rate and elevated cost-savings, juxtaposed against an inverse relationship where higher new hypertension incidence rates correlate with diminished savings. Under the best-case scenario of a 45% WCH probability coupled with a 5% new hypertension incidence rate, the estimated cost savings is $168 PPPY, representing 1832 potentially unnecessary years of treatment. In contrast, under a worst-case scenario of a 5% WCH probability and a 45% new hypertension incidence rate, the estimated net cost impact is -$7 PPPY (net cost increase), representing 23 years of treatment avoided (Table S1 in Supplemental Materials). Across the scenarios examined in this two-way sensitivity analysis, the median cost-saving was $34 corresponding to a 20% WCH probability and a 25% new hypertension incidence rate, as shown in Table 3.
Per-person-per-year cost impact by varying baseline probability inputs.

Abbreviations: NHI, new hypertension incidence; WCH, white-coat hypertension probability.
The financial impact of ABPM and subsequent hypertension treatment cost is subject to variation, influenced by differing perspectives, patient demographics, and healthcare coverage nuances. By varying ABPM costs and hypertension treatment expenses (medication + office visits), our model displayed in Table 4 delineates a linear relationship to forecast PPPY cost savings.
Multiple linear regression model.
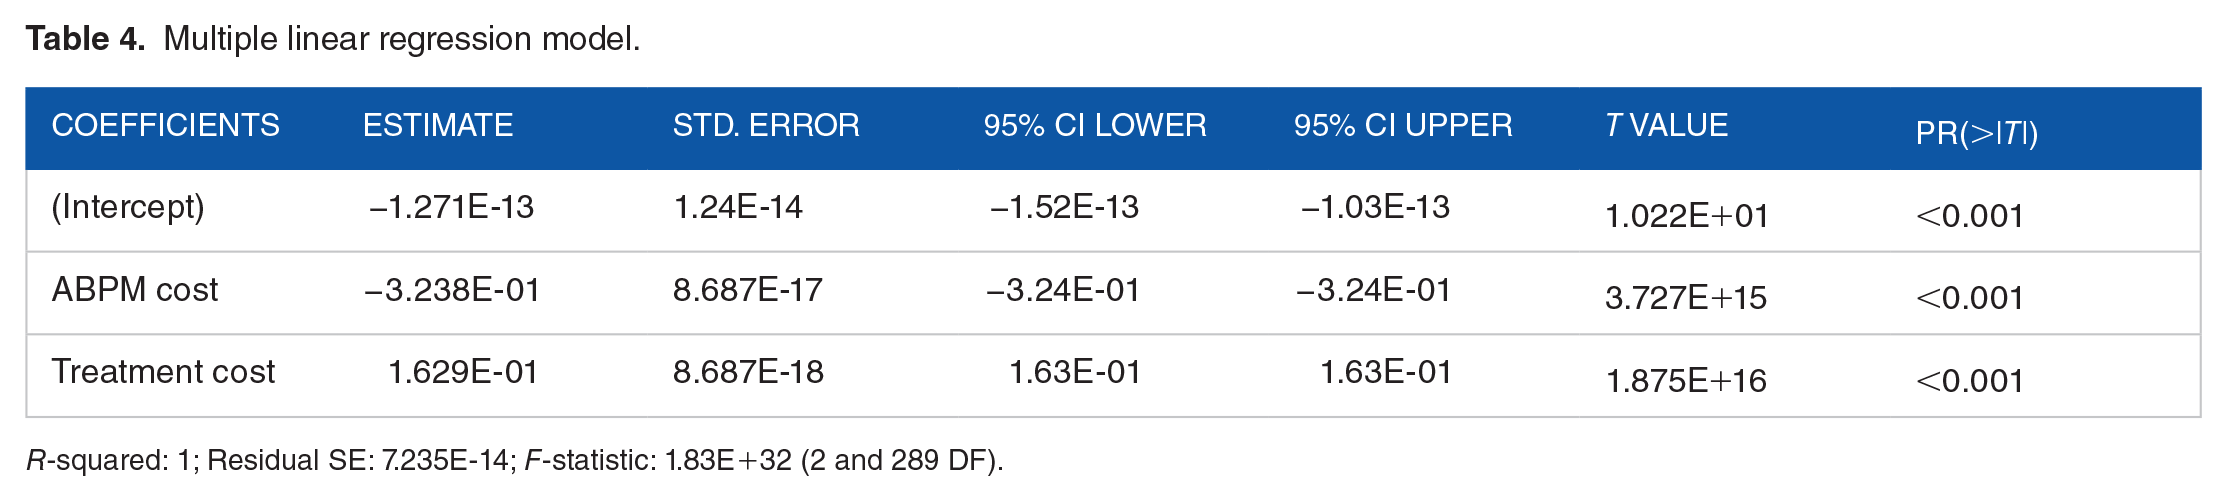
R-squared: 1; Residual SE: 7.235E-14; F-statistic: 1.83E+32 (2 and 289 DF).
The resultant model serves as a predictive tool, affirming that cost savings amplify with increased hypertension treatment costs and conversely contract as ABPM expenses rise. Notably, the utilization of ABPM emerges as a cost-saving method for ABPM annual payment rates reaching $100 as long as annual hypertension treatment costs are greater than or equal to $300.
Moreover, the potential PPPY cost savings are calculated by adjusting the annual cost of antihypertensive medications based on various patient demographics and characteristics while keeping all other baseline model inputs constant. Generally, higher-cost antihypertensive medications are associated with greater cost savings, as they contribute to higher hypertension medication expenses. Notably, black non-Hispanics demonstrate the highest savings at $87, followed by the patients from the Northeast region at $86, and patients with a CCI score of 3 or higher at $82. More details can be found in Table S2 in the Supplemental Materials.
Finally, we calculated the additional cost savings of ABPM by expanding the base-case model estimate of hypertension therapy costs to include the costs of recommended diagnostic testing, assuming that testing costs occur annually for all treated patients in both groups. We also vary the frequency of hypertension-related office visits per year from 1 to 4.
Using estimated costs of $15 for an EKG and $57 for all other laboratory tests (Table S3 in Supplemental Materials), the estimated PPPY cost savings is $148 assuming 1 office visit per year and $228 assuming 4 office visits per year. Cost savings estimates are lower if diagnostic testing is assumed to occur only during the first year of hypertension therapy, ranging from $133 to $213 PPPY, with 1 or 4 office visits per year, respectively (Table S4 in Supplemental Materials).
Discussion
This simulation study critically evaluated the cost impact of ABPM compared to CBPM for initial hypertension diagnosis over a 5-year horizon. Although the results presented are generated by a simulation model using several simplifying assumptions, the results suggest that using ABPM, as a more accurate diagnostic tool compared to CBPM, offers the potential for meaningful cost savings under a wide range of model scenarios. Base-case results indicate that using ABPM, as opposed to CBPM, yields a total cost saving of $348 028 for the hypothetical 1000 patient cohort over a 5-year period, or an average PPPY cost saving of $70. Applying a 5% discount rate reduces the present value of total cost savings to $286 323 over 5 years, equating to an average PPPY cost-saving of $57. This net cost savings increases up to $228 PPPY when increasing the frequency of annual office visits to 4 per year and adding the costs of recommended diagnostic testing annually for patients receiving treatment for primary hypertension.
The multivariable linear regression equation developed for this study using baseline assumptions for WCH and new hypertension incidence rates accounts for various perspectives related to both ABPM and hypertension treatment costs, providing a clearer insight into cost savings from different perspectives. The equation indicates that ABPM is cost-saving compared to CBPM if ABPM annual payment rates are $100 or less and the annual expenses for hypertension treatment are greater than or equal to $300. This suggests that the financial benefits of ABPM in reducing drug treatment costs outweigh ABPM expenses within these specific cost parameters.
While the results of our simulation analysis suggest that ABPM is generally cost saving across various scenarios, the model only considers the costs of ABPM testing and the costs of managing hypertension therapy. However, if treating WCH patients with hypertensive medication reduces their 5-year risk for CVD events,17,18 the hypertension treatment cost savings from not treating WCH patients would be at least partially offset by additional CVD event treatment costs. The magnitude of this potential cost offset depends on the reduction in the absolute risk associated with treating WCH patients over a 5-year period, and the cost of treating CVD events when they occur. As an additional sensitivity analysis, we assume that treated WCH patients have a 5-year risk of CVD events of 0.02 (2%). 25 Then we varied the 5-year CVD risk for untreated WCH from 5% to 50% higher than the risk for treated WCH patients, 17 and varied the average cost of treating CVD events from $5000 to $45 000. 26 We estimated the average PPPY additional CVD treatment cost by applying the assumed higher absolute risk of a CVD event and the assumed average CVD treatment cost for the 164 WCH patients not treated per year over 5 years in our base-case scenario. As shown in Table S5 in the Supplemental Materials, in a worst-case scenario that assumes absolute risk is 50% higher for untreated versus treated WCH, and assumes that average CVD event treatment costs are $45 000, the estimated additional PPPY CVD treatment cost is $74, which completely offsets the $70 PPPY net cost savings in our base-case model, and reduces net cost saving from $228 PPPY to $154 PPPY (ie, $248 - $74) in the highest hypertension treatment cost model scenario. In a scenario where CVD risk is 25% higher and average CVD event cost is $25 000, the estimated additional PPPY CVD treatment cost is $20, leaving $50 PPPY net cost savings for the base-case model, or $208 PPPY in the highest hypertension treatment cost scenario. More fundamentally, if all or most patients identified as hypertensive based on CBPM are to be treated for hypertension even if identified as WCH using ABPM, then ABPM has a limited role in the context of reducing hypertension treatment cost for WCH.
The choice of medication for treatment is a significant determinant in assessing the total cost-savings from ABPM. At present, the antihypertensive drugs most commonly used for treatment are relatively inexpensive generics, as there has been little innovation in hypertension drug treatment over the past decade. However, new biological hypertension treatments are likely to be available soon, 27 and interventional renal denervation procedures recently have been approved for hypertension treatment in the U.S.28,29 As more expensive modalities for hypertension treatment diffuse into usual practice, the cost of potentially unnecessary treatment may increase, thereby increasing the likelihood that ABPM will be net cost-saving in comparison to CBPM only. The multivariable linear regression equation derived for this study considers a range of hypertension treatment costs and thereby might anticipate greater net cost savings, especially if new branded drugs displace the use of some older generic drugs in usual care for hypertension.
Some research indicates higher WCH prevalence among women, non-smokers, and older adults.4,30 For a non-smoking status and diastolic blood pressure (DBP) of 80 mm Hg, the WCH probability for males is 17% versus females with the same characteristics (35%). 31 When plugged into our model, men yield a PPPY cost savings of $58, while women show a higher savings of $129. Older adults (65+) experience higher medication costs, possibly due to complex regimens for multiple chronic conditions. 32 Moreover, it is common for older adults to need several medications, which, even if individually less expensive, can cumulatively lead to higher overall treatment costs. According to the MEPS study, they exhibit an odds ratio of 2.70 for taking multiple medications compared to those aged 18 to 44, contributing to elevated overall treatment costs. 24 These results highlight the importance of the use of ABPM, particularly for patient characteristics associated with higher WCH prevalence and higher hypertension treatment costs, as observed for females and older adults. Moreover, when compared to younger people, older adults are at a higher risk of anti-hypertensive medication side effects such as fatigue and dizziness which may lead to falls, 33 indicating the need for ABPM to properly identify WCH patients, for both cost-savings and overall health.
Finally, ABPM not only holds promise for initial diagnosis but also as an effective long-term monitoring technique to help patients stay informed about their health status and facilitate appropriate care and treatment. A recently conducted systematic review concluded that, when compared with HBPM and CBPM, ABPM was the most cost-effective for continuous patient monitoring. 9 Nevertheless, patient preferences and convenience could continue to be potential concerns especially given the discomfort and inconvenience of 24-hour use of the cuff to measure BP, potentially impacting patients’ daily activities. 34 This highlights the demand for innovative cuffless BP monitoring devices that can integrate regular monitoring into an individual’s daily life, ensuring accurate diagnosis and effective long-term hypertension treatment and care.
Strength and Limitations
This study has several strengths. It updates prior assessments of the net cost impact of using ABPM in comparison to CBPM focused on a hypothetical patient cohort representative of the U.S. population diagnosed with primary hypertension based on CBPM using current cost estimates. It incorporates a sensitivity analysis that indicates net cost-savings associated with a wide range of assumed probability inputs for both WCH and new hypertension incidence. Additionally, the study presents a derived equation from a multivariable linear regression model, facilitating the straightforward calculation of cost-savings by adjusting the cost inputs for ABPM coverage and hypertension treatment costs and accounting for different payer perspectives and patient characteristics.
Nevertheless, this study also has some limitations. First, the simulation used for this analysis relies on a decision model structure with several simplifying assumptions and is applied to a hypothetical cohort. The simplicity of the model helps focus on specific aspects of a complex question while maintaining transparency about how the model operates, allowing readers to understand the process while also suggesting the value of future prospective or retrospective studies to assess ABPM in more complex situations, as has been done with previously conducted cost-effectiveness analysis studies. 9 To maintain simplicity and transparency, the model does not attempt to capture potential additional benefits of ABPM, such as avoiding unnecessary renal denervation procedures for treatment-resistant hypertension, or benefits of incorporating ABPM in the management of treatment for non-primary hypertension diagnoses, such as pregnancy-related hypertension (eg, preeclampsia).
The multivariable linear regression model may lack generalizability across diverse patients with distinct characteristics, as their probabilities of WCH and new hypertension incidence could vary. Additionally, the model assumes that all individuals in the WCH group adhere to annual ABPM. If some individuals decline the use of ABPM due to inconvenience, they may be managed as hypertensive patients using CBPM, potentially leading to an overestimation of the cost savings associated with ABPM in our model. Finally, while our model emphasizes the initial diagnosis of primary hypertension, a notable benefit of ABPM is its potential to diagnose and treat patients with masked hypertension. Future studies could incorporate decision rules for targeting ABPM screening, such as criteria based on age or other risk factors, to identify these patients more effectively.
Despite these limitations, the simulation model results are highly supportive of the potential cost savings from greater utilization of ABPM in clinical practice across a wide variety of model scenarios. However, this potential for cost savings needs to be confirmed by future studies that provide a short-term budget impact analysis of ABPM compared with CBPM using real-world patient data. This real-world evidence would provide a more accurate representation of the practical implications and economic considerations associated with the expanded implementation of ABPM in usual clinical practice.
Conclusion
In this simulation study, we established that the baseline cost savings from using ABPM in lieu of CBPM for diagnosing hypertension amount to $70 annually per person over 5 years and may reach up to $228 in the highest hypertension treatment cost model. The use of ABPM remains a net cost-saving approach compared to CBPM if ABPM annual payment rates are $100 or less and the annual expenses for hypertension treatment are greater or equal to $300. By using the derived multivariable linear regression equation, it becomes possible to calculate various cost-savings for different coverage amounts, thereby encompassing a wide range of perspectives. The potential for ABPM to achieve meaningful cost-savings and to reduce the burden of potentially unnecessary hypertension treatment for patients emphasizes the importance of increased investment in future research to confirm these benefits and standardize ABPM as the primary diagnostic tool for hypertension.
Supplemental Material
sj-docx-1-his-10.1177_11786329241283797 – Supplemental material for Economic Impact of Ambulatory Blood Pressure Monitoring Compared With Clinical Blood Pressure Monitoring: A Simulation Model
Supplemental material, sj-docx-1-his-10.1177_11786329241283797 for Economic Impact of Ambulatory Blood Pressure Monitoring Compared With Clinical Blood Pressure Monitoring: A Simulation Model by Michelle A Hayek, Alejandro Catacora, Mark A Lawley, Hye-Chung Kum and Robert L Ohsfeldt in Health Services Insights
Footnotes
Acknowledgements
The authors thank peer-reviewers for helpful comments and suggestions for revisions of prior versions of this manuscript. There were no additional contributions to this work beyond those explicitly stated in the authorship and funding sections of this manuscript.
Funding:
The author(s) disclosed receipt of the following financial support for the research, authorship, and/or publication of this article: This study was supported by the Texas A&M President’s Office X-grant initiative, National Science Foundation Engineering Research Center for Precise Advanced Technologies and Health Systems for Underserved Populations (PATHS-UP), [Grant Number 1648451], and Population Informatics Lab at Texas A&M University.
Declaration of conflicting interests:
The author(s) declared no potential conflicts of interest with respect to the research, authorship, and/or publication of this article.
Author Contributions
Concept and design: MH, AC, RO.
Acquisition, analysis, or interpretation of data: All authors.
Drafting of the manuscript: MH, RO.
Critical revision of the manuscript for important intellectual content: All authors.
Supervision: RO, HCK, ML.
All authors agree to be accountable for all aspects of the work in ensuring that questions related to the accuracy or integrity of any part of the work are appropriately investigated and resolved.
Additional Contributions: None.
Statements and Declarations
Not applicable.
Ethical Considerations
This article does not contain any studies with human or animal participants.
There are no human participants in this article and informed consent is not required.
Consent to Participate
Not applicable.
Consent for Publication
Not applicable.
Data Availability
Data sharing is not applicable to this article as no datasets were generated or analyzed during the current study.
Supplemental Material
Supplemental material for this article is available online.
References
Supplementary Material
Please find the following supplemental material available below.
For Open Access articles published under a Creative Commons License, all supplemental material carries the same license as the article it is associated with.
For non-Open Access articles published, all supplemental material carries a non-exclusive license, and permission requests for re-use of supplemental material or any part of supplemental material shall be sent directly to the copyright owner as specified in the copyright notice associated with the article.