
Abstract
Background:
The assessment of antidepressant and anxiolytic consumption and expenditures represents a reliable barometer of the burden of such mental health disorders and the effectiveness of relative healthcare services.
Objectives:
The current analysis aims to evaluate trajectories of consumption and expenditures of antidepressant and anxiolytic drugs to define patterns of usage and spending across 14 European countries between 2012 and 2021.
Methods:
A retrospective longitudinal study was performed based on pooled time series secondary data analysis over 2012/2021. Defined Daily Doses (DDD) per 1000 inhabitants and health expenditure per capita were analysed. Linear and quadratic trends were computed to determine relationships between the variables of interest.
Results:
Only 2 patterns of consumption/expenditure of antidepressants can be identified: consumption and expenditure both grow; consumption grows, and spending decreases. Consumption and expenditures registered 2 main patterns, decreasing in most European countries and increasing only in 2 cases.
Conclusion:
Prevailing patterns of consumption and spending show an increase in antidepressants and a decrease in anxiolytics. The variation in consumption of such drugs during this timeframe is attributable to several reasons, such as the epidemiological characteristics of mental disease, for instance, the prevalence and incidence of disorders, the accessibility of drugs and alternative treatments, like psychotherapy, different clinical practices and national guidelines. However, such analyses deserve attention for targeted policies and strategies for promoting mental health.
Keywords
Introduction
Depressive and anxiety disorders are common and seriously affect the quality of life of patients, and together with other mental disorders, represent a leading cause of disability with high morbidity and a high risk of premature mortality. 1 In 2019, the prevalence of anxiety disorders in Europe was around 3.6% and 6.3%, increasing from Eastern to Central and Western Europe, which recorded a higher percentage (between 7.62% and 5.24%) with an average incidence of 0.14. 2 Depressive disorders registered a lower prevalence, between 4.84% in Western Europe and 3.45% in Central Europe, with an intermediate value in Eastern Europe (4.29%). 2 According to the World Health Organization (WHO), the overall burden of disease is evaluated by accounting for the years of life lost due to premature mortality (YLLs) and years of life lived with a disability (YLDs), whose sum is defined as disability-adjusted life years (DALYs). 3 DALYs for depressive disorders in Western Europe were notably higher than in other European areas (3 463 005.19, whereas 1 442 694.80 in Eastern Europe and 596 439.89 in Central Europe). Regarding DALYs for anxiety disorders, similar differences were observed among the different European areas (2 447 055.38 in Western Europe, 689 506.06 in Eastern Europe, and 397 537.62 in Central Europe).3,4
Antidepressants are classified according to their different mechanism of action, and the class of Selective Serotonin Reuptake Inhibitors are among the safest, most tolerated and thus prescribed. Furthermore, indications of antidepressants encompass both psychiatric (i.e. depression, panic disorders) and non-psychiatric disorders, such as neuropathic pain and alcoholism. 5 Also, anxiolytics encompass a broad range of classes of medications for the treatment of panic disorders, generalised anxiety, and sleep disorders. Several uses in various conditions are also common, with attention to proper dosage and after consulting trained specialists. 6
The management and treatment of anxiety and depressive disorders is a major clinical and societal challenge, resulting in a significant physical and emotional impact on patients and their families, as well as a financial burden. The cost of depression has been deeply studied in past years, posing this issue as a significant concern for the economic welfare in Europe. 7 Recent findings highlighted an increase in workplace costs related to major depressive disorders (costs due to missed days of work and reduced productivity), which rose more than direct costs due to medical services and healthcare resources utilisation. 8 In addition, relevant healthcare costs were attributed to anxiety disorders, mainly on a population level, due to the high prevalence of such diseases. 9 Since mental health is one of the main topics of numerous efforts to improve well-being, novel strategies and campaigns are prompted at both global and European levels.10,11 Previously, few researchers focussed simultaneously on the use and spending of antidepressants and anxiolytics in Europe.12,13 Hence, consumption and healthcare expenditures attributable to antidepressant and anxiolytic treatment represent a crucial topic for evaluating the efficacy of clinical procedures and services addressing psychiatric patients.
The current analysis aims to describe trajectories in the consumption of antidepressant and anxiolytic drugs and related pharmaceutical expenditures to define patterns of usage and spending across European countries. Such evaluation helps monitor trends and incidence of mental disorders and associated pharmaceutical prescriptions, health resources management for cost optimisation and better investment allocation.
Methods
A retrospective longitudinal study was conducted based on pooled time series analysis on secondary data from Organisation for Economic Co-operation and Development (OECD) datasets. The current analysis exclusively focussed on the consumption and spending of anxiolytics and antidepressants in Europe. Thus, the sample only covers European countries. Selection criteria for countries and drugs were established as follows: from the OECD datasets, data on pharmaceutical consumption and sales were considered for antidepressants and anxiolytics, according to the Anatomical Therapeutic Chemical (ATC) codes. Only European countries whose data were utterly available for each year between 2012 and 2021 were considered. Hence, collected data belong to 14 European countries (Austria, Czech Republic, Finland, Germany, Hungary, Italy, Latvia, Luxembourg, Norway, Portugal, Slovak Republic, Slovenia, Spain and Sweden) over 10 years (2012-2021).
Defined Daily Doses (DDD) per 1000 inhabitants were analysed for both antidepressant and anxiolytic drugs. DDD represents a tool for measuring the average daily dose of a medicine prescribed for adults according to the main indications. It refers to drugs with assigned ATC codes. 14 Health expenditure per capita was considered for both antidepressant and anxiolytic drugs. To help facilitate comparison across countries, we used purchasing power parity (PPP), 15 a measure that compares the absolute purchasing power of multiple countries’ currencies. To make a meaningful comparison of expenditures across countries, we used PPP current prices because, in the PPP measure, exchange rate changes over time are assumed to be dependent on inflation rate differentials between countries and because the use of constant prices would lead to evaluating only the shift in consumption, which is already analysed with the DDD.
Drugs corresponded to the Anatomical Therapeutic Chemical (ATC) codes N05B for anxiolytics and N06A for antidepressants.
The overall annual mean (and standard deviation, SD) was computed for both antidepressants and anxiolytics DDD per 1000 inhabitants and US$ per capita.
Linear and quadratic trends were assessed to define how consumption and expenditure of antidepressants and anxiolytics varied from 2012 to 2021. The linear trend describes a constant rate of change over time, and the relative b-coefficient defines the slope of the line, thus the increase (if positive) and the decrease (if negative) of the variable. The greater the b-coefficient, the upward steeper the linear trend line. The quadratic trend represents an inconstant change over time. The quadratic b-coefficient (b-squared coefficient) indicates, if positive, a convex curve (apex at the bottom, curve opens up) and, if negative, a concave curve (apex at the top, curve opens down). 16
Linear terms and b-coefficients are used as synonyms, as well as quadratic terms and b-squared coefficients. Statistical significance was set at P < .05 to detect a significant trend due to a real effect rather than a random chance. Thus, a small p-value provides strong evidence.
Regression models were performed using Stata SE 17.
OECD.Stats is the OECD’s online statistical platform, where data from OECD countries and selected non-member economies are gathered in datasets and made available online at https://stats.oecd.org/. Data were collected from the ‘Pharmaceutical Market’ and ‘Pharmaceutical sales’ datasets.
Since secondary aggregated data are published and fully available online on OECD.Stats website, the current research does not require ethical approval.
Results
Regression models and trend analysis: Overall, countries
The current analysis highlighted a significant increase in the consumption of antidepressants among 14 European countries; hence, antidepressant results described an upward convex trend (b coefficient = 1.70; b-squared coefficient = 0.07). On the contrary, expenditures registered a slight decrease, although the linear trend was not significant (b coefficient = −0.03; b-squared coefficient = 0.05). Consumption of anxiolytics significantly decreased between 2012 and 2021; results also defined a downward concave trend (b coefficient = −0.48; b-squared coefficient = −0.04). The relative expenditure remained approximately stable, although the linear trend did not result significant (b coefficient = 0.01; b-squared coefficient = −0.01). See Table 1 and Figure 1a and b.
Overall annual mean value (and Standard Deviation – SD) for all variables during 10 years (2012-2021) and specific linear and quadratic coefficient. (


Overall consumption (a and b) and expenditures (c and d) of antidepressants among 14 OECD European countries between 2012 and 2021. (DDD: Defined daily dose; US: United States). Overall consumption (e and f) and expenditures (g and h) of anxiolytics among 14 OECD European countries between 2012 and 2021. DDD: Defined daily dose; US: United States.
Regression models and trend analysis: Country-specific consumption
The analysed countries reported increasing antidepressant consumption, with the linear terms (ie, b-coefficient) significantly positive, except for Luxembourg and Norway, which had no significant results. Finland (b-coefficient 1.77), Portugal (b-coefficient 6.05), Spain (b-coefficient 3) and Sweden (b-coefficient 2.99) reported higher linear terms, indicating a deeper increasing slope.
In addition, Finland (b-squared 0.39), Italy (b-squared 0.07), Latvia (b-squared 0.07) and Portugal (b-squared 0.51) registered a significant convex quadratic trend, namely an acceleration of the phenomenon during the decade. For further details, see Table 2 and Figure 2a to e.
Linear and quadratic regression models for antidepressant consumption in 14 European countries. (


Country-specific linear and quadratic trends of antidepressants consumption (measured in Defined Daily Dose -DDD per 1000 inhabitants) and expenditure (measured in United States – US dollars per capita) among 14 OECD European countries during 2012 to 2021. (in 2a: Austria, the Czeck Republic, Finland; in 2b: Germany, Hungary, Italy; in 2c:Latvia, Luxembourg, Norway; in 2d: Portugal, Slovak Republic, Slovenia; in 2e: Spain, Sweden)
Country-specific anxiolytic consumption decreased between 2012 and 2021. Indeed, the analysis resulted in negative b-coefficients for most countries, defining a downward linear trend. Such linear decrease was emphasised in Finland (b-coefficient −1.27), Luxembourg (b-coefficient −2.08) and Portugal (b-coefficient −1.46), with lower negative values. On the contrary, Latvia (b-coefficient 0.27) and Spain (b-coefficient 0.75) reported a slight increase in anxiolytics consumption, thus a significant positive b-coefficient, however close to zero. Considering the quadratic regression models, Austria (b-squared −0.03), Luxembourg (b-squared −0.29) and Portugal (b-squared −0.20) reported a significant concave quadratic trend. Finland (b-squared 0.03), Germany (b-squared 0.01), Norway (b-squared 0.05) and Slovenia (b-squared 0.02) registered a significant convex quadratic trend. However, b-squared terms were approximately near zero, meaning a slow change of the phenomenon over time. See Table 3 and Figure 3a to e for further details.
Linear and quadratic regression models for anxiolytics consumption in 14 European countries (DDD per 1000 inhabitants).

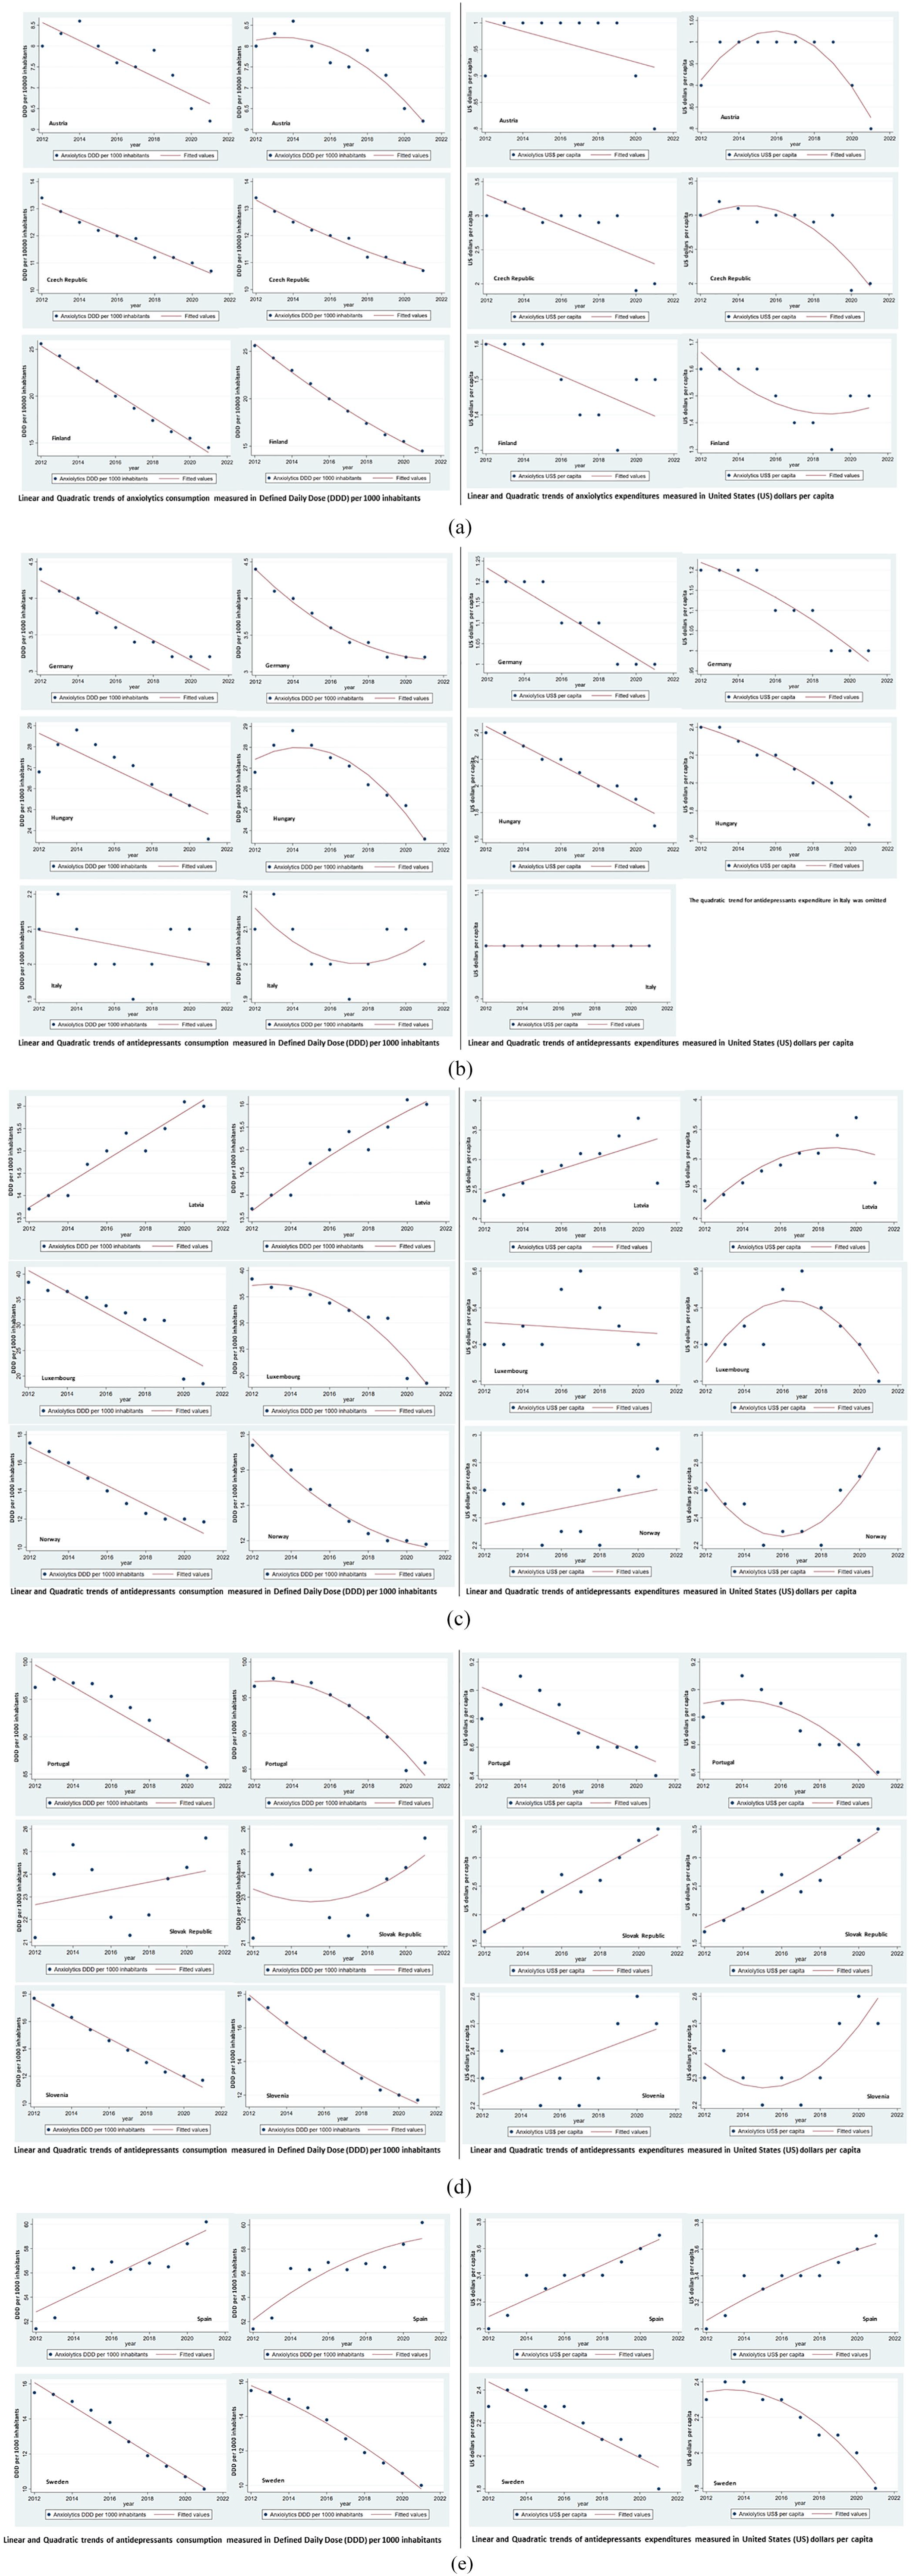
Country-specific linear and quadratic trends of anxiolytics consumption (measured in Defined Daily Dose -DDD per 1000 inhabitants) and expenditure (measured in United States – US dollars per capita) among 14 OECD European countries during 2012 to 2021. (in 3a: Austria, the Czeck Republic, Finland; in 3b: Germany, Hungary, Italy; in 3c:Latvia, Luxembourg, Norway; in 3d: Portugal, Slovak Republic, Slovenia; in 3e: Spain, Sweden)
Regression models and trend analysis: Country-specific expenditure
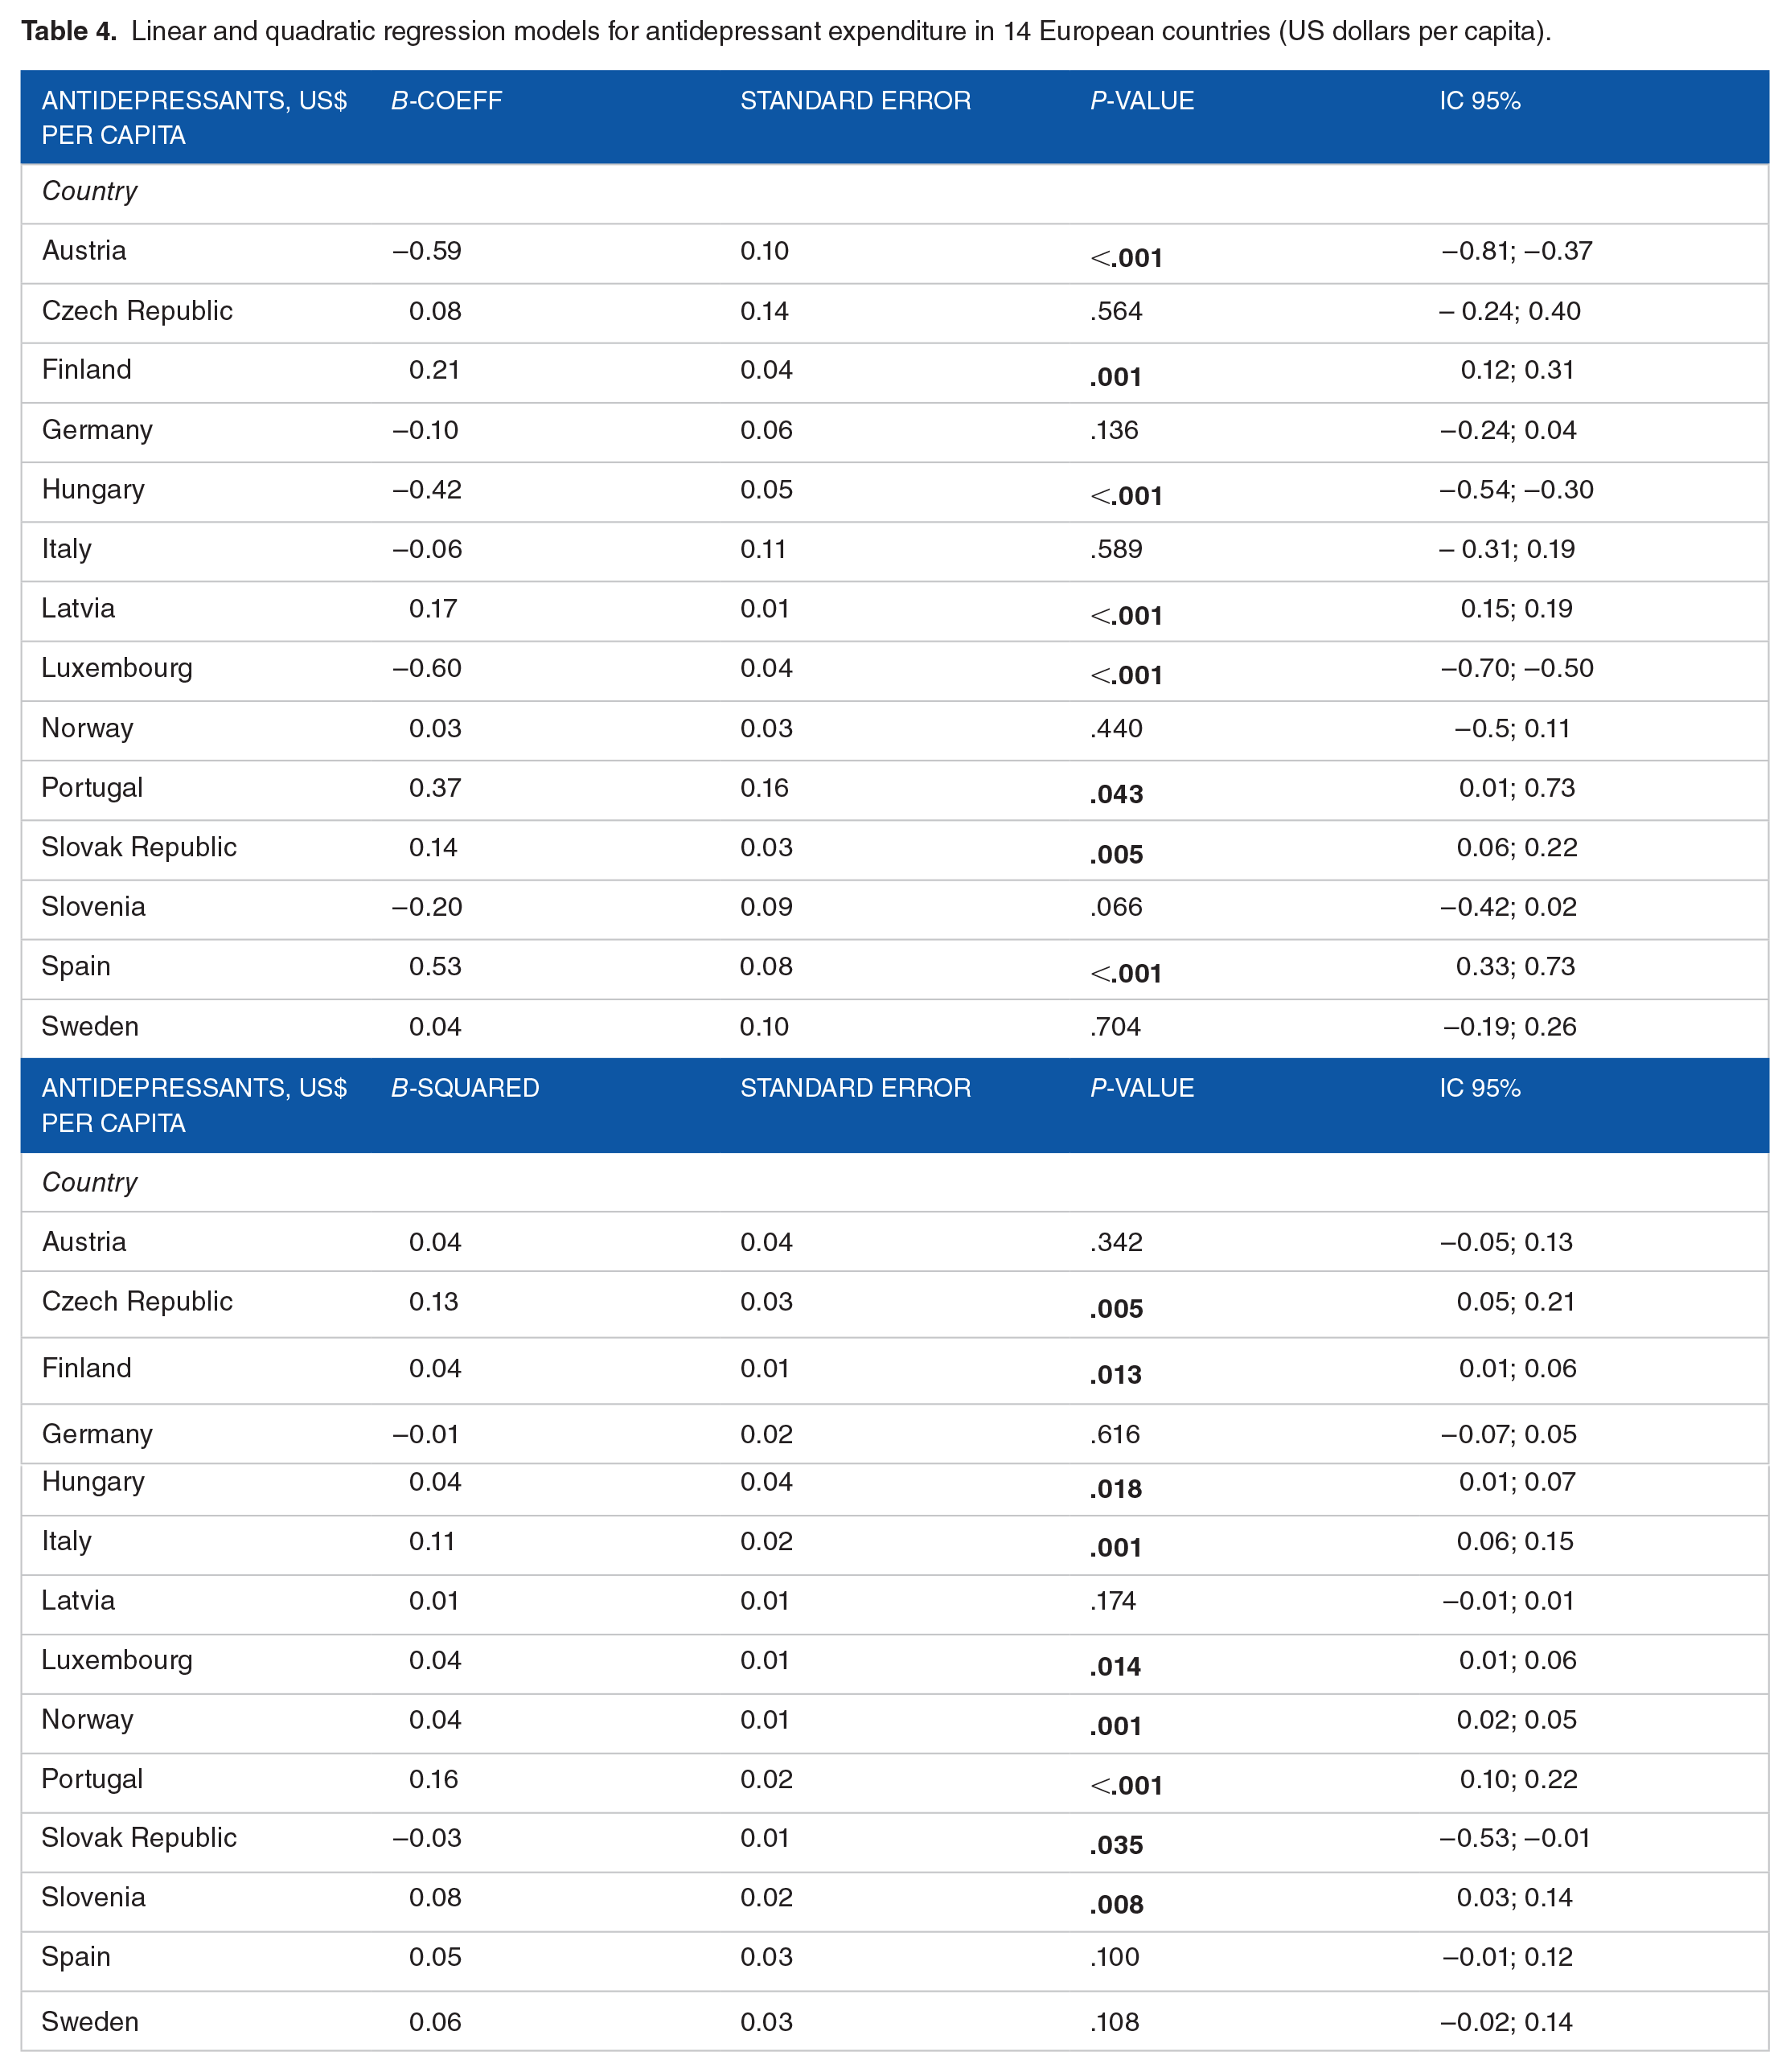
Country-specific antidepressant expenditures varied significantly, with a slight increase in spending in Finland (b-coefficient 0.21), Latvia (b-coefficient 0.17), Portugal (b-coefficient 0.37), Slovak Republic (b-coefficient 0.14) and Spain (b-coefficient 0.53), whose linear terms were positive, although close to zero, indicating an upward trend of the phenomenon. A weak increase in expenditures was observed for Austria (b-coefficient −0.59), Hungary (b-coefficient −0.42) and Luxembourg (b-coefficient −0.60). However, the linear term was lower than 1, indicating a light climb. The quadratic trend was significant and convex for Finland (b-squared 0.04), Hungary (b-squared 0.04), Luxembourg (b-squared 0.04), Portugal (b-squared 0.16), whereas it was significant and concave for the Slovak Republic. Table 4 and Figure 2a to e showed further details.
Linear and quadratic regression models for antidepressant expenditure in 14 European countries (US dollars per capita).
Most countries reported a reduction in spending on anxiolytic medications. A country-specific weakly downward linear trend was observed for the Czech Republic (b-coefficient −0.01), Finland (b-coefficient −0.02), Germany (b-coefficient −0.03), Hungary (b-coefficient −0.07), Portugal (b-coefficient −0.06) and Sweden (b-coefficient −0.06). Values of linear terms (b-coefficient) were indeed negative, although very low, outlining a slight drop across the years. On the contrary, Latvia (b-coefficient 0.11), the Slovak Republic (b-coefficient 0.19) and Spain (b-coefficient 0.06) reported a mild increase in expenditure, defined by an upward linear trend. Also, such b-coefficients were close to zero. A significant concave quadratic trend was noted for the Czech Republic (b-squared −0.03), Hungary (b-squared −0.10) and Sweden (b-squared −0.01). The computation of linear and quadratic trends for anxiolytic spending in Italy was omitted. See Table 5 and Figure 3a to e for further details.
Linear and quadratic regression models for anxiolytics expenditure in 14 European countries (US dollars per capita).

Discussion
The current analysis aims to describe temporal trends in the consumption of antidepressant and anxiolytic drugs and related pharmaceutical expenditures in 14 European countries during 2012 to 2021 and whether patterns of consumption and spending are present.
According to our analysis, antidepressant consumption tends to increase in European countries. Hence, a prevailing pattern of consumption can be defined. Unexpected results are related to antidepressant expenditures. Indeed, only 2 patterns of consumption/expenditure of antidepressants can be identified: consumption and expenditure both grow; consumption grows, and spending decreases. Consumption and expenditures of anxiolytic drugs registered 2 main patterns: decreasing in most European countries and increasing only in 2 cases.
The variation in consumption of such drugs during this timeframe is likely attributable not to a single cause but to the sum of different factors. Patterns of prescribing and use rates of antidepressants may vary across countries for several reasons, such as the epidemiological characteristics of mental disease, for instance, prevalence and incidence of disorders, the accessibility of drugs and alternative treatments, like psychotherapy, different clinical practices and national guidelines.17-19
The increasing use of antidepressants may also relate to prompter diagnosis in both primary and secondary levels of assistance and with broader clinical indications comprehending non-psychiatric disorders, for example, smoking cessation and neuropathic pain.Moreover, younger patients, such as children and adolescents, especially females, in Spain and young adults in Sweden, are increasingly prescribed antidepressant treatment.20-23
The discordant trend has affected Hungary and Austria. It is arduous to justify this trend. However, multiple policies related to pricing and expenditure controls have likely played a more significant role in these countries than in others. 19 In Hungary, the prices of pharmaceuticals are set through External Reference Pricing (ERP), a mechanism for price regulation based on price comparison among several countries to ensure optimal prices of medications within a country. 23 The ERP comparator basket clusters several countries similar for Gross Domestic Product per capita (GDP p.c.), adjusted for purchasing power parity, and for a funding system. Looking at the European Union or European Economic Area (EU/EEA), Hungary’s comparator basket is broader and establishes prices based on the lowest references. Furthermore, risk-sharing agreement schemes are adopted as a complement. Manufacturers must engage in price volume agreements, according to which price reduction occurs in case of a surplus of negotiated sales or volumes and whether the released budget of total expenses is exceeded. 24 Similarly, the policy framework and enforcement of pharmaceutical regulations have occurred in Austria. Prices and reimbursement of outpatients’ medications are established through a health technology assessment (HTA) procedure, including pharmacological, medical and economic evaluation. The pricing policy for medicines in the outpatient sector is the ERP, fixed at the producer’s basic costs, known as the ex-factory price. Arranging benchmark prices is based on the EU average price and statutory manufacturer discounts, referring to the other EU countries. Considering reduction rates, a price link policy for generic drugs is set to prompt their use and save costs.19,25
Opposite trends of rising consumption and decreasing spending may also reflect product cost reduction, for instance, through more extensive use of generic or old active ingredients. Generic substitution is a relatively long pharmaceutical policy in Hungary, where internal price referencing is applied for generic drugs. The lowest-priced product is considered the benchmark for establishing the reimbursement percentage regarding medicines with the same active principle and mechanism of action. Since 2011, the National Institute of Health Insurance Fund Management (NIHIFM) has managed the generic reference pricing scheme through a biannual blinded bidding process. Generic manufacturers are called to propose their price reduction. Therefore, the lowest-priced drug is settled as the reference product. Pharmacists are finally required to offer the cheapest medicine to encourage generic sales and foster healthcare savings. 26
Conversely, consumption and expenditure for anxiolytics seem to contract widely in most European countries. According to the European Medicines Agency (EMA), benzodiazepines are active substances with dependence potential, inducing withdrawal symptoms and complicating the treatment’s interruption. Moreover, evidence about the association between drug abuse and benzodiazepine consumption was found. 27 In this regard, uncertainty about the balance of risk and benefit 28 and the recommended limitations of their use in clinical practice due to concerns about tolerability and safety 29 are possible reasons behind the downward prescriptions and contracted spending of anxiolytics. Moreover, benzodiazepine use in the elderly is associated with a higher risk of adverse effects due to changes in drug metabolism and frequent polytherapy, highlighting misuse and inappropriate prescription during the last decades. 30
Prescriptions of benzodiazepines in Portugal remained stable between 2017 and 2019 after a sudden increase in 2016. 31 We also observed downward consumption and expenditure, with a concave quadratic trend indicating a slowdown during the last years. Accordingly, prolonged assumptions and related addiction for users and also excessive prescribing in primary healthcare have raised several concerns, especially in specific areas of the countries and among elderly patients. 12
A particular pattern of consumption/expenditure can be identified for Latvia and Spain, where anxiolytics consumption and expenditure grow differently from others.
In Spain, an increasing linear trend of anxiolytics consumption matched a significant linear increase in per capita spent. Accordingly, previous studies have already shown incremental trends during the past decades20,30 and a peak in 2020 after steady consumption across the year before the pandemic, mainly in some areas of the country. 32 A likely explanation regards a heavy economic recession in the late 2000s affecting Spain, followed by an increase in the unemployment rates, intensely challenging people’s psychological balance and negatively affecting suicide rates from 2002 to 2013. 33 Previous findings highlighted the association between unemployment and poor mental health. In addition, deteriorated living conditions ascribed to unemployment and lower salaries relate to a higher request for psychological or psychiatric assistance.34-36
In 2005, the Latvian government reformed the pharmaceutical system, releasing a novel national drug policy to supervise prescriptions of psychotropic drugs and introduce advanced guidelines. Hence, this country’s upward consumption and expenditure are arduous to explain. In addition, physicians are currently the only healthcare workers allowed to prescribe psychotropic medications, compulsorily filling a diagnosis code within the form. The prescriptions’ validity period lasts 30 days, and a lower threshold of the number of one-shot prescribed medications was set compared to 2005. The reimbursement also depends on a combined supply and demand supporting system, aiming to prompt the use of generics. Supported by literature, the national pharmaceutical reform in Latvia may not have realised the full potential for available savings and decreased consumption of anxiolytic drugs. Indeed, patients’ preferences may crucially obstruct the implementation of generic medicines policy.37-39
Strengths and limitations
This study has some limitations. Firstly, we accounted for only 14 countries due to the lack of data availability about consumption and expenditure from the remaining EU countries. Additional limitations are different coding criteria, breaks in the database and use of provisional or estimated values shared in referring administrative data sources. Indeed, some countries report reimbursement data that does not include the consumption of drugs obtained without prescriptions, even if required, and other non-reimbursed courses. Finally, the OECD database uses Defined Daily Dose (DDD) as the unit of measurement of drug consumption without focusing on several available classes of drugs. DDD is defined as ‘the assumed average maintenance dose per day for a drug used on its main indication in adults’. 14 Therefore, prescribed doses and intakes may often differ according to patients’ characteristics. However, DDD represents a technical unit used for monitoring and studying drug utilisation, allows quantifications and comparisons at multiple levels, and is also international. It combines different individual doses of drugs for pharmacoepidemiological assessment.40,41
Considering DDD per 1000 inhabitants and sales of antidepressant and anxiolytic drugs, this is one of few studies which carried out a parallel analysis of consumption/expenditure in 14 EU countries for 10 years (2012-2021) and by identifying behavioural patterns. As further strength, the study outlines the trajectories of both antidepressants and anxiolytics consumption/expenditure.
Previous findings refer mainly to antidepressant consumption, overlooking economic aspects such as costs and expenditures. In addition, research about anxiolytic treatment is somehow lacking, especially those focussing on spending. Information from EU countries is also scarce and barely integrated. Indeed, the literature does not provide a comparative analysis of antidepressant and anxiolytic consumption and expenditure to understand whether the trend is overlapping or divergent.
Conclusion
Prevailing patterns of consumption and spending show an increase in antidepressants and a decrease in anxiolytics. For a few countries, there is a pattern contrary to most countries for anxiolytics (Latvia, Spain) and discordant between consumption and expenditure for antidepressants (Austria, Hungary).
The widespread growth of antidepressant use deserves attention. Public health policymakers should, on the one hand, implement more detailed policies on the prescription and use of antidepressants and, on the other, evaluate the opportunity to encourage combined treatments -medical and psychological – for such mental disorders. The promotion of available opportunities for care and assistance of people affected with mental disorders and the development of programmes to support several population age groups can be effective interventions. Prevention through promoting healthy living and working conditions and early identification of emotional and behavioural issues among exposed and fragile groups represent valid strategies for implementing novel policies.
For this purpose, information about treatments’ efficacy, availability, and acceptability is crucial for policy decisions and should be the subject of further in-depth studies. Cost-containment policy in public pharmaceutical spending should carefully assess which measures are most effective, including the experience of those countries that have managed to reduce expenditures.
Footnotes
Acknowledgements
None.
Funding:
The author(s) received no financial support for the research, authorship, and/or publication of this article.
Declaration of conflicting interests:
The author(s) declared no potential conflicts of interest with respect to the research, authorship, and/or publication of this article.
Author Contributions
MMG and MM: Conceptualisation, Methodology; MM and EM: Data curation, Writing- Original draft preparation. MM: Visualisation, Investigation. MMG: Supervision and Project administration; MMG and MM: Writing- Reviewing and Editing.