
Abstract
Disparities in accessing advanced stroke treatment have been recognized as a policy challenge in multiple countries, including Japan, necessitating priority solutions. Nevertheless, more practical healthcare policies must be implemented due to the limited availability of healthcare staff and financial resources in most nations. This study aimed to evaluate the supply and demand balance of mechanical thrombectomy (MT) and identify areas with high priority for enhancing stroke centers. The target area of this study was Hokkaido, Japan. We adopted the capacitated maximal covering location problem (CMCLP) to propose an optimal allocation without increasing the number of medical facilities. Four realistic scenarios with varying levels of total MT supply capacity for Primary stroke centers and assuming a range of 90 minutes by car from the center were created and simulated. From scenarios 1 to 4, the coverage increased by approximately 53% to 85%, scenarios 2 and 3 had 5% oversupply, and scenario 4 had an oversupply of approximately 20%. When the supply capacity cap was eliminated and 8 PSCs received 31 or more patients, they became priority enhancement targets. The CMCLP estimates demand coverage considering the supply and demand balance and indicates areas and facilities where MT supply capacity enhancement is a priority.
Keywords
Introduction
Stroke is the second leading cause of death and third leading cause of disability-adjusted life-years worldwide, 1 resulting in a significant social cost in Japan due to the need for long-term care for stroke survivors. 2 Approximately 25% of patients with long-term care needs (level 4 or 5, with level 5 representing the highest level of need) were diagnosed with cerebrovascular disease. 2 In the last 2 decades, in Japan, the age of stroke onset has been increasing; nonetheless, the outcome at discharge has improved 3 because of the popularity of intravenous thrombolysis (IVT) and mechanical thrombectomy (MT) for ischemic stroke. 4 In particular, the time window of MT has expanded to within 24 hours of the last well-known time frame in specific cases.5,6 Advances are expected to improve the outcome of large vessel occlusion in the future. Expanding the time window of MT enhances the significance of the mothership model among multiple transport models, which directly transport patients to facilities capable of providing IVT/MT. 7 The number of MT (Japanese medical service code: K178-4) cases in Japan has significantly increased from 2860 (from April 2014 to March 2015) to 13 297 (from April 2020 to March 2021). 8 However, challenges related to regional disparities, such as the MT implementation rate and maldistribution of specialized hospitals/specialists, persist.9 -11 Moreover, disparities in access to advanced stroke treatment have been recognized as a policy challenge in several countries, including Japan, requiring priority solutions.12 -15 The Ministry of Health, Labor and Welfare, and the Japan Stroke Association (JSA) work to reduce regional disparities by promoting the establishment of primary stroke center (PSC) core facilities that can provide 7 days/24 hours of MT. 15 This corresponds to the stroke medical care system, which consists of the PSC, thrombectomy capable stroke centers (TSC), and comprehensive stroke centers (CSC), which have been advanced in the U.S. 16 As of 2020, approximately 93% of the population in Japan can access PSC cores within 60 minutes via emergency transportation. 17 However, population coverage does not consider the supply and demand balance. A disparity between supply and demand may cause hospital congestion in acute care, causing delays in treatment for patients.18,19 Therefore, addressing these challenges requires optimizing hospital location, capacity, and staffing according to population-based estimates of patient demand.
In the context of the optimal allocation of medical resources for acute stroke treatment, the maximal covering location problem (MCLP), developed by Church and ReVelle, 20 was applied to determine a reasonable location that achieves maximum population coverage for PSCs in the U.S. 21 The MCLP distributes limited resources to maximize population coverage. Moreover, the MCLP has been expanded to include the capacitated maximal covering location problem (CMCLP), which is set to the capacity for each facility or location. 22 In the real world, emergency hospitals possess a finite number of treatment options based on the number of physicians or beds available. Therefore, the CMCLP proves to be a reasonable method for the optimal allocation of resources.
In this study, we adopted the CMCLP. The CMCLP sets an upper limit on the capacity of facilities and maximizes the covered demand within the reachable area. 22 This method determines candidate facilities to strengthen the supply capacity from existing facilities without new facilities. Therefore, we propose optimal allocation without increasing medical facilities, which is suitable for Japan, where the declining working population is decisive in the future. The purpose of this study is to (1) evaluate the supply and demand balance of MTs and (2) identify areas with high priority for PSC core establishment. These results can contribute to the development of medical policy for individuals in the stroke medical care system.
Methods
Study design
This was a cross-sectional simulation study.
Study area and target
This study targeted Hokkaido Prefecture in Japan. Hokkaido is characterized by the largest area and smallest population density of prefectures. There is a large difference in medical resources between urban and rural areas, and there are estimated regional disparities in MT. 10 Twenty-one secondary medical areas (SMAs) have been established as areas for developing a standard emergency medical care system. 23 The population density and distribution of SMAs are described in Figure 1 and Supplemental 1. There were 40 PSCs in Hokkaido (February 2022), 32 of which had at least 1 neurointerventionalist for MT (MT-capable PSC). Of these PSCs, 11 had a high capacity to provide MT (PSC core), and 8 were only capable of IVT. In summary, MT-capable hospital can perform MT in limited situations; PSC core can perform MT 7 days/24 hours. Since PSC cores were undisclosed until February 25, 2022, their definition was based on suggestions from physicians.

This shows the location of Hokkaido in Japan and population density (population per km2) in secondary medical areas.
Capacitated maximum covering location problem (CMCLP)
This problem solves the optimal location and allocation of demand to each facility. The CMCLP allocates demand according to the capacity of each facility (eg, number of beds and physicians), that is, according to its supply capacity, to ensure no allocation of demand in excess of capacity. This allows for a focus on coverage based on the supply and demand balance. 24 The MCLP, on which the CMCLP is based, finds the p facility locations that maximize the demand covered within a certain distance or time range from the facility without considering capacity and maximizes the coverage area with a limited number of facilities. Equations (1)–(6) illustrate the CMCLP.


The meaning of each equation is as follows: (1) equation (1) is the objective function to maximize the number of demand points covered by the PSCs, and 2 through 6 are the constraints; (2) no demand point is covered by more than 1 PSC; (3) the supply of PSCs and PSC core does not exceed the total supply K; (4) the total number of facilities; (5) a binary function that takes 1 if PSC j covers demand point i and 0 if it does not; and (6) the binary function that is, 1 if a PSC is placed and 0 if not. The parameters and definitions are described in Table 1.
Parameters and scenarios used in this modeling.

PSC, primary stroke center.
MT, mechanical thrombectomy.
Scenarios and analysis
We established 4 scenarios (MT case/year) for the supply capacity of MT-capable PSCs (n = 21) and PSC cores (n = 11) based on interviews with physicians: Scenario 1 [MT-capable PSC: 10, PSC core: 50]; Scenario 2 [MT-capable PSC: 10, PSC core: 80]; Scenario 3 [MT-capable PSC: 30, PSC core: 50]; and Scenario 4 [MT-capable PSC: 30, PSC core: 80]. The demand points are the average of 1000 iterations of a randomly generated process according to the incidence of ischemic stroke (cardiogenic embolism) (26.8/100 000/year). 25 Consequently, the demand point represents the hypothetical location of a stroke patient undergoing MT. The demand points are distributed according to the population size included in the 1 km × 1 km grid data. Morii et al 26 described this generative demand point method. As a result, a demand of 1445 persons was generated in 1152 locations. We defined the coverage area of each PSC as within 90 minutes (travel time by car), which is expected to have a high treatment effect. 27 We map the PSCs and demand points in Figure 2. First, we calculated the coverage by the ratio of demand points to all demand points in scenarios 1 to 4. Next, we eliminated the capacity limit and tested which PSCs (excluding the PSC core) would cover the noncovered points in the first analysis (Scenario 1). A PSC that captures more points is a candidate PSC core. All analyses were performed using the Network Analyst tool of Arc GIS Pro 2.8.0 (Esri, Inc.) and R 4.2.0, 28 R studio. 29
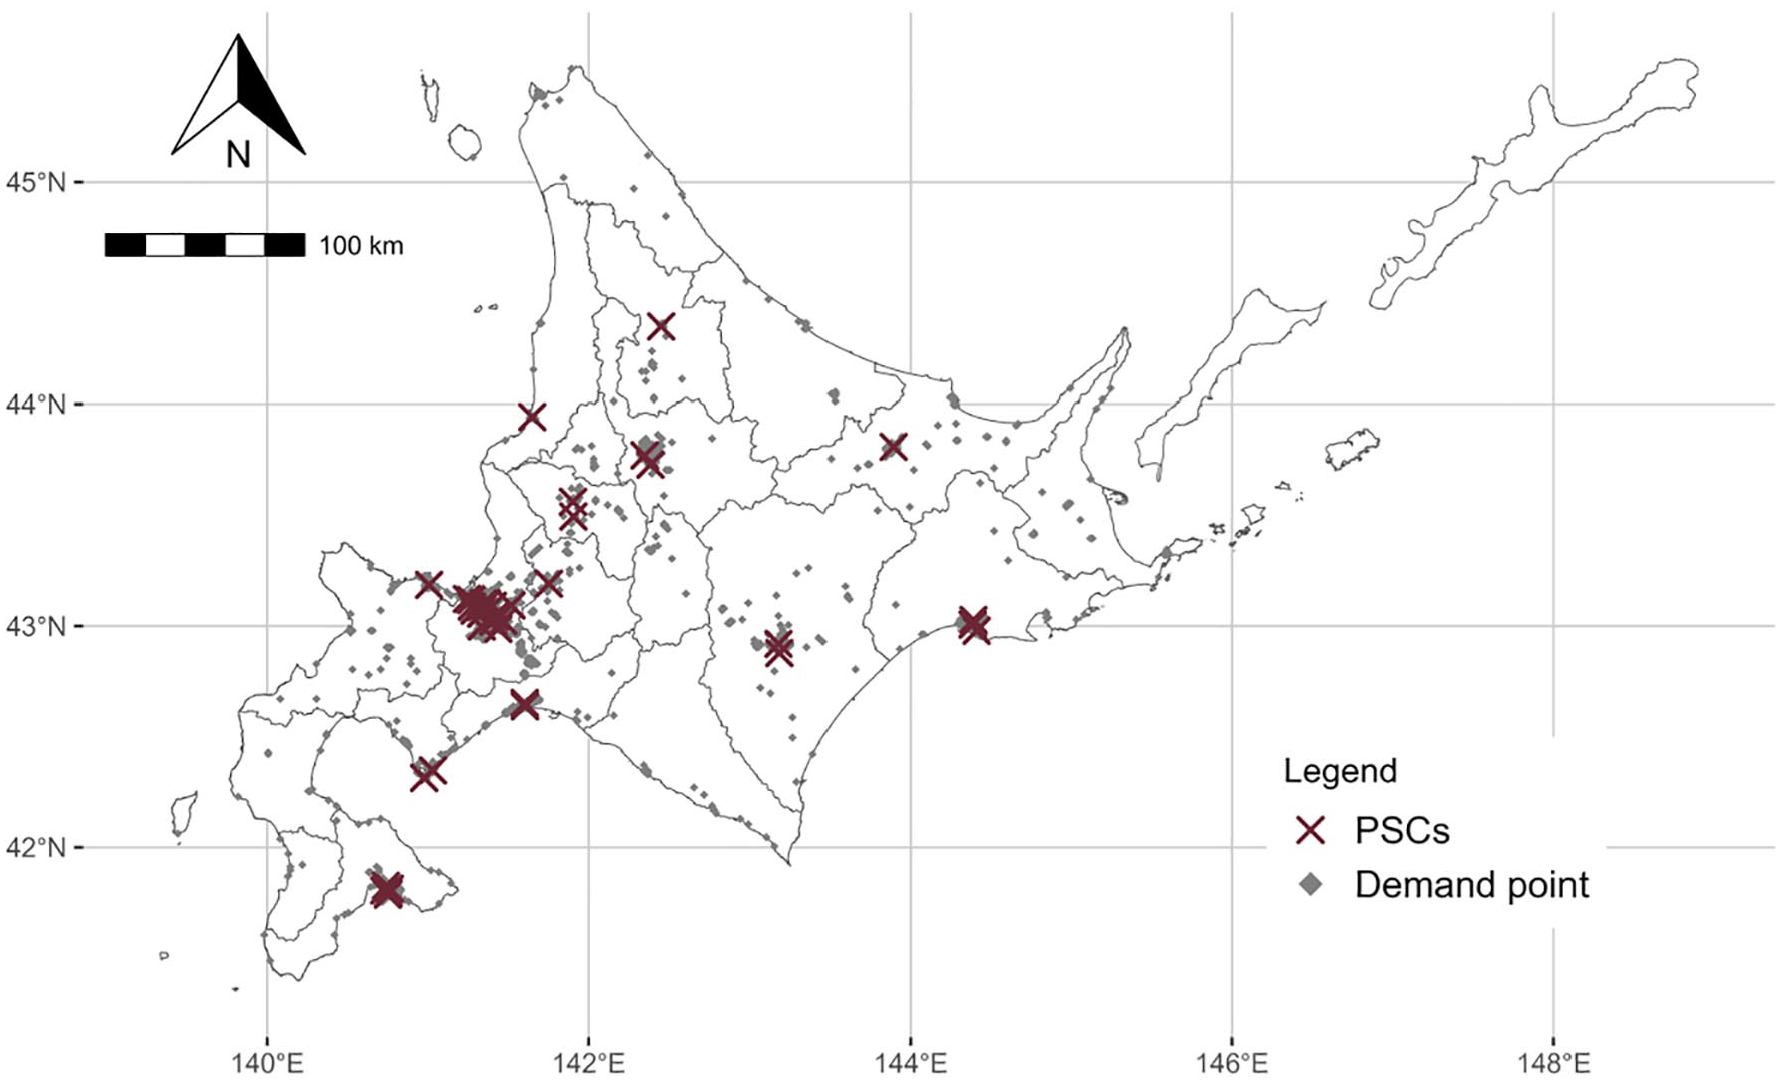
This shows the location of PSCs and demand point.
Data source
Data on PSCs and neurointerventionalists were obtained from the websites of the Japan Stroke Association 30 and the Japanese Society for Endovascular Therapy. 31 Data on secondary medical regions, mesh data, and population were obtained from the National Land Information Download Service 32 ; land area (km2) was obtained from Population Census 33 ; and road network data were obtained using ArcGIS Geo Suite Douromo 2021 (Esri Japan, Inc., and Sumitomo Electric Industries, Ltd., Japan).
Results
Description of SMAs
Table 2 describes the statistics for the 21 SMAs in Hokkaido. There are large differences in population density between SMAs (Figure 1), and some SMAs do not have an MT-capable PSC or PSC core. There was no PSC core in the three-quarter SMA (Table 2).
Description of 21 SMAs in Hokkaido.

SD, standard deviation.
IQR, interquartile range.
PSC, primary stroke center.
MT, mechanical thrombectomy.
Evaluation of demand coverage
In Scenario 1, 760 points (per 1445 points) were covered by the MT-capable PSC or PSC core, and 685 points were not covered; the coverage was 52.6%. In Scenarios 2 to 4, the coverage increased as the total supply increased, with Scenario 4 having the highest coverage (84.6%). Scenario 4 was the most oversupplied, with a demand point-to-supply ratio of 81.0% (Table 3). Figure 3 shows the distribution of coverage (%) at 21 SMAs in the 4 scenarios. Hidaka, Kamikawa-Hokubu, Rumoi, Soya, Enmon, and Nemuro had low coverage in all the scenarios. In particular, coverage increased in Minami-Hiyama, Kita-Oshimahiyama, Shiribeshi, Naka-Sorachi, and Minami-Sorachi by increasing the total supply (scenarios 1-4).
Results of the CMCLP for each scenario.

PSC, primary stroke center.
MT, mechanical thrombectomy.

This shows the distribution of demand coverage for each secondary medical area in scenarios 1 to 4 (S1-S4). Higher coverage is shown in bright color and lower coverage is shown in dark color.
Next, we identified areas and facilities with increased supply capacity as a priority. The 685 demand points not covered in Scenario 1 were assigned to 29 PSCs (excluding the PSC core) (Figure 4). This analysis sets no capacity limits for each facility. Consequently, 617 (per 685) new patches were covered, and 8 PSCs, which were located in Sapporo (n = 2), Kamikawa-Chubu (n = 2), Shiribeshi (n = 1), Minami-Sorachi (n = 1), Hokumo (n = 1), and Tokachi (n = 1), covered >31 demands. Sixty-eight points were not included in any of the analyses. These points were in Nemuro (n = 21), Soya (n = 16), Hidaka (n = 9), Enmon (n = 5), Shiribeshi (n = 4), Hokumo (n = 4), Kita-Oshimahiyama (n = 3), Minami-Oshima (n = 2), Minami-Hiyama (n = 2), Tokachi (n = 1), and Kushiro (n = 1).

This shows the newly covered points and the demands on PSCs at scenario 1. The circles are the locations of the 29 PSCs, and the size is divided in 2 by the number of newly covered points not covered in scenario 1. Colored squares, circles, and triangles indicate not-covered points (n = 68), originally covered points (n = 760), and newly covered points (n = 617), respectively.
Discussion
This study simulated the supply capacity of PSCs for MT in 4 realistic scenarios with the aim of evaluating the supply and demand balance of MT in Hokkaido. The demand coverage (within 90 minutes) was approximately 53% to 85%, considering the supply and demand balance. Noncovered points emerged in Soya, Nemuro, and Hidaka. Furthermore, we identified PSCs that cover many demand points by removing the supply capacity cap. Enhancing the capacity of PSCs in the area identified here and upgrading the PSC core are the first strategies available for enhancing access to MT. Our findings identified 8 facilities and 6 SMAs for enhancing the capacity for MT supply. However, since Sapporo already has many PSCs, discussions should be held in conjunction with the consolidation and integration of facilities. Therefore, the other 5 SMAs are priority areas. When comparing the actual number of MT implementations with our model, there were 816 MT cases in Hokkaido (from April 2021 to March 2022), 8 which is not more than the number of cases in scenarios 2 to 4 (more than 1000 cases). The simulations in this study may have overestimated demand, or it is possible that some patients are missing the opportunity to receive MT. In the latter case, our proposal enhances the likelihood of receiving MT.
The JSA declared the achievement of equalization with the development of facilities capable of MT and a population coverage of approximately 93% for access to MT within 60 minutes by emergency transport. 17 According to the findings of previous studies conducted in other countries, more than 87% of the U.S. population is estimated to have access to a CSC, TSC, or PSC within 60 minutes by car, and the stroke treatment system is well developed. 34 Both employed a 60-minute coverage area without considering supply capacity; thus, actual accessibility may decrease when considering the supply and demand balance. In contrast, this study used a 90-minute coverage area and considered the facility’s capacity. Even in the best scenario, the maximum demand coverage was approximately 85%. Thus, the current location of PSCs cannot cover areas with overwhelmingly poor access. To cover these areas, the placement of new PSCs capable of MT, introduction of flying intervention teams, 35 and transportation methods by air ambulance are needed. Comparing scenarios 1 to 4, scenario 4 achieved the highest demand coverage, while scenarios 2 and 3 were more efficient. Strengthening the MT-capable PSC rather than the current PSC core will cover more demand points with a small capacity increase owing to greater geographic variation. The challenge in improving access to MT is upgrading the MT-capable PSC to a PSC core rather than further enhancing the PSC core. From a staffing perspective, efficiency is an important factor. The Japanese government will enforce the Workstyle Reform for Doctors from April 1, 2024. 36 The hospital limits a physician’s overtime work to 960 hours per year (and <100 hours per month). Thus, there is concern about the shortage of physicians in emergency medicine. This means that the medical system should be managed while avoiding shortages and surpluses of physicians. Comparing Scenarios 2 and 3, the results are almost identical. In other words, if a small number of facilities are to be enhanced on a large scale, Scenario 2 is suggested. Our findings and methods contribute to the management of the medical system. From another perspective, there are growing expectations that technological innovation and harmonization with the health care delivery system will improve the quality and efficiency of health care services. A prehospital diagnostic system based on artificial intelligence is expected to increase productivity without increasing the health workforce. 37
Patients in need of specialized care were diagnosed before they reached the hospital and were transported to the appropriate hospital. Furthermore, with the advancement of information and communication technology, remote endovascular procedures and diagnosis have the potential to eliminate geographic barriers for specialists. 38 In the future, when new technologies are introduced, new standards should be used to consider the optimal allocation of medical resources.
This study used the CMCLP to evaluate population coverage, considering the supply and demand balance to improve demand coverage by reallocating healthcare resources. Several methods have been proposed for the location-allocation model of healthcare, including minimizing travel time and the distance between demand points and facilities and maximizing coverage demand. 19 The advantage of the CMCLP over the traditional MCLP is that it has limited capacity. Achieving high population coverage is the first goal in health policy; however, the next step is to build and manage better health systems within the constraints of personnel and finance. In this study, to consider personnel and finance constraints, the location of the facility was fixed, and only the supply capacity was changed in the simulation. It is a realistic model that can estimate the number of physicians and treatment units that contribute to the increase in population coverage without changing the current PSC location. To the best of our knowledge, this realistic medical resource allocation model has been proposed for the first time in the context of stroke care systems. It contributes to the formulation of medical policies that balance efficiency and equity during phases of population decline. In addition, lower middle-income countries face poor access to stroke care due to shortages of specialists and medical resources and limited financial resources.39,40 Increasing the accessibility of medical services without increasing the number of facilities is reasonable. Our findings are applicable to countries with different backgrounds.
Limitations
This study has several limitations. First, transportation was limited to the ground level, and air ambulances were not considered. This may have affected the outcome; however, the total number of air ambulance transportation was small. For example, in 2020, there were 1143 air ambulances transported by all causes, while 14 981 ground ambulance transportations were attributed to brain disorders.41,42 Therefore, the impact of air ambulances on the results is somewhat limited. Second, the coverage area (eg, 90 minutes), the supply capacity of PSCs and demand points were based on assumptions, not actual measurements. In the future, increasing data availability contributes to accurate model building. Third, the population data were from the census 2015; considering the population decline in Hokkaido, this study overestimated the number of demand points. This approach can be properly operationalized by using an up-to-date population distribution. Finally, this study simulated 1 year in 1 scene and did not consider the uncertainty in the number of stroke cases per day. In short, when stroke patients occur in many places at the same time or day, the medical system face a capacity constraint.
Conclusions
This study used the CMCLP to estimate demand coverage considering the supply and demand balance and indicated areas and facilities with MT supply capacity enhancement as a priority. In Hokkaido, the capacity for MT supply needs to be strengthened, especially in 5 medical regions: Kamikawa-Chubu, Shiribeshi, Minami-Sorachi, Hokumo, and Tokachi. This method is applicable to different regions and clinical areas.
Supplemental Material
sj-docx-1-his-10.1177_11786329241263699 – Supplemental material for The Capacitated Maximal Covering Location Problem Improves Access to Stroke Treatment: A Cross-Sectional Simulation Study
Supplemental material, sj-docx-1-his-10.1177_11786329241263699 for The Capacitated Maximal Covering Location Problem Improves Access to Stroke Treatment: A Cross-Sectional Simulation Study by Kyohei Bando, Kazuki Ohashi, Kensuke Fujiwara, Toshiya Osanai, Yasuhiro Morii, Takumi Tanikawa, Miki Fujimura and Katsuhiko Ogasawara in Health Services Insights
Footnotes
Acknowledgements
Funding:
The author(s) disclosed receipt of the following financial support for the research, authorship, and/or publication of this article: This work was supported by Cross-ministerial Strategic Innovation Promotion Program (SIP) on “Integrated Health Care System” Grant Number JPJ012425.
Declaration of conflicting interests:
The author(s) declared no potential conflicts of interest with respect to the research, authorship, and/or publication of this article.
Author Contributions
KB, KO, KF, TO, TT, and KO conceptualized the study design. KB handled the data. KB and KO conducted the analysis and drafted the manuscript. Kazuki O created the tables and figures. YM contributed the program code for the simulation. KO, KF, TO, YM, MF, and KO revised the draft. All the authors have read and approved the final manuscript.
Ethics Approval and Consent to Participate
This study did not involve human participants. No personal information was included, and only publicly available data were used. Consequently, ethical approval was not needed, as this study was certified by the Faculty of Health Sciences Institutional Review Board, Hokkaido University.
Consent for Publication
Not applicable.
Availability of Data and Materials
The data sets generated during and analyzed during this study are available from the corresponding author upon reasonable request.
Supplemental Material
Supplemental material for this article is available online.
References
Supplementary Material
Please find the following supplemental material available below.
For Open Access articles published under a Creative Commons License, all supplemental material carries the same license as the article it is associated with.
For non-Open Access articles published, all supplemental material carries a non-exclusive license, and permission requests for re-use of supplemental material or any part of supplemental material shall be sent directly to the copyright owner as specified in the copyright notice associated with the article.