
Abstract
Diagnostic error or delay (DEOD) is common in the acute care setting and results in poor patient outcomes. Many factors contribute to DEOD, but little is known about how contributors may differ across acute care areas and professional roles. As part of a sequential exploratory mixed methods research study, we surveyed acute care clinical stakeholders about the frequency with which different factors contribute to DEOD. Survey respondents could also propose solutions in open text fields. N = 220 clinical stakeholders completed the survey. Care Team Interactions, Systems and Process, Patient, Provider, and Cognitive factors were perceived to contribute to DEOD with similar frequency. Organization and Infrastructure factors were perceived to contribute to DEOD significantly less often. Responses did not vary across acute care setting. Physicians perceived Cognitive factors to contribute to DEOD more frequently compared to those in other roles. Commonly proposed solutions included: technological solutions, organization level fixes, ensuring staff know and are encouraged to work to the full scope of their role, and cultivating a culture of collaboration and respect. Multiple factors contribute to DEOD with similar frequency across acute care areas, suggesting the need for a multi-pronged approach that can be applied across acute care areas.
Background
Medical error is a serious and widespread issue, with some estimating it to be the third greatest cause of mortality in the United States. 1 Diagnostic error or delay (DEOD) is a form of medical error that has been slower to receive attention. However, it must be prioritized given advancements in technology that make detecting such errors more feasible and advancements in medicine that make it even more important to arrive at the correct diagnosis in a timely manner, from both a patient outcomes and financial perspective. 2
DEOD has been operationalized in different ways, but the Committee on Diagnostic Error in Health Care defined it as either a lack of timely and accurate identification of the source of the problem or a breakdown in sharing this with the patient; this excludes overdiagnosis. 3 As interest in this area has increased, studies have used various methods to better understand the prevalence and sources of DEOD. These methods include experimental simulations 4 ; reviewing charts, 5 patient and family medical complaints, 6 and malpractice claims7,8; dashboards for proactive identification 9 ; physician surveys10-12 or self-report 13 ; and a combined approach of observation and focus groups and interviews. 14 However, the precise rate of diagnostic error remains difficult to determine due to differences in methods used and how diagnostic error is defined.15,16
When aggregating diagnostic error rate data from the literature for 15 conditions for which diagnostic error is common, researchers reported an average error rate of 9.7%. 16 However, there is evidence that rates of diagnostic error vary by hospital setting. Evaluation of large malpractice claims database found the 16% of diagnostic errors identified occurred in the Emergency Department and 26% occurred in the hospital. 8 Furthermore, rates of diagnostic error have been found to be 5.6% in a hospital medicine sample, 17 7% in an ICU sample, 18 and 12.3% in a Swiss emergency room. 19 Regardless of the precise rate of DEOD, there is ample evidence that diagnostic error is an important and potentially deadly problem.3,20
Clinicians and researchers are working toward identifying sources of diagnostic error in relation to different parts of the diagnostic process. 3 The Diagnostic Error Evaluation and Research (DEER) taxonomy considers failure that can occur during “(1) access and presentation, (2) history taking/collection, (3) the physical exam, (4) testing, (5) assessment, (6) referral, and (7) followup” (p. 255). 21 This approach has been used to analyze physician reported instances of errors, revealing that errors most frequently occurred during testing or assessment, and that almost one-third of cases had two process errors, with certain errors tending to occur together. 10
Similarly, the Safer Dx framework places patients as central in the diagnostic processes involving initial encounters, information interpretation, follow-up, consultation, and adherence as process dimensions within the larger sociotechnical system in which diagnostic error can occur.22,23 A study using the process dimensions to identify sources of diagnostic error found that elements of the patient-practitioner encounter were the most frequent source of error and multiple sources of error were present for just under half of cases. 24 Another study identified multiple sources of error in almost three-quarters of cases. 25 The Safer Dx framework and DEER taxonomy have also been used in conjunction with each other to identify diagnostic errors and their source. 18 Common contributors to diagnostic errors were overemphasis on the incorrect diagnosis, delayed or insufficient attention to the correct diagnosis, and improperly considering history. 18
Research also suggests that multiple factors are responsible for DEOD in acute care areas.7,26 However, it is not well understood whether certain factors contribute to DEOD more frequently in some acute care settings (eg, the Emergency Department, Intensive Care Units, inpatient hospital floors) compared to others. For instance, research suggests cognitive factors may most frequently play a part in missed diagnoses in the Emergency Department, 7 but it is not well understood to what extent these findings are representative of the diagnostic challenges faced by other acute care areas. 27 Thus, while multiple potential sources of diagnostic error have been identified, less is known about how these compare across different acute care settings and whether the sources of error vary across professional role.
Identifying the most frequent sources of error in different acute care areas and for those in different professional roles may be crucial for developing tailored intervention efforts, when multiple factors may be present, 28 but resources are limited. Moreover, asking providers themselves to reveal potential sources of diagnostic errors may provide crucial insight12,28 that is absent from charts and other more traditional retrospective methods. Although asking participant to self-report may lack some objectivity, alternative methods for addressing this question, such as having two reviewers classify sources of error may introduce the reviewers’ biases (eg, one of the aforementioned studies had a kappa of .58 for reviewers’ categorization of the source of provider reported diagnostic errors. 10 )
To address this gap in the literature, our research team sought to understand the breadth of factors relevant to DEOD identified by clinical stakeholders from different acute care areas as Phase 1 26 of this study. We built upon that effort for this current Phase 2 by exploring the frequency with which each of the factors identified in Phase 1 26 were perceived to contribute to DEOD by those in different acute care areas and clinical roles. Thus, Phase 2 was conducted to determine which of the many sources of DEOD identified in Phase 1 should be addressed first because of their frequency of occurrence, and whether interventions should be tailored to different roles and acute care areas due to differences in the most frequent contributors to DEOD. The present manuscript describes our findings from Phase 2.
Methods
Study design
Our group adopted a systems engineering approach (SEIPS) 29 to understand and study work conditions that may lead to diagnostic error. According to the SEIPS framework, errors are thought to increase as conditions become more unfavorable, so it is important to study socio-technical working conditions and environments and their impact on work as opposed to focusing on the individual absent the environment. 29 Using this approach, we conducted a sequential exploratory mixed methods study. In Phase 1 26 of this research, we identified acute care providers’ perceptions of all sources of diagnostic error or delay by conducting 11 focus groups with Intensive Care Unit, hospital inpatient floor, and Emergency Department nurses, physicians, and advanced practice providers across a healthcare system. We used the SEIPS framework to help develop and organize questions for the moderator guide and asked participants about factors that impacted making a diagnosis including when persons (eg, patients, providers) interact with tools and technology (eg, electronic medical records), tasks, and the internal environment (eg, protocols, policies, organizational matters) (See Barwise et al 26 for additional details about the content of the focus groups.) For Phase 2, we developed a survey instrument to evaluate the frequency with which different factors contribute to diagnostic error or delay by grouping the sources of DEOD identified in Phase 1 26 into similar ideas and themes. We next translated the ideas into statements that would be conducive to survey-based rating and removed duplicative or conceptually similar statements. We developed and refined multiple iterations of the survey internally as a team and subsequently pre-tested the survey in paper and electronic formats with a small sample of acute care providers. We finalized the survey once no substantial content-related recommendations for improvement were suggested. All study materials and procedures were approved by the Mayo Clinic Institutional Review Board (#18-007115).
The final version of the survey (Supplemental Figure S1) consisted of 29 factors organized into 6 conceptually similar groups: (1) “Organization and Infrastructure,” which addresses availability of resources (eg, limited availability of diagnostic tests, limits in institutional capacity); (2) “System and Process,” which addresses breakdown in care processes (eg, delays in lab results, difficulties obtaining outside medical records); (3) “Care Team Interaction,” which addresses relational dynamics amongst multidisciplinary providers (eg, miscommunication or poor communication, poor handoffs); (4) “Provider,” which addresses characteristics of the provider (eg, physical or mental fatigue, limited clinical experience of key team members); (5) “Cognitive”; which addresses cognitive errors made by the clinician during the diagnostic process (eg, tendencies to accept diagnostic belief of colleagues, premature “narrowing in”); and (6) “Patient,” which addresses contextual factors of the patient-clinician interaction or aspects of the patient’s diagnosis that may lead to DEOD (eg, high medical complexity, a very rare, or esoteric diagnosis). The category “Patient factors” does not imply that the patient themself has a role in the error. Although factors were grouped, respondents were prompted to consider each factor individually and to rate “how often” each factor “contributes to diagnostic error or delay.” Response options were based on a 5-point Likert-type scale, ranging from “never” to “often.” Participants could also indicate if they were “unsure.”
For each item a respondent rated as occurring “often” they were asked, “Do you believe there may be things (eg, providing training; modifying systems or processes; or developing tools, etc.) we could do to reduce the influence of this contributor?” to which they could answer either yes or no. Those who selected yes were then given the option of providing a free text response to the question, “What suggestions do you have to reduce the influence of ‘[factor]’?” All respondents were given the option to list any other contributors they felt were not assessed. Demographic data collected included clinical role (RN, physician, Nurse Practitioner/Physician Assistant (NP/PA), fellow, resident, or other), unit referencing (eg, ICU, ED, floor, other), and Mayo Clinic location. The final survey was loaded into a REDCap30,31 data capture tool for web-based administration.
Setting
The survey was administered to staff at a large academic medical institution that is part of a health system enterprise consisting of geographically diverse sites across the United States. Due to the strain of the COVID-19 pandemic, we only recruited staff from the largest site located in Rochester, Minnesota. This site consists of 2 hospital campuses with roughly 2000 hospital beds, which includes 213 ICU beds.
Sample
We sampled physicians, advanced practice providers (nursing practitioners and physician assistants), and nurses in the Intensive Care units, Emergency Department, and hospitalist inpatient floor units at Mayo Clinic Rochester. We also included Emergency Medicine residents and Critical Care fellows. We targeted these groups using email-based distribution lists, which are updated automatically to account for staff turnover. A few of the distribution lists received from departmental leadership contained a small number of employees from other Mayo Clinic sites. Staff from these other clinic sites were not removed from the distribution lists, but we did not actively seek distribution lists from the other clinic sites.
Data collection
We collaborated with institutional leaders to send a recruitment email with an embedded video invitation encouraging staff to participate in an online survey they would be emailed “in the next week.” Approximately 1 week later, our team sent an email-based invitation with an anonymous survey link embedded. Respondents could only access and complete the survey when connected to the organization’s server (either on campus or via VPN). We sent a follow-up request to complete the survey via the same method ~2 weeks later for the purpose of encouraging initial non-responders to participate. The first group received the survey link on August 27, 2020, and the last group received it on September 9, 2020. Data collection was suspended for all groups on October 6, 2020. Participants did not provide written informed consent as this would potentially reveal the identity of participants. Completion of the survey was inferred as consent.
Analysis
To obtain accurate denominators of the number of staff recruited from the different areas, we exported the names and credentials of all individuals on the distribution lists into Excel files and removed duplicates at the time of survey administration. This excel file was not linked to the survey data, preserving anonymity of responders. Survey respondents were asked to self-report their unit and role as part of the survey so that we could calculate the number of respondents from each role and area.
All responses were automatically recorded in a secure REDCap database30,31 for exportation and analysis. The 29 items were partitioned into 6 thematic groups, specified a priori: Organization and Infrastructure, Care Team Interaction, Systems and Process, Patient, Provider, and Cognitive factors. For each thematic group, we calculated the percentage of respondents that indicated the thematic group contributes to DEOD never, rarely, occasionally, sometimes, and often by averaging the responses provided for all items belonging to the same thematic group. Those who indicated they were “unsure” were included in the denominator of total responses to calculate the percentage of responses endorsing each of the 5 frequencies of occurrence.
For each of the 29 items, Likert scale responses were translated to numeric scores. A summary score was created for each group of items by computing the average numeric score for all items belonging to the same group. Repeated Measures Analysis of Variance (RM-ANOVA) assessed whether summary scores for the 6 groups differed. When evidence (at level .05) of differences existed, we conducted all pairwise comparisons between the groups to evaluate if any of the individual comparisons were significant. A Bonferroni adjustment was used to adjust for the multiplicity of these pairwise comparisons and suggested that for all pairwise comparisons, statistical significance would be defined by P-values less than α = .0033 (.05/15, for 15 pairwise comparisons).
Separate analyses sought to assess differences in group summary scores by unit/area (ICU, ED, Floor, and Other) and by role (Attending physician, NP/PA, Nurse, Fellow physician, Resident physician, and Other). For a given group, differences by unit/area and role were assessed with Kruskal-Wallis tests. A Bonferroni adjustment was also applied to the 6 factors assessed; statistical significance was defined by P-values less than α = .0083 (.05/6).
Data management and analysis were performed in SAS Studio 3.8. 32 Power calculations were performed in PASS 2021 Power Analysis and Sample Size Software. 33
Results
Respondent characteristics
We emailed the survey link to 1651 individuals and obtained responses from N = 220 (13.3%)—response rate varied by professional role (see Table 1). A small number of employees from other Mayo Clinic locations (included in the distribution lists) completed the survey (n = 3 from Mayo Clinic Health System ED, n = 1 Mayo Clinic Health System floors, n = 1 reported their location as other). Their responses were included in the analyses.
Respondent role and acute care location (N = 220). a .
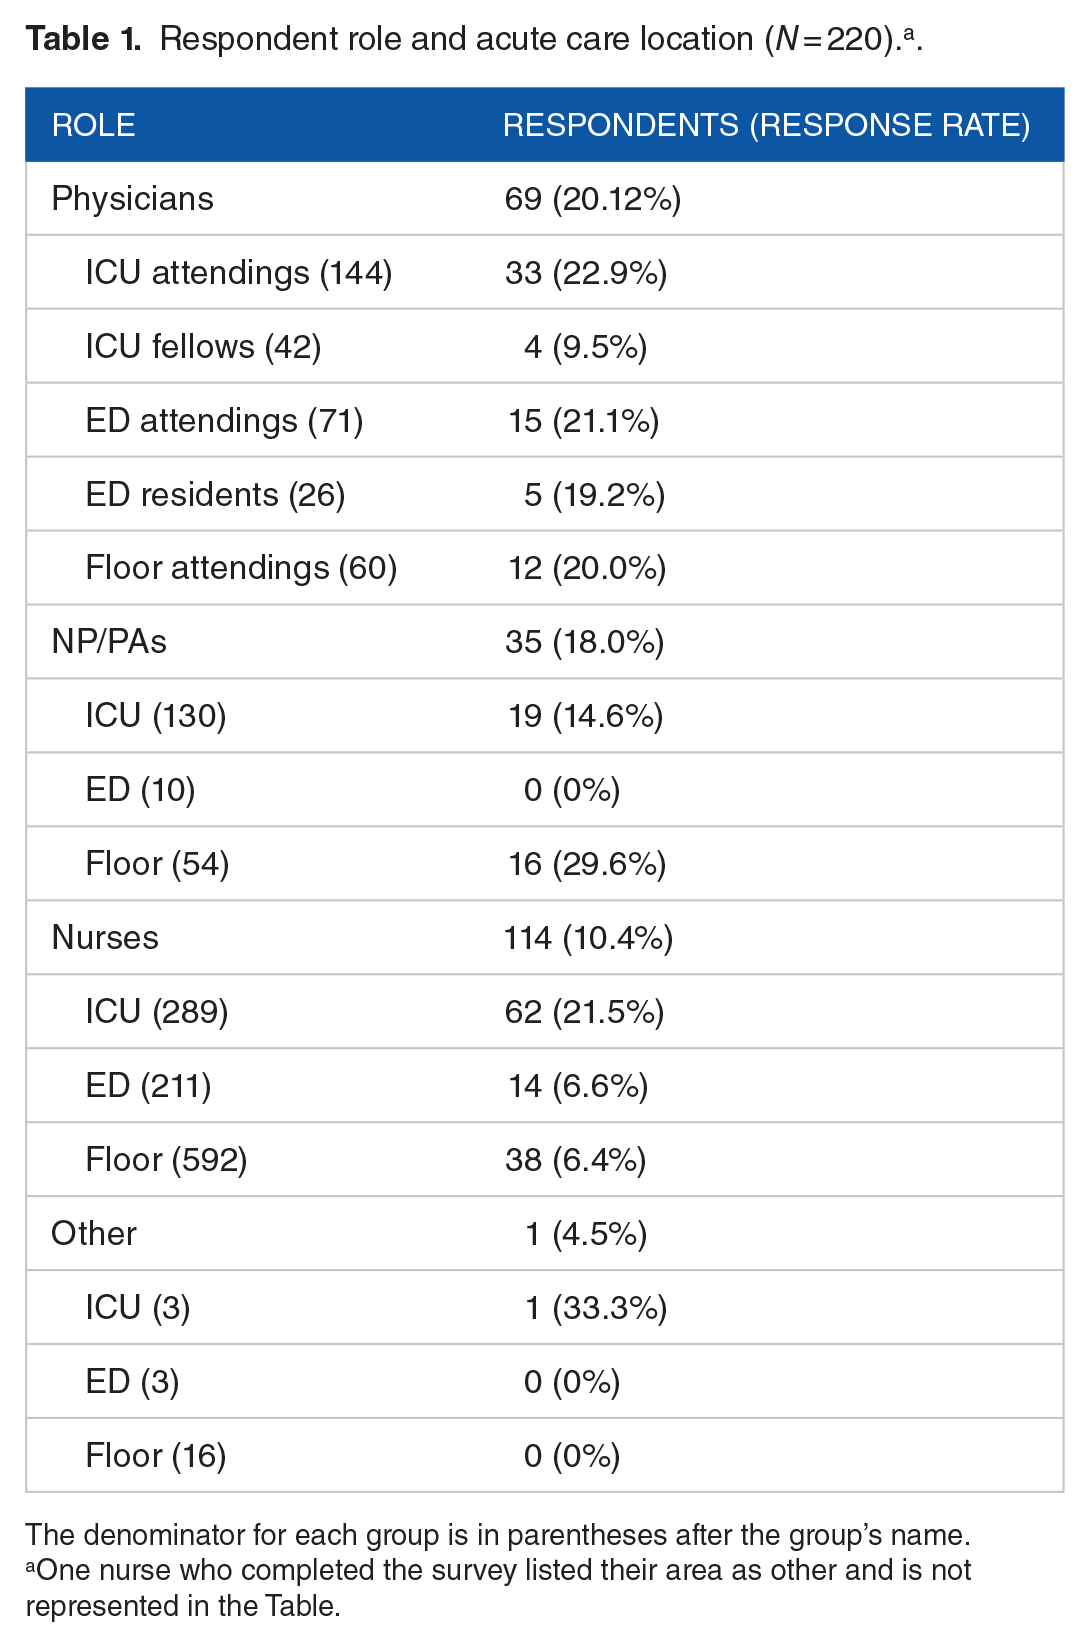
The denominator for each group is in parentheses after the group’s name.
One nurse who completed the survey listed their area as other and is not represented in the Table.
Perceived frequency of contributors to DEOD
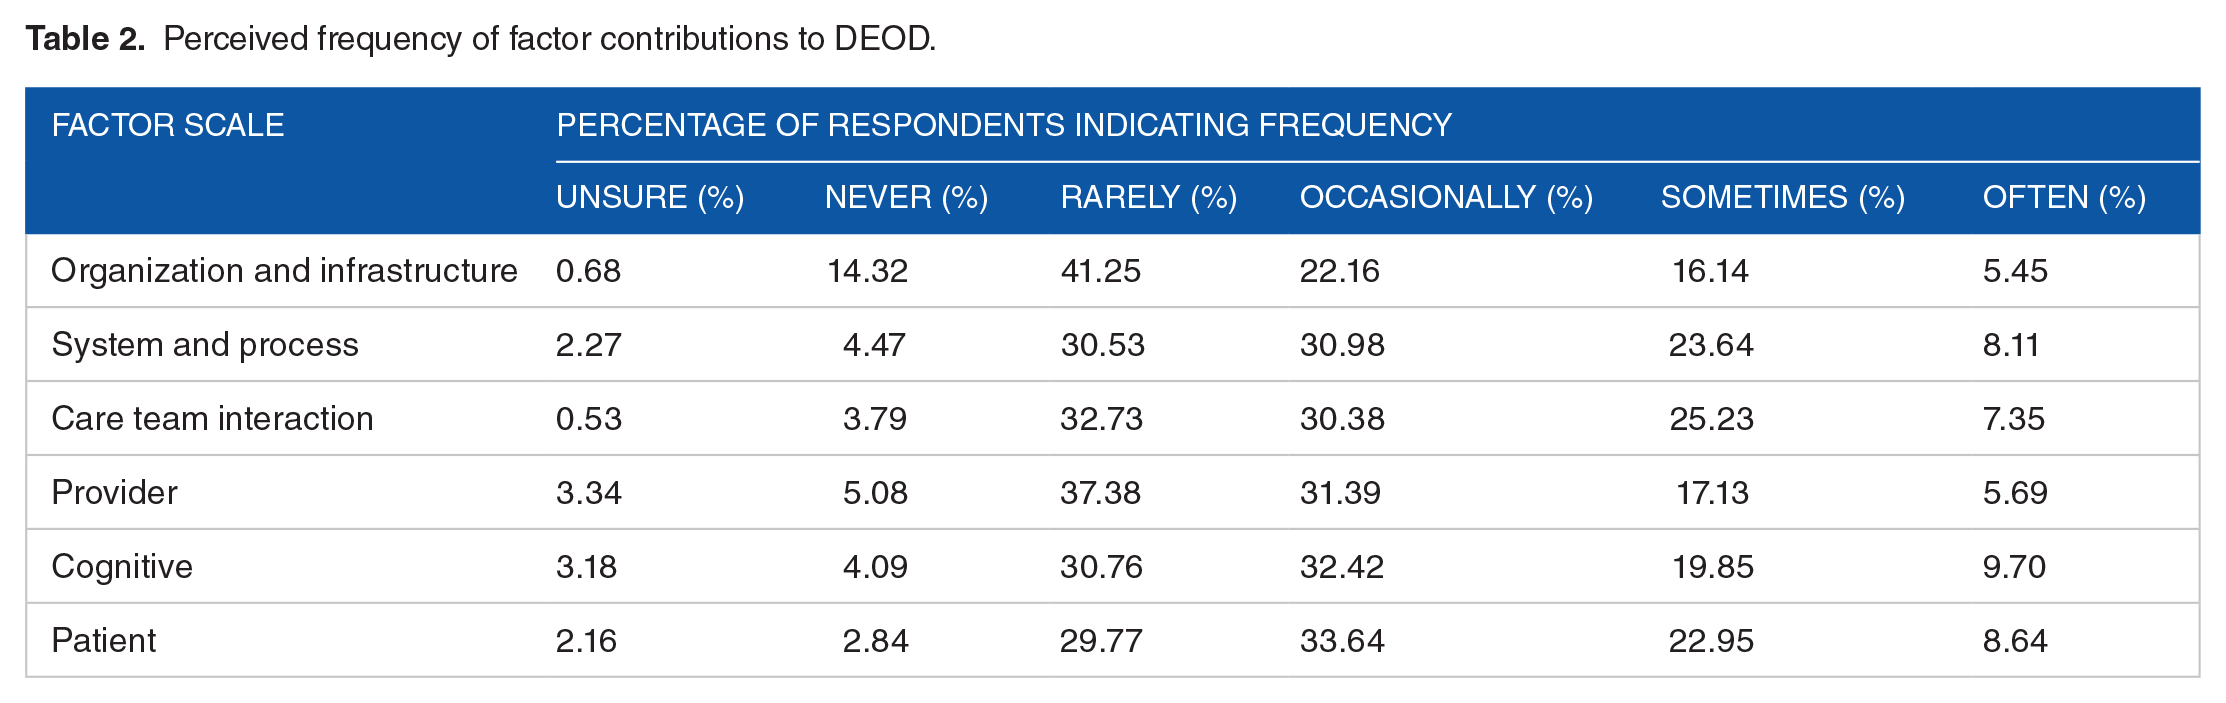
Care Team Interaction factors, System and Process factors, and Patient factors were perceived to contribute to DEOD with similar frequency. These 3 factors were perceived to contribute to DEOD sometimes or often by 32.6%, 31.8%, and 31.6% of respondents respectively. Organization and Infrastructure factors and Provider factors received less endorsement for contributing to DEOD sometimes or often. See Table 2 for overall reported frequencies. Frequencies reported by floor are available in a Supplemental Table S2.
Perceived frequency of factor contributions to DEOD.
Pairwise comparisons
Pairwise comparisons revealed that only Organization and Infrastructure factors were perceived to contribute to DEOD significantly less often than each of the other 5 factors. See Table 3. Further, inpatient settings did not differ in their perceptions of the frequency with which the 6 factors contributed to DEOD (see Supplemental Table S3).
Comparative importance with which factors contributed to DEOD.

Bonferroni adjusted P value of P < .003.
To determine whether we had a sufficient sample size to detect differences between roles, we conducted a post-hoc power analysis comparing role groups. Group sample sizes of 114 (nurses) and 60 (attending physicians) would achieve 90% power to reject the null hypothesis of equal means when the population mean difference is .52 with alpha of .05, with a 2-sample t-test (2-sided). Similarly, with the same power and alpha levels, group sample sizes of 114 (nurses) and 35 (NPPAs) can detect a mean difference of .64 or more, and group sample sizes of 60 (attending physicians) and 35 (NP/PAs) can detect a mean difference of .70 or more. Exploration of differences by role revealed that only the frequency with which Cognitive factors were perceived to contribute to DEOD varied by role (M = 2.7 for fellows, M = 2.7 for other, M = 2.5 for attending physicians, M = 2.5 for residents, M = 2.1 for nurses, and M = 2.0 for NP/PA’s) (see Supplemental Table S3).
To determine whether we had sufficient sample size to detect differences between hospital area, we conducted a post-hoc power analysis comparing acute care sites. Group sample sizes of 119 (ICU) and 66 (floor) would achieve 90% power to reject the null hypothesis of equal means when the population mean difference is .50 with alpha of .05, with a 2-sample t-test (2-sided). Similarly, with the same power and alpha levels, group sample sizes of 119 (ICU) and 34 (ED) can detect a mean difference of .63 or more, and group sample sizes of 66 (floor) and 34 (ED) can detect a mean difference of .69 or more. Inpatient settings (eg, ED, inpatient floors, and ICU) did not differ in their perceptions of the frequency with which the 6 factors contributed to DEOD (see Supplemental Table S4).
Open ended text analysis
Because the quantitative findings revealed that System and Process, Care Team Interaction, Provider, Cognitive, and Patients Factors were reported to contribute to DEOD with similar frequency, we explored the open-ended responses provided by those who suggested solutions for items that comprised each of these 5 factors. Each participant could provide open-ended responses for each item they indicated as contributing to diagnostic error or delay “often,” which produced 223 open-ended responses for analysis.
Once we had identified key types of proposed solutions for each factor, we explored the types of solutions that were proposed across multiple factors. Two researchers independently reviewed the key solutions proposed across factors to look for commonalities and met to discuss the final overarching types of solutions they each identified. Through collaborative discussion, the researchers reached an agreement that the following 4 categories best exemplified the proposed solutions: (1) technological solutions (eg, “Easier to graph different items at the same time. . .,” “texting options like secure chat”); (2) organization-level fixes, such as staffing (eg, “Improve staffing, change the way day/night staff are scheduled so they have a more consistent day-night routine”), providing staff education, role designation, and task allocation (eg, “. . .One service should place orders.”); (3) ensuring staff know their role and are allowed, trusted, and expected to work to the full scope of it (eg, “. . .there is a general lack of accountability that would be improved by everyone knowing the roles and being expected to work to their full scope. . .”); and (4) cultivating a culture of collaboration and respect (eg, “improve face to face communication: talking through notes is bad,” “Nursing involvement in rounds,” “everyone gets a chance to talk. . .”). See Table 4 for additional examples of each category of solution.
Examples of the key types of solutions proposed.

IPASS stands for illness severity, patient summary, action list, situational awareness and contingency planning, and synthesis by receiver. It provides a structured way of doing handoffs. 34
Discussion
The present study was Phase 2 of a sequential mixed-methods study designed to identify which of the contributors to DEOD identified in Phase 1 26 were perceived to most frequently contribute to DEOD across acute care settings and clinical roles. Our survey revealed that System and Process, Care Team Interaction, Provider, Cognitive, and Patient factors were perceived to contribute to DEOD with similar frequency, while Organization and Infrastructure factors were perceived to contribute to DEOD significantly less often. There were no differences across acute care areas. Our findings are consistent with past research suggesting multiple factors often contribute to DEOD,7,18,24 and revealed that work processes (the interaction between different organization components as described by the SEIPS 2 model 29 ) were perceived as more important sources of DEOD than organization and infrastructure. This aligns with past research using the DEER taxonomy that emphasizes the importance of considering sources of error within the diagnostic process.10,17,18,21 Our findings also suggest that addressing organizational and infrastructural factors may be less productive in reducing diagnostic error or delay given their smaller role, but it is unclear to what extent this finding applies to settings outside of the well-resourced, academic medical center in which this survey was conducted.
There was generally agreement across clinical roles on the most frequent sources of DEOD. However, physicians perceived cognitive factors to more frequently contribute to DEOD than those in other roles. This may reflect that making a diagnosis or determining treatment has traditionally been viewed as a physician level task. 35 This aligns with other research in which cognitive errors were most often identified as a source of missed diagnosis in the Emergency Department when exploring cases that mostly involved MDs (only 10% of the cases reviewed involved nurses). 7 However, although physicians perceived cognitive errors to contribute to DEOD more frequently than those in other roles, it is important to note that cognitive errors were perceived to contribute to DEOD with similar frequency as system and process, care team and process, and patient factors in alignment with situated cognition theory, which suggests clinical decisions are not made as isolated thoughts but are impacted by different aspects of the environment. 36
Our findings reinforce that preventing and reducing DEOD will require targeting multiple sources8,25 and participants’ open-ended responses offer insights into a potential multi-pronged approach. Health care organizations and unit leadership should strive to promote a culture of collaboration and respect amongst care team members that facilitates open discussion, especially across hierarchical roles, 14 and ensure all care team members know what their role is and trust and expect others to work to the full scope of it. Organizations should also ensure units and staff have the resources they need to operate effectively (eg, optimizing staff scheduling, providing staff with education on key topics). Technological solutions that refine and leverage existing technology may also be important for improving environmental factors in which decision are made. 36
Many of the aforementioned potential solutions have been previously identified and recommended by other researchers35,37,38 and the Committee on Diagnostic Error in Health Care in their 2015 report. 3 Specifically, a shift away from a physician as the primary diagnostician to a “diagnostic team” that engages individuals across roles,3,35 use of technology in a way that helps instead of hinders diagnosis,3,37 providing proper education, 3 and giving attention to staffing3,38 have all been mentioned as potential ways of reducing diagnostic error. This adds further credibility to our findings and suggests the next step may be preliminary testing and evaluation of some of these solutions.
Implementing these types of solutions will require action at both the organizational and individual level13,39 due to the interconnectedness of various contributors to DEOD. For instance, improved staffing may provide care team members with more time for collaboration and open communication, but care team members will need to actively adopt a more collaborative approach and physician buy-in may be particularly important. Many of the open-ended responses we reviewed suggested nurses should be included more in the patient’s care plan and a need for more openness to their concerns. Evidence suggests that physicians may perceive greater physician-nurse teamwork than nurses for similar interactions, 38 and nurses may take passive, carefully considered approaches when highlighting physician errors. 40 Thus, making staff aware of perceived interpersonal barriers may be important. This finding also underscores the importance of eliciting feedback from those in different roles who may perceive interpersonal dynamics differently.
Strengths and Limitations
The present study sought to understand the diverse causes of DEOD using the SEIPS framework to guide a rigorous approach of qualitatively identifying all potential causes of DEOD (Phase 1), 26 followed by a survey to determine the frequency with which each source of error identified in Phase 1 contributes to DEOD (Phase 2). We surveyed acute care providers across roles and settings to determine whether frequent causes of DEOD differ by acute care area and clinical role with implications for whether interventions need to be tailored accordingly. As part of the survey, many respondents also offered open-ended solutions for addressing what they perceived to be frequent contributors to DEOD. This approach represents both a strength and limitation. Asking participants to reflect on potential frequent sources of DEOD gives diverse providers an opportunity to share why they think diagnostic errors occur instead of leaving this interpretation to a small number of reviewers.10,18,25 However, providers themselves may oftentimes not be aware a DEOD has occurred. 41 Thus, the strength of our findings comes from incorporating providers’ perspective into the existing robust body of research in this area to provide an additional perspective on sources of DEOD across settings and roles.
The diversity of stakeholders surveyed increases our confidence in the applicability of our findings; however different roles were not equally represented in the responses. Only a small number of residents and fellows completed the survey, so it is unclear to what extent our findings apply to physician learners; therefore, the results should be interpreted with caution when extrapolating to other residents and fellows. Furthermore, nurses’ low response rate might reflect that the survey link could only be opened over the health system’s virtual private network (VPN) because nurses may be less likely to use VPN access outside of the hospital compared to their physician and NP/PA colleagues. Thus, nurses may have only been able to complete the survey during their clinical work hours when they had competing clinical demands. Furthermore, the modest response rate overall may reflect that the survey was administered during a time of heightened clinical burden due to the COVID-19 pandemic. Thus, it is unclear to what extent participants’ responses were representative of their colleagues or impacted by the pandemic environment.
Due to the anonymous nature of the survey, we were not able to compare characteristics of those who responded to those who chose not to. As a result, it is unclear to what extent the findings may be skewed by non-response bias; a concern previously raised by survey research on medical error. 38 We had initially intended to conduct the survey among care team members from sites across the healthcare enterprise; however, the strain that the COVID-19 pandemic placed on acute care capacity and the workforce and acute COVID-19 surges occurring at some sites impacted research capabilities generally and our ability to conduct the survey as originally planned. Thus, our recruitment efforts were limited to 1 site. As a result, it is unclear to what extent the present findings can be generalized to other sites. Specific characteristics of the healthcare system capacity, resources, processes, practices, and procedures may limit generalizability to other institutions.
Implications and Future Directions
Our findings echo the importance of a multi-component approach to reduce DEOD and offer 4 types of potential solutions that may help. It is unclear to what extent these potential solutions may be universal or specific to the site in which this research was conducted. However, we have some confidence in their applicability given their alignment with previous suggestions.35,37,42 They also may offer others’ ideas about different types of solutions they could test in their own setting, particularly if a site has only tried to address certain contributors to DEOD. Nonetheless, others will need to evaluate the applicability of the sources of DEOD and potential solutions we identified in their own setting. Additionally, our findings highlight the importance of eliciting open-ended feedback to help identify possible solutions to clinical problems, which can elucidate key areas where reform is needed and reveal needs that may not be apparent from survey items alone (eg, more receptivity to nurses’ concerns).
Conclusions
To identify the importance of different contributors to DEOD in the acute care setting, we surveyed acute care providers across areas and roles. Acute care providers reported that Care Team Interaction, Systems and Process, Patient, Provider, and Cognitive Factors similarly contribute to DEOD. This finding held true across clinical care settings (inpatient floors, ICU, and ED). Moreover, only Cognitive factors were perceived to contribute to DEOD at different frequencies across roles: physicians rated the frequency with which Cognitive factors contribute to DEOD higher than other care team members. Several of the solutions offered by care team members to address the frequent sources of DEOD could be categorized as technological solutions, organization level fixes, ensuring staff know and are encouraged to work to the full scope of their role, and cultivating a culture of collaboration and respect. Our findings suggest multiple areas for improvement to help reduce DEOD and offer starting points for future intervention.
Supplemental Material
sj-docx-1-his-10.1177_11786329221123540 – Supplemental material for Contributors to Diagnostic Error or Delay in the Acute Care Setting: A Survey of Clinical Stakeholders
Supplemental material, sj-docx-1-his-10.1177_11786329221123540 for Contributors to Diagnostic Error or Delay in the Acute Care Setting: A Survey of Clinical Stakeholders by Sarah Redmond, Amelia Barwise, Sarah Zornes, Yue Dong, Svetlana Herasevich, Yuliya Pinevich, Jalal Soleimani, Allison LeMahieu, Aaron Leppin and Brian Pickering in Health Services Insights
Supplemental Material
sj-docx-2-his-10.1177_11786329221123540 – Supplemental material for Contributors to Diagnostic Error or Delay in the Acute Care Setting: A Survey of Clinical Stakeholders
Supplemental material, sj-docx-2-his-10.1177_11786329221123540 for Contributors to Diagnostic Error or Delay in the Acute Care Setting: A Survey of Clinical Stakeholders by Sarah Redmond, Amelia Barwise, Sarah Zornes, Yue Dong, Svetlana Herasevich, Yuliya Pinevich, Jalal Soleimani, Allison LeMahieu, Aaron Leppin and Brian Pickering in Health Services Insights
Supplemental Material
sj-docx-3-his-10.1177_11786329221123540 – Supplemental material for Contributors to Diagnostic Error or Delay in the Acute Care Setting: A Survey of Clinical Stakeholders
Supplemental material, sj-docx-3-his-10.1177_11786329221123540 for Contributors to Diagnostic Error or Delay in the Acute Care Setting: A Survey of Clinical Stakeholders by Sarah Redmond, Amelia Barwise, Sarah Zornes, Yue Dong, Svetlana Herasevich, Yuliya Pinevich, Jalal Soleimani, Allison LeMahieu, Aaron Leppin and Brian Pickering in Health Services Insights
Supplemental Material
sj-docx-4-his-10.1177_11786329221123540 – Supplemental material for Contributors to Diagnostic Error or Delay in the Acute Care Setting: A Survey of Clinical Stakeholders
Supplemental material, sj-docx-4-his-10.1177_11786329221123540 for Contributors to Diagnostic Error or Delay in the Acute Care Setting: A Survey of Clinical Stakeholders by Sarah Redmond, Amelia Barwise, Sarah Zornes, Yue Dong, Svetlana Herasevich, Yuliya Pinevich, Jalal Soleimani, Allison LeMahieu, Aaron Leppin and Brian Pickering in Health Services Insights
Footnotes
Acknowledgements
Our friend and colleague, Dr. Aaron L. Leppin, made significant contributions to the study design and planning as well as the writing of this work prior to his passing on November 3, 2021 and is included as a co-author for this work. We would like to thank Dr. Lori Rhudy, PhD, RN, for advising us on the recruitment of acute care nurses. Her insights were invaluable in helping us access this population.
Funding:
The author(s) disclosed receipt of the following financial support for the research, authorship, and/or publication of this article: This study was supported by Grant Number R18HS026609 from the Agency for Healthcare Research and Quality (AHRQ) and by a Society of Critical Care Medicine (SCCM) Discovery Grant award. The funders had no role in study design, data collection and analysis, decision to publish, or preparation of the manuscript. Its contents do not necessarily represent the official views of the AHRQ or SCCM.
Declaration of Conflicting Interests:
The author(s) declared no potential conflicts of interest with respect to the research, authorship, and/or publication of this article.
Author Contributions
All authors contributed to the conceptualization of this research. BP acquired funding, and YD and JS helped with project administration. SH provided support for the online software used to administer the survey. SR, AB, AL, YD, ALM, and BP contributed to the methodology, and ALM, SR, and SZ contributed to the analysis. SR, AB, AL, SZ, and ALM prepared the original draft. All authors reviewed, edited, and approved of the final version.
Supplemental Material
Supplemental material for this article is available online.
References
Supplementary Material
Please find the following supplemental material available below.
For Open Access articles published under a Creative Commons License, all supplemental material carries the same license as the article it is associated with.
For non-Open Access articles published, all supplemental material carries a non-exclusive license, and permission requests for re-use of supplemental material or any part of supplemental material shall be sent directly to the copyright owner as specified in the copyright notice associated with the article.