
Abstract
The authors had previously demonstrated that the Japanese surgical fee schedule had been unequal among surgical specialties in spite of its biannual revisions. This study examined how the degree of inequality of the fee schedule changed by estimating Gini coefficients for efficiency scores computed from data envelopment analysis. All the surgeries at Teikyo University Hospital in 2013 to 2018 were candidates used for the analysis of efficiency and equality of fee schedule. Inputs were defined as (1) the number of assistants, and (2) the duration of operation. An output was defined as the surgical fee. Each surgeon’s efficiency score was calculated using data envelopment analysis. Using the medians of efficiency scores in each surgical specialty, the authors inferred Gini coefficients and their standard errors in each year and in each surgical fee schedule. The authors analyzed 16 307 surgical procedures during the study period of 2013 to 2018. There was no statistically significant difference in the Gini coefficients between the years and between the surgical fee schedules (P > .05). It was demonstrated that the degree of inequality of the Japanese surgical fee schedule remained constant from 2013 through 2018.
Background
Japan has been spending approximately 400 billion US dollars annually on healthcare for 126 million people for the last ten years. Its healthcare expenditure represented more than 13% of its gross domestic products in 2018. 1 Japan is also the largest economy in the world with the nation-wide controlled price system for healthcare. 2 Its fee schedule has a great impact on clinical practice of medicine throughout the country because, according to the price mechanism, the relative prices allocate resources and serve as monetary incentives for healthcare professionals, and hospitals. 3 The Japanese people have been covered by the universal health insurance for over 60 years. 4 The surgical procedures have currently been reimbursed on a fee-for-service basis in Japan. The surgeries covered and the fees set for surgery have been uniform across the nation. 4 This nation-wide uniform fee schedule has been revised biannually in the central council. In terms of the economic scale and the population size covered, it is essential to assess the equality of this fee schedule.
We previously reported 3 studies that evaluated the equality of the Japanese surgical fee schedule among surgical specialties in terms of resources utilization using data envelopment analysis (DEA).5-7 We demonstrated that the Japanese surgical fee schedule did not accurately reflect resource utilization and was unequal among surgical specialties in spite of its biannual revisions in 2014 and 2016.5-7 However, our previous studies were cross-sectional, and did not provide any longitudinal information.5-7 We do not know yet how the degree of inequality changed during the study periods.
The purpose of this study is to estimate Gini coefficients for efficiency scores computed from DEA, and to examine how the degree of inequality of surgical fee schedule changed using actual surgical data.
Methods
This study was approved both by the Teikyo University Institutional Review Board (IRB No. 12-030-3) and by the Teikyo University Committee on Conflict of Interest (TU-COI 12-201). We conducted the present research in accordance with the guidelines set by the Ethical Principles for Medical Research Involving Human Subjects in DECLARATION OF HELSINKI. The consent to participate was waived because our present study was a retrospective observational study. The need for consent was waived by the Teikyo University Institutional Review Board (IRB No. 12-030-3) as above. Since the present study is based on our 3 previous ones, we intentionally used the similar methods in data collection and analysis framework to those described in our previous ones.5-7
Data
We collected data from all the surgical procedures performed in the main operating rooms of Teikyo University Hospital from April 1 through September 30 in 2013 to 2018. Similar to our previous studies,5-7 one of the authors (Y.N.) looked up in person all the surgical procedures and extracted the necessary information from the electronic medical record system. The data extracted included surgical specialties, types of surgical procedures, start and end time of surgery, names of surgeons, number of assistants, and surgical fees that are defined as below. Our budget and time constraints prevented us from collecting 12-month data each year although we knew that it would provide more power to detect the difference. The site of this study was Teikyo University Hospital with 1152 beds that is located in metropolitan Tokyo, Japan, serving a population of ~1 000 000.
Exclusion criteria for surgery were similar to our previous studies.5-7 First, we excluded surgical procedures performed under local anesthesia by surgeons to equalize resource utilization. Second, oral, dermatologic and ophthalmic surgical procedures were excluded because most of their cases were minor surgeries performed under local anesthesia without anesthesiologists’ involvement, and those under general anesthesia do not represent the activity of their surgeons. Third, the surgical procedures were excluded if the patients die within 1 month after surgery to maintain a constant quality outcome of surgery. Fourth, the surgical procedures which were not reimbursed under the surgical fee schedule were excluded. Fifth, the surgical procedures were excluded if their records were incomplete for any reason.5-7
Measures
DEA is a methodology for quantitative assessment of efficiency that assesses multiple inputs and outputs simultaneously. Its principal methods are to evaluate outputs while controlling the amount of inputs (ie, resources), or to evaluate inputs while controlling the amount of outputs.8,9 We can evaluate the equality of the fee schedule in relation to healthcare resources utilization by comparing the efficiency scores.5-7 If the surgical fee schedule were perfectly fair and equal in relation to resources utilization for all surgeries, all surgeons would be located on the efficiency frontier, and all their efficiency scores would be one. However, no study has ever used DEA to evaluate the equality of Japanese fee schedule except our previous ones.5-7
Similar to our previous studies,5-7 output-oriented Charnes-Cooper-Rhodes model of DEA was used in this study. 10 Since the selection of inputs and outputs often drives the DEA model, it is important to develop a justification for selecting inputs and outputs. In this analysis, we focused on the surgeons’ activity and their clinical decision as we did in our previous studies.5-7 We assumed surgeons’ production function in a microeconomic model. A decision making unit (DMU) is the entity that is regarded as responsible for converting inputs into outputs in DEA. 11 We defined in this study the DMU as a surgeon with the highest academic rank that scrubbed in the surgery. We call her/ him “a senior surgeon” in this study. All the inputs and output are under the control of a DMU. Inputs were defined as (1) the number of medical doctors who assisted surgery (assistants), and (2) the time of surgical operation from skin incision to skin closure (surgical time). Assistants are considered to be a proxy variable for labor input. Surgical time represents capital input because surgeons utilize operating rooms equipped with surgical instruments and devices during surgery. Using these labor and capital inputs, senior surgeons produce surgical fees for the hospital. Therefore, we defined the output as the surgical fee for each surgery.5-7 The monetary values of surgical fees were originally expressed in Japanese yen, and were converted to US dollars at $1 = 100 yen to facilitate understanding by international readers.
Japan has maintained universal health insurance system for more than half a century. Healthcare providers are reimbursed on a fee-for-service basis according to the fee schedule that set prices uniformly at the national level. 4 This fee schedule is routinely revised every 2 years at the Central Social Insurance Medical Council to reflect macroeconomic conditions and technological advances in medicine and surgery.12-15 Our study periods represented 4 surgical fee schedules because the fee schedule was revised and implemented on April 1st of 2014, 2016, and 2018. The 4 fee schedules are 2013, 2014/2015, 2016/2017, and 2018.
We added all the inputs and outputs of the surgical procedures for each DMU during the study period in each year and in each surgical fee schedule. We then calculated her/ his efficiency scores using DEA-Solver-Pro Software (Saitech, Inc., Tokyo, Japan). 16 The efficiency scores must take a value >0 and ⩽1. The most efficient surgeons are given the score of 1. 8
All the surgeons analyzed in this study were members of one of the following ten surgical specialties; cardiovascular surgery, emergency surgery, general surgery, neurosurgery, obstetrics & gynecology, orthopedics, otolaryngology, plastic surgery, thoracic surgery, and urology.5-7
Gini coefficient
The Gini coefficient is an index for the degree of inequality in the distribution. It is extremely relevant and widely used in a number of fields of practice and research such as economics, statistics, medicine, and so on. The success of Gini coefficient depends on its ease of interpretation due to its intuitive graphical relation with Lorenz curve.17-19 The Gini coefficients all lie between 0 and 1, and the most equal distribution of efficiency scores are given the Gini coefficient of 0.
We compiled surgeons’ efficiency scores in their surgical specialties in each year and in each surgical fee schedule. We inferred Gini coefficients and their standard errors of the median efficiency scores of surgical specialties in each year and in each fee schedule using Bootstrap methods. 19
Statistical analysis
We used Stata Data Analysis and Statistical Software (Stata 14, StataCorp LP, College Station, Texas, U.S.A.) for our statistical analysis. We compared the Gini coefficients between the years and between the surgical fee schedules using the methods described by Davidson. 19 Briefly, if the independent samples are drawn from 2 populations by Bootstrap methods, they are assumed to distribute normally. Therefore, the Gini coefficients were compared by one way analysis of variance. A P-value < .05 was considered statistically significant.
Results
We analyzed 16 307 surgical procedures during the 42-month study period from 2013 through 2018. The numbers of DMUs and surgical procedures analyzed in this study were stable over the study periods (Table 1). The mean assistants per surgical procedure was 1.95, and the mean surgical time was 140 minutes. The mean surgical fee for 1 surgery was 3790 US dollars.
Demographic data.

Characteristics of the sample in each year. DMU represents a number of decision making units who are the senior surgeons.
Figure 1 showed the change in Gini coefficients by year. The line graph and its error bars represented inferred Gini coefficients and their standard errors, respectively. The Gini coefficients ranged from 0.231 to 0.312. There was no statistically significant difference between the years (P > .05).

Gini coefficients by year. Values represent inferred Gini coefficients ± standard errors. There was no statistically significant difference between the years (P > .05).
Figure 2 showed the change in Gini coefficients by surgical fee schedule. The line graph and its error bars represented inferred Gini coefficients and their standard errors, respectively. The Gini coefficients ranged from 0.235 to 0.310. There was no statistically significant difference between the surgical fee schedules (P > .05).
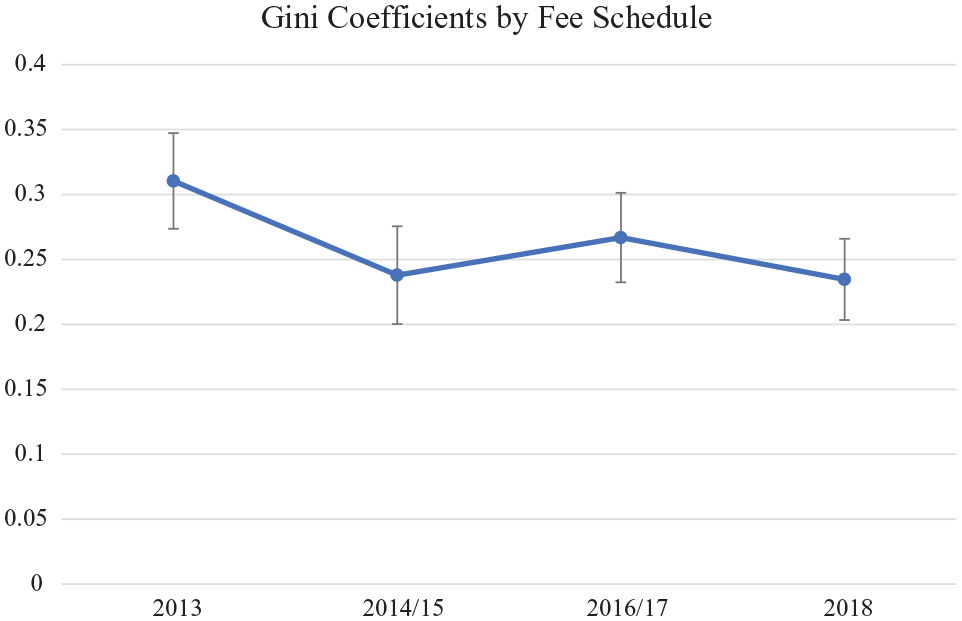
Gini coefficients by surgical fee schedule. Values represent inferred Gini coefficients ± standard errors. There was no statistically significant difference between the surgical fee schedules (P > 0.05).
Discussion
We demonstrated that the degree of inequality did not significantly change during the study periods of 2013 to 2018 despite 3 revisions of surgical fee schedules. This means that the Japanese surgical fee schedules remain unequal among surgical specialties in terms of resource utilization; surgeries that utilize a large amount of resources have not been reimbursed highly accordingly since 2013. In addition, our previous 3 studies demonstrated statistically significant differences in efficiency scores among surgical specialties.5-7
It is unclear which cost components are covered by the surgical fees. 20 This lack of details gives surgeons the impression that the fee schedule is unfair. They might feel that their surgery is devalued by the market and society, and might become demotivated to make efforts for their patients. In fact, it is uncertain whether the prices are appropriate or not. 20 Although it is expected that the revision will correct the inequality of the fee schedules, there are no follow-up studies that have quantitatively examined the current Japanese surgical payment system from the viewpoint of resources utilization. This is the first study that demonstrated that the degree of inequality in surgical fee schedules remained constant from 2013 through 2018.
Our method for evaluating inequality of the fee schedule may be unique. Our Medline search using keywords of Gini coefficients and data envelopment analysis revealed that there has been no study that inferred Gini coefficients of efficiency scores calculated from DEA. However, there are some examples of estimating Gini coefficients to determine the degree of equality in medicine and healthcare. For example, Gini coefficients were successfully estimated to evaluate an equal distribution of physicians in Japan. 21 Our method is a natural extension of our previous studies and theoretically sound.5-7
This study has several limitations. First, this study was conducted in a single large teaching medical center in Tokyo, Japan. The surgeons studied in this research may not be representative of those in other hospitals. However, there is an advantage to conducting a research in a single hospital. One of the significant resource inputs that may affect surgeons’ efficiency scores is ancillary services. The surgeons in the same hospital all face the same systemic advantages and disadvantages of the ancillary services. Comparing surgeons in different hospitals can be misleading if some ancillary services are more efficient than others. 22 Second, it is difficult to determine an appropriate, fair fee schedule. The costs of each devices and medical supplies are available, but the prices of surgeons’ clinical skill and judgment are impossible to evaluate monetarily. Even cost-plus-markup pricing may not reflect the price at the equilibrium point between supply and demand for surgery.23,24 The utility of the nation-wide controlled fee-for-service price may play a limited role in determining fair surgical reimbursements. 6 Therefore, the competitive market price may be the only fair and rational fee schedule. 3 Third, the inferential analysis of the Gini coefficients has been neglected for a long time because of Corrado Gini’s criticism toward the statistical inference. 17 However, the methodology of estimating standard errors of the Gini coefficients using Bootstrap methods were well-established in econometrics, 19 and it is widely used in different fields. 17 Our methods of comparing the Gini coefficients are reliable. Fourth, there is no known threshold for acceptable inequality of efficiency scores unlike income or wealth. When assessing a country’s level of income inequality, a Gini coefficient above 0.4 is widely accepted to be frequently associated with political instability and growing social tensions although this standard lacks rigid theoretical foundations.25,26 Our Gini coefficients that was calculated from efficiency scores ranged from 0.23 to 0.32, which may suggest that the distribution would be reasonably equal. 18 However, we previously demonstrated that the Japanese surgical fee schedule had statistically significant inequality among surgical specialties.5-7 The present results should be interpreted that the significant inequality persisted throughout our study period. Fifth, the policy implication in the present study may be weak. Making fair and equal surgical fees is not the main role for policymakers because the fee schedule revision aims to sustain the healthcare system in Japan. However, the inequality in fees may negatively affect surgeons’ motivation, and the quality of their care to the patients may suffer. Although reducing the inequality may not be policymakers’ first priority, they should pay some attention to this aspect to maintain a quality outcome of surgery. Sixth, we did not discuss the overtime discrepancy in the effects of revisions of fee schedules unlike the study by Chan et al 27 Moreover, we did not show which surgical specialties obtained benefits from the revisions in this study because the difference between winners and losers from the revisions has been the same throughout the study periods; according to our previous studies,5-7 neurosurgeons, thoracic surgeons and cardiovascular surgeons had always gained advantages while otolaryngologists had suffered. Therefore, we did not use panel data analysis, such as the fixed-effect model.
Conclusions
We demonstrated by DEA that the Japanese surgical fee schedules have not accurately reflected resources utilization despite the revisions of surgical fee schedule since 2013. The degree of inequality remained constant from 2013 through 2018.
Footnotes
Funding:
The author(s) disclosed receipt of the following financial support for the research, authorship, and/or publication of this article: This study was supported only by institutional resources at Teikyo University.
Declaration of conflicting interests:
The author(s) declared no potential conflicts of interest with respect to the research, authorship, and/or publication of this article.
Author’s Note
This work was presented in part in European Health Management Association 2020 Annual Conference.
Authors’ Contribution
Y.N.: Conceptualization, Methodology, Investigation, Writing—Original draft preparation, Writing-Reviewing and Editing, Project Administration. Y.W.: Data Curation, Software, Formal Analysis. H.O.: Validation, Supervision.
Ethics Approval and Consent to Participate
This study was approved both by the Teikyo University Institutional Review Board (IRB No. 12-030-3) and by the Teikyo University Committee on Conflict of Interest (TU-COI 12-201). The consent to participate was waived because our present study was a retrospective observational study. The need for consent was waived by the Teikyo University Institutional Review Board (IRB No. 12-030-3) as above.
Availability of Data and Materials
The data that support the findings of this study are available from the corresponding author upon reasonable request.