
Abstract
As the Ethiopian health system faced critical resource constraints, wise use of the available health resources is a priority agenda. Therefore, our study aimed to assess technical efficiency of maternal and reproductive health services in public hospitals of Oromia regional state, Ethiopia. Two-stage data envelopment analysis was performed among 14 hospitals with input orientation and variable returns to scale assumptions. Technical efficiency scores were computed at the first stage, and predictors were determined using Tobit regression at the second stage. The assessment revealed that 12 (85.7%) hospitals were pure technical efficient and 9 (64.29%) hospitals were scale efficient. Level (primary/general) (β = 1.17, 95% confidence interval [CI] = 0.16-2.18), service years (β = 0.02, 95% CI = 0.003-0.03), and size of catchment population (β = 5.58E–07, 95% CI = 2.95E–08 to 1.09E–06) were positively associated with technical efficiency of maternal and reproductive health service, whereas average waiting time for maternal health service (β = –0.03, 95% CI = –0.05 to −0.01) was negatively associated with efficiency. In conclusion, most of the hospitals were technically efficient and around two-thirds were operating scale efficient. Allocation of more resources to older secondary hospitals with larger catchment population could result in more efficient use of resources for maternal and reproductive health service delivery.
Keywords
Introduction
There was promising progress to achieve the international goals and targets during the millennium development goals (MDGs) era except the fifth MDG—improve maternal health. Annually, 303 000 maternal deaths occur globally. Of these, more than 99% occur in low-resource settings, 66% (201 000) in sub-Saharan Africa (SSA), and most are preventable through provision of quality essential maternal health services.1,2 The Maternal Mortality Ratio (MMR) in Ethiopia has become 412 per 100 000 live births in 2016. 3 There is sufficient evidence to suggest that high maternal mortality is associated with inadequate and poor-quality maternal health care. 4 Sustainable development goals (SDGs) established an agenda to reduce the global MMR to less than 70 per 100 000 live births by 2030.5,6
The SSA health system is suffering with critical resource constraints to ensure health services of adequate quality to the majority of their people and attain health and health-related goals. This is also reflected in maternal health service delivery. 7 Many low-income countries are below national and international health goals not only because of scarcity of resources but more painfully inefficient utilization. 8
Even though there are some increments in the national health expenditure of Ethiopia in the past years, the health care is one of the under-financed sectors in the country. The country spends US$20.77 per capita for health. 9 This figure is far below low-income countries’ spending US$22 and the World Health Organization’s (WHO) recommendation for low-income countries US$60.10,11 More seriously, half of Ethiopia’s health expenditure is dependent on funds from the external world which is uncertain. 9
To reduce this problem, maximum effort should be exerted through utilizing the existing resources in a way that gives maximum output. To ensure maximum efficiency in the health care system, there should be sufficient information about inputs, outputs, and efficiency.5,12,13 Even though efficiency is considered a critical measure of performance in the health sector, little attention is paid to this outcome measure in the Ethiopian health care delivery system. This concern is even greater in public hospitals where 32% of government health expenditure is spent. 14 Furthermore, there is a general belief that public hospitals tend to be inefficient particularly in the absence of systematic follow-up to ensure wise use of available resources. 15 Scarcity of literatures on hospital efficiency in the country may, perhaps, indicate that not much attention is given to efficiency by health care administrators.
Much of the attention of policy makers, donors, and health system researchers seems to be focused on health sector reforms, prominent of which is the mobilization of additional resources for health care through user fees and other modalities of financing. 16 On top of this, data envelopment analysis (DEA) is a well-recognized method of measuring relative efficiency and productivity in the public sector. However, its use in developing countries, particularly SSA, has been very limited. This is witnessed by the dearth of published information. 7 The same is true in Ethiopia specifically on the delivery of maternal and reproductive health services, which receives much of the overall health expenditure in the country’s health system. 14 Therefore, the aim of this study was to assess the technical efficiency (TE) of selected hospitals in the provision of maternal and reproductive health services in 6 zones of Oromia regional state (the largest regional state in Ethiopia) from July 2014 to June 2015.
Methods and Participants
Data study setting and design
Data for this study were obtained from a cross-sectional survey carried out during March 25 to April 18, 2016, in primary and secondary hospitals of 6 zones located in Oromia regional state, Ethiopia. We decided to take about one-third of the 19 zones in the regional state based on the recommendation of the WHO “tool for assessing operationality of district health systems.” 17 The region is the largest regional state in Ethiopia and a home for 36.7% of country’s population. 18 Currently, there are 50 (12 secondary and 38 primary) hospitals accountable to the Oromia Regional State Health Bureau. Fourteen primary and secondary hospitals situated in the region were assessed for their maternal and reproductive health services technical efficiency.
Data collection
Input and output data were collected using structured and pretested checklist-based interview, document review, and resource inventory checklists. The tools were developed after consulting the Ethiopian standard for primary and secondary hospitals requirement19,20 and other relevant literatures. One year input and output data, from July 2014 to June 2015, were included in the analysis. The input variables were total expenditure for maternal and reproductive health service, including capital, human resources, and non-salary expenditures (drugs, vaccines, and medical supplies). Salary for health professionals and other administrative staff was considered as a proxy for human resource as an input. The output variables were numbers of Antenatal care (ANC) visits, delivery, Postnatal care (PNC), Family Planning (FP), abortion and post-abortion services delivered in the hospitals.
The data collection checklist also included questions on environmental and organizational factors that could possibly influence the TE of hospitals in delivering maternal and reproductive health service. Organizational factors such as number of years since the hospital started service delivery, level of the hospital (secondary or primary), qualification of the chief executive officer (CEO) of the hospital, average waiting time for maternal health services, and benefit packages for the employees of the hospital were in the checklist for data collection. Environmental factors included catchment population, availability of nearby public health facility that provides maternal and reproductive health service, and location of the hospital (urban or rural).
Monetary values collected in Ethiopian Birr (ETB) were changed into US dollars with an exchange rate of ETB 21.4304 to US$1 21 .
Measures of efficiency
This study was intended to measure the TE of 14 hospitals in the provision of maternal and reproductive health service. The inputs/resources of the hospitals were not dedicated to maternal and reproductive health services only. Almost all of the resources were shared by all units in the hospitals. So to have specific figures for maternal and reproductive health service, a proportion was computed by dividing the total maternal and reproductive health service users by the overall client flow of each hospital. Then all the resources except midwife nurses, classrooms, and beds for maternal service were multiplied by the proportion.
Data envelopment analysis with variable returns to scale (VRS) and input orientation assumptions was used to measure technical efficiency of maternal and reproductive health service. Within the context of health care services, TE deals with the usage of labor, capital, and machinery as inputs to produce outputs relative to best practice in a given sample of decision-making units (DMUs). 22
Data envelopment analysis is a linear programming–based technique used for assessing the comparative operation of organizational units where the presence of multiple inputs and outputs make comparisons difficult. 23 It requires identification of units, which in relative sense use the inputs of the given outputs in the most optimal way. Data envelopment analysis uses these data to construct efficiency frontier over the information of available organization units. It uses this frontier to calculate the efficiencies of the other organization units that do not fall on efficient frontier and provide information on which units are not using inputs efficiently. 24
TE attempts to address 2 questions depending on whether it has input or output orientation. Input-orientated TE measure addresses the question: “By how much can input quantities be proportionally reduced without changing the output quantities produced?” On the other hand, output-orientated measure addresses, “By how much can output quantities be proportionally expanded without altering the input quantities used?”24,25
In DEA, there are constant and VRS models. The constant returns to scale (CRS) model assumes a production process in which the optimal mixture of inputs and outputs is independent of the scale of operation. TE scores obtained from a CRS DEA decomposed into 2 portions, one due to scale inefficiency and the other due to “pure” technical inefficiency. This may be done by undertaking both a CRS and a VRS DEA upon the same information. If there is a difference in the 2 TE scores for a particular DMU, then this indicates that the DMU has scale inefficiency and that the scale inefficiency can be calculated from the difference between the VRS TE score and the CRS TE score26,27

The CRS DEA model is used to measure overall efficiency for each of the selected hospitals. The objective function is to maximize the efficiency of a hospital’s subject to the constraints that no hospitals will be more than 100% efficient. Furthermore, the coefficient values are assumed to be positive and nonzero, when the same set of coefficients (weights) is applied to all other hospitals being compared. Maximize the efficiency of hospital j under the restriction that the efficiency of all units ⩽1. The algebraic model is 28

where Yrj = the amount of output r produced by hospital j, Xij = the amount of input I used by hospital j, Ur = the weight given to output r (
On the other hand, in a situation where hospitals are not functioning at an optimum scale, the TE measure will be mixed with scale efficiency. Hence, to distinguish the 2 efficiency scores, VRS model is studied. This moddel includes both increasing returns to scale (IRS) and decreasing returns to scale (DRS). Variable returns to scale is an extension of equation of the CRS model after imposing a convexity constraint on it. This implies that the data are enveloped more closely than the CRS model. The main advantage of the VRS model is that it enables an inefficient firm to be relatively compared with efficient firms of the same size only. Therefore, the relative efficiency score of hospital can be obtained by resolving the following equation 29

where Yrj = the amount of output r produced by hospital j, Xij = the amount of input I used by hospital j, Ur = the weight given to output r (
In this study, input-oriented VRS DEA was employed. Input-oriented approach is appropriate for hospitals which have less flexibility to change their outputs but can alter their use of inputs. This is more likely to be the case for public hospitals, which operate under a capped budget. 30 The selection of input orientation is also conformed to the character of the non-profit organization, which focuses on the minimization of inputs with given outputs. 31 Moreover, health managers at the Oromia Regional State Health Bureau would prefer to be informed about how much resources are spent inefficiently. This will enables the managers to decide on how to tailor resource allocation to their public hospitals with better efficiency in mind.
Data processing and analysis
The collected data were checked for completeness, edited, and entered into EpiData, version 3.1. Then exported to Microsoft Office Excel and Stata, version 13, for analysis. Two-stage DEA was performed. At the first-stage DEA, TE scores were identified using DEA Program, version 2.1 (DEAP 2.1), developed by Coelli. 26 After the TE scores were determined, the second-stage analysis was identifying predictors for TE. Tobit regression model was employed taking calculated TE score as dependent variable and other environmental and organizational factors as explanatory variables. Significant independent determinants were identified at 95% confidence interval (CI) and P value of less than .05.
Ethical approval
The proposal of this study was reviewed and approved by the ethical review board of Jimma University, Institute of Health. Supporting letter was obtained from Oromia Regional State Health Bureau. The objective of the study was explained, and informed consent was obtained from the CEO of each hospital.
Results
Of the 14 hospitals included in this study, 3 were secondary and the remaining 11 were primary hospitals. All these hospitals were located in urban centers. There was health center that provided maternal health service around in almost all of the hospitals within at most 3 km radius; 79% of the hospitals provided allowances for their employees like top-up. And half of them had additional fringe benefits for their employees like provision of cleaning materials and housing facility for physicians. Majority (64.3%) of the CEOs of the hospitals were BSc degree holders whether in Nursing, Public Health or Environmental Health. All the hospitals included their internal revenue and financial resource from the government in their budget; 28.6% of the hospitals got financial and material support from non-governmental organizations. The average service years of the hospitals was 13 years (range = 1–60); the mean size of catchment population for the study hospitals was 695 424 (range = 154 945-1 500 000) and waiting time for maternal and reproductive health service delivery ranged from 15 to 45 min with mean values of 29 min and 34 s.
The hospitals served maternal and reproductive health service users, including those coming for ANC, deliveries, PNC, first and repeated FP services, and abortion and post-abortion care. These clients were served using the available human, capital, and financial resources (Table 1).
Inputs used and outputs delivered in the provision of maternal and reproductive health services in public hospitals in Oromia regional state, Ethiopia (2016).

Expenditure for laboratory technician and technologists, pharmacy technician and technologists, and emergency surgery officers.
Technical and scale efficiency
Twelve (85.71%) of the hospitals were VRS technically efficient, scoring 1, and the remaining 2 (14.29%) of the hospitals were VRS technically inefficient. The inefficient hospital had VRS TE scores higher than 0.75. The overall mean VRS TE score was 0.99 (SD = 0.03). Hospitals H06 and H13 had VRS TE score less than 1. Moreover, the mean technical efficiency score for pure technically inefficient hospitals was 0.93 (SD = 0.04).
Nine (64.29%) of the hospitals had an SE score of 1. The remaining 5 (35.71%) hospitals had scale efficiency scores less than 1. The distribution shows that 3 hospitals had a scale efficiency score less than 0.5; the remaining 2 hospitals scored more than 0.75. The average scale efficiency score was 0.86 (SD = 0.28). The mean SE score of the scale inefficient hospitals was 0.60 (SD = 0.35). All the inefficient hospitals were operating at an increasing return to scale.
Overall TE score along secondary and primary hospitals showed that the secondary hospitals had greater average efficiency score 0.96 (SD = 0.01). Of the inefficient hospitals, the primary hospitals had the highest proportion of inefficient hospitals with the lowest mean technical efficiency score 0.81 (SD = 0.31).
Nine (64.29%) of the hospitals were constant returns to scale technically efficient, and the remaining 5 (35.71%) were relatively inefficient. Among the inefficient ones, 2 hospitals had a constant return to scale TE score greater than 0.75, the remaining 3 scored less than 0.5. The mean TE score was 0.85, with an SD of 0.28. The average constant return to scale TE score ranged from 0.20 in Hospital H11 to 1 in 9 hospitals (Table 2).
Efficiency scores of public hospitals on maternal and reproductive health service provision in Oromia regional state, Ethiopia (2016).

The analysis revealed that 35.71% of the hospitals were running inefficiently; this inefficiency was a result of either excess utilization of resources or fail to give service using the excess resources.
Excess use of resources end up with inefficiency in the hospitals. They have used extra resources like 0.98% non-salary expenditure (expenditures for supplies, drugs, and vaccines), 2.33% administrative staff salary expenditure, 5.09% general practitioners (GPs) and specialists salary expenditure, 6.22% clinical and midwife nurses salary expenditure, 5.20% other technical staff salary expenditure, 1.63% number of classrooms for maternal and reproductive health service, and 10.55% number of beds. Input reduction is required for pure technically inefficient hospitals, H06 and H13. The remaining hospitals are not expected to increase their output or decrease input to be pure technically efficient (Table 3).
Possible input reduction of inefficient hospitals on maternal and reproductive health service provision in Oromia regional state, Ethiopia (2016).

Expenditures for supplies, drugs, and vaccines.
Determinants of maternal and reproductive health service technical efficiency
The results of the Tobit model for examining determinants of hospitals’ efficiency are presented in Table 4. The variable average waiting time for maternal health service was negatively associated with efficiency (P < 0.05). In contrast, level of the hospital (P < 0.05), service years of the hospitals (P < 0.05), and size of the catchment population (P < 0.05) were positively associated with efficiency of the hospitals.
Determinants of hospital efficiency in maternal and reproductive health service provision in Oromia regional state, Ethiopia (2016).
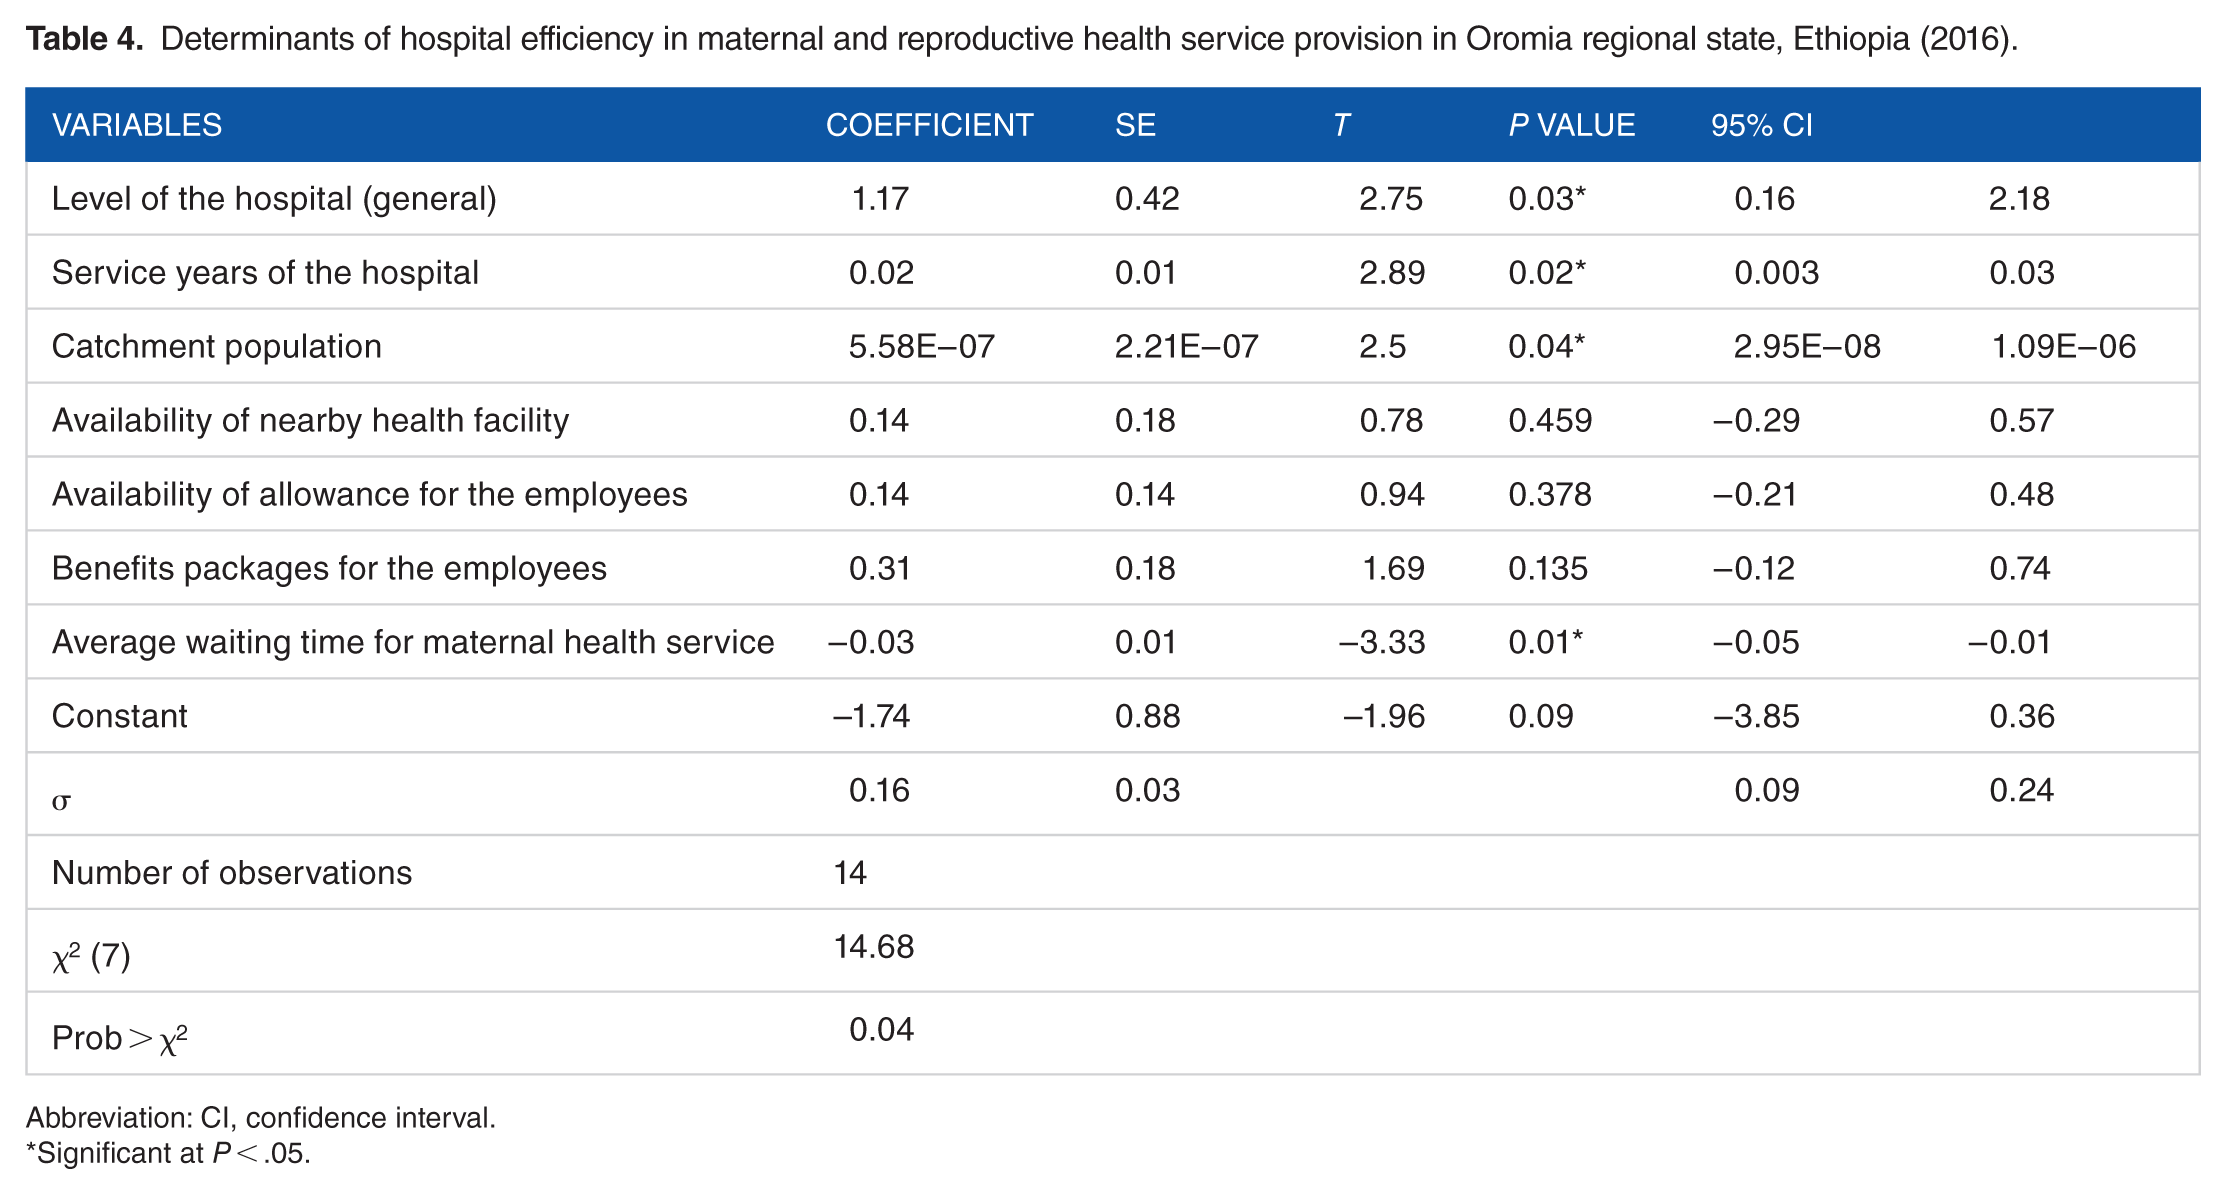
Abbreviation: CI, confidence interval.
Significant at P < .05.
Discussion
One of the major reasons for the current high level of maternal death and morbidity is problems in health service performance and responsiveness. Performance is of many dimensions, including quality, equity, access, and efficiency. Most of the time the focus of health system researchers in low-income countries is limited to the first 3 of these dimensions. This study has assessed the one with dearth of information, efficiency of maternal and reproductive health services.
The study revealed that there is a difference in the use of health resources across hospitals while delivering maternal and reproductive health services. More than one-third of the hospitals were found to be technically inefficient. A similar study done among Indian district hospitals in Gujarat state found one-half of the hospitals were operating with technical inefficiency. 32 Another study conducted in 17 hospitals of Addis Ababa showed that 70.6% were overall technically inefficient. 29 In Eritrea, 57.89% of the hospitals, 33 and in Ghana 59% of the hospitals, 34 were found technically inefficient. All of these studies reported a much higher proportion of hospitals with technical inefficiency compared with the current study. One may argue that this could relate to the fact that the focus of our study was specific to maternal and reproductive health services while the other studies had a more general approach. It may appear that this is a section of public hospitals where the flow of clients is much higher and more predictable contributing to greater outputs and better efficiency among the hospitals in our study. However, 2 other studies from China and India32,35 with similar specific focus as in our case reported that 40% and 50% of the hospitals were technically inefficient, respectively.
The mean technical efficiency score was 0.85 (SD = 0.28); this indicated that the hospitals could have saved 15% of their inputs without altering outputs. The technical efficiency score ranged from 0.2 to 1, indicating an 80% efficiency difference among the hospitals. The VRS assumption indicated that the hospitals included in the study were not operating at an optimal level. Based on this assumption, 35.71% of hospitals were scale inefficient. They could increase the scale of production by 14%. On the other hand, 14.29% of the hospitals were pure technically inefficient. This implied that the inefficient hospitals included in the study could have produced the same amount of outputs by reducing 7% of the inputs they were using.
Despite the variations in inputs and outputs used to calculate efficiency and the fewer number of hospitals included in our study, our findings imply a much better efficiency in our study facilities. In Eritrea, a study found 32% of the hospitals to be pure technically inefficient with a mean score of 0.97% and 58% scale inefficient with a mean score of 0.93. 33 A study in 37 health units of Sierra Leone reported that 59% were pure technically inefficient, and 65% were scale inefficient with mean scores of 0.63 and 0.72, respectively. 36 Another study in Ghana reported that 47% of the hospitals were technically inefficient, and 59% of the hospitals were scale inefficient; 34 33% of health centers in Addis Ababa and selected Oromia health centers from Ethiopia were found to be technically inefficient with a mean score of 0.94, and 60% scale inefficient with a mean score of 0.86. 28 However, the earlier argument of focus might also apply in these comparisons.
This study has also quantified output increase or input reduction required to make inefficient primary and secondary hospitals efficient. The results indicated a significant scope of input saving or rising outputs of the inefficient hospitals. It would be important for these hospitals to ensure efficient utilization of the available resources through critical monitoring and improved management of their inputs.
The excess amounts of resources available made the hospitals operate out of the efficiency frontier. The excess inputs included the non-salary expenditure, administrative staff salary expenditure, GPs and specialists’ salary expenditure, clinical and midwife nurses’ salary expenditure, other technical staff including laboratory technician and technologists, pharmacists and druggists, emergency surgery officers and anesthetist salary expenditure, number of classrooms for maternal and reproductive health service, and number of beds for maternal health service.
The implication of excess salary expenditure by the inefficient hospitals should be interpreted cautiously. A more pragmatic approach to make these hospitals more efficient would be to redistribute the excess clinical and support staff to other units of the hospital or another facility. Reduction of monthly salary of the already under paid health professionals in public hospitals should not be considered as an option for obvious reasons.
Both environmental and organizational factors were found to be significantly associated with the TE of the hospitals with maternal and reproductive health service. Maternal and reproductive health services’ efficiency in hospitals was positively associated with secondary-level hospital and service years. Being general hospital brought about 1.17 change in efficiency. Similarly, an increase in service years resulted in 2% increase in technical efficiency of maternal and reproductive health services being delivered in hospitals. This is similar to the finding reported in a study from Addis Ababa where years in operation and teaching status were found to be significantly associated with efficiency. 29 This investigation identified 4 variables that significantly affected efficiency of hospitals both positively and negatively. Two of these variables were found determinants in other studies29,37 Size of the catchment population and average waiting time for maternal health service, however, were unique to our study. A unit increase in the size of catchment population resulted in 0.00005.58% increase in technical efficiency. A unit increase in waiting time for maternal health services, however, decreased technical efficiency by 3%.
Limitations of the study
Finally, it has to be noted that there were some limitations in the conduct of this study. First of all, the study did not investigate social, cultural, and behavioral factors, which can strongly influence the outputs of health systems. Moreover, given the general inputs of the hospitals, to get a specific perspective of maternal and reproductive health service, required estimating the proportion of resources used in the delivery of these services. This might have resulted in under or over-estimation of the inputs shared by maternal and reproductive health service.
Conclusions
The findings of this study indicated that more than one-third of the hospitals were operating as technically inefficient in the delivery of maternal and reproductive health service. These inefficiencies were both pure technical and scale inefficiency. However, most of the hospitals were found pure technically efficient in providing maternal and reproductive health service, and around one-third of the hospitals were scale inefficient.
The inefficient hospitals were operating using extra resources which pushed them out of the efficiency frontier. The inputs which were used in excess were technical and administrative staff, beds, non-salary expenses, and classrooms for maternal health service. Redistribution of the surplus resources in the inefficient hospitals within units of the same hospital or across public hospitals is a practical solution here.
Efficiency of hospital’s maternal and reproductive health service was affected by various environmental and organizational factors. Level of the hospital, catchment population, and years of service were positively associated with TE scores. On the other hand, waiting time for maternal health service was negatively associated with technical efficiency. Hospital administrators and other health managers could aim for a careful reexamination of procedures for allocating resources for public hospitals to avail more resources for those at higher level of care, with larger catchment population and with greater number of years in operation.
Footnotes
Acknowledgements
We would like to thank Jimma University for funding this study. We are also grateful to hospital managers, data collectors, and supervisors of the study, and others who assisted us during data collection.
Funding:
The author(s) disclosed receipt of the following financial support for the research, authorship, and/or publication of this article: This work was supported by Jimma University as a part of mega research project on “A systems approach to understand maternal, neonatal and child health services in Oromia regional state: implications for the post MDG era.”
Declaration of conflicting interests:
The author(s) declared no potential conflicts of interest with respect to the research, authorship, and/or publication of this article.
Author Contributions
MW, AA, GT, FT, and KY conceived and designed the study. KY, MW, AA, YS, BE, and MW performed the study. KY analyzed the data. KY wrote the paper and manuscript. MW, AA, DY, GT, and FT reviewed the paper and manuscript. All authors read and approved the manuscript.
Data Availability
Part of data used for this analysis is included in this submission. The full data can be accessed upon request from the corresponding author.