
Abstract
Background:
Cholera is a significant public health issue in low- and middle-income countries. Understanding the specific factors contributing to outbreaks is crucial for designing effective control strategies, especially in prolonged outbreak situations. Therefore, this study aimed to identify determinants of cholera outbreaks in the southeastern part of Oromia, Ethiopia.
Methods:
A community-based, unmatched case-control study was conducted involving 10 districts across 4 zones of the Oromia region, Ethiopia. Cases were individuals with laboratory-confirmed Vibrio cholerae infection or those linked to a confirmed case, while controls were asymptomatic individuals without symptoms. The association between risk factors and cholera was studied using a logistic regression model. Variables with P-values less than .25 were included in the multivariable logistic regression model. The Hosmer-Lemeshow test assessed the goodness-of-fit of the final model. Adjusted odds ratios were calculated to determine independent determinants of cholera outbreaks.
Results:
The study involved 1218 individuals, 424 (34.8%) being cases and 794 (65.2%) controls. The study found that household heads with no formal education [AOR: 3.65; 95% CI: 1.92-6.95] and primary education [AOR: 1.99; 95% CI: 1.05-3.78], households that were farmer/housewives [AOR: 2.49, 95% CI: 1.26-4.93], pastoralists [AOR: 4.20; 95% CI: 1.73-10.20], eating raw or uncooked food [AOR: 1.57; 95% CI: 1.18-2.10], storing water every day [AOR: 2.51; 95% CI: 1.21-5.22], and a low information index [AOR: 1.79; 95% CI: 1.25-2.56] increase the odds of being a case compared to their counterparts. Married respondents [AOR = 0.46; 95% CI: 0.34-0.62], good latrine utilization [AOR: 0.59; 95% CI: 0.40-0.85], and very good latrine utilization [AOR: 0.40; 95% CI: 0.26-0.61] are associated with lower odds of cholera infection. Therefore, targeted interventions, such as improving education, sanitation, and household-level food hygiene practice, would have a significant impact on the control and prevention of cholera in the setting.
Introduction
Cholera continues to be a major public health concern in low- and middle-income countries1-3 The disease is considered an outbreak when a case is confirmed through culture. Once thought to be close to being eliminated, the disease is back, devastating communities, especially at a global level.2,4 About one-in-ten of the global population is at risk for cholera, and an estimated annual incidence of 1.3–4.0 million cholera cases every year results in 21 000 to 143 000 deaths worldwide.5-7 Unexpectedly, the disease has shown a constant trend of increment in the African Region over the last 3 decades.3,8,9 In 2022, 30 countries reported cholera outbreaks, including places that had been free of the disease for decades.1,10 Poverty is the driver of cholera outbreaks, 11 as it limits access to clean and safe drinking water. 8 Poor sanitation infrastructure, including the lack of proper sewage systems and toilets, leads to open defecation. 12 Low levels of awareness about cholera prevention and hygiene practices contribute to the spread of the disease, and the lack of well-equipped health facilities limits the ability to quickly diagnose and treat cholera cases, leading to higher morbidity and mortality rates.13-15 Nowadays, multiple humanitarian crises, conflicts, poverty, and social injustice are forcing people to live in unsanitary conditions that significantly contribute to the spread of this infectious disease. 16
Sub-Saharan Africa is one of the regions with the highest cholera burden, where more than 140 000 suspected cases are estimated to occur each year in both endemic and epidemic settings. It contributed about one-fourth of the global cholera burden. Ethiopia is one of the sub-Saharan countries significantly affected by Cholera. 11 About 5 million residents in Ethiopia are currently living in high-risk areas, and the nation has experienced recurring outbreaks in recent years. 3 Cholera outbreaks in Ethiopia are often linked to seasonal changes, where heavy rainfall and flooding can contaminate water supplies. The dry seasons may reduce water availability, forcing people to use unsafe sources. There is less access to clean and safe drinking water is often limited, especially in rural and low-income urban areas. Different studies in Ethiopia indicate that only 13% of urban households have access to safely managed sanitation services, 17 and a very low proportion of urban slums have access to basic sanitation services. This low access increases the risk of contamination, particularly among low-income households. 18 People frequently rely on contaminated water sources, such as rivers and unprotected wells, which can harbor Vibrio cholerae, and there is poor sanitation infrastructure, including the lack of proper sewage systems and toilets, which leads to open defecation.19-21 The Oromia region has been particularly hard-hit, reporting 21 053 cases from 2015 to 2023, with an overall case fatality rate of 0.98%.22-24
The region has been experiencing recurrent and protracted cholera outbreaks, which have had devastating impacts on public health and socio-economic stability. These outbreaks are characterized by their persistent nature, spanning several years and affecting multiple communities residing in the lowland and the highlands. While various contributing factors have been suggested. A deeper exploration of the drivers behind these repeated outbreaks is essential to understand and mitigate their occurrence.
Understanding these determinants is crucial for developing targeted interventions to prevent and control cholera outbreaks in low-income areas of Ethiopia. Thus, the objective of this study was to investigate the determinants of cholera in selected districts Oromia region using a case-control study
Methods and Procedures
Study Design and Settings
Between September and November 4, 2023, an unmatched community-based case-control study was conducted in 10 districts across 4 zones of the Oromia region (Figure 1). The study population included individuals aged 2 years and older, excluding children under 2 years to enhance the specificity of the case definition. The research covered Bale, East Bale, Guji, and West Arsi zones across 10 districts in the Oromia Region. The zones were purposively chosen due to their history of repeated and prolonged cholera outbreaks. Similarly, the districts were selected based on the presence of active outbreaks. Samples were allocated according to each district’s reported cases to ensure proportionality.
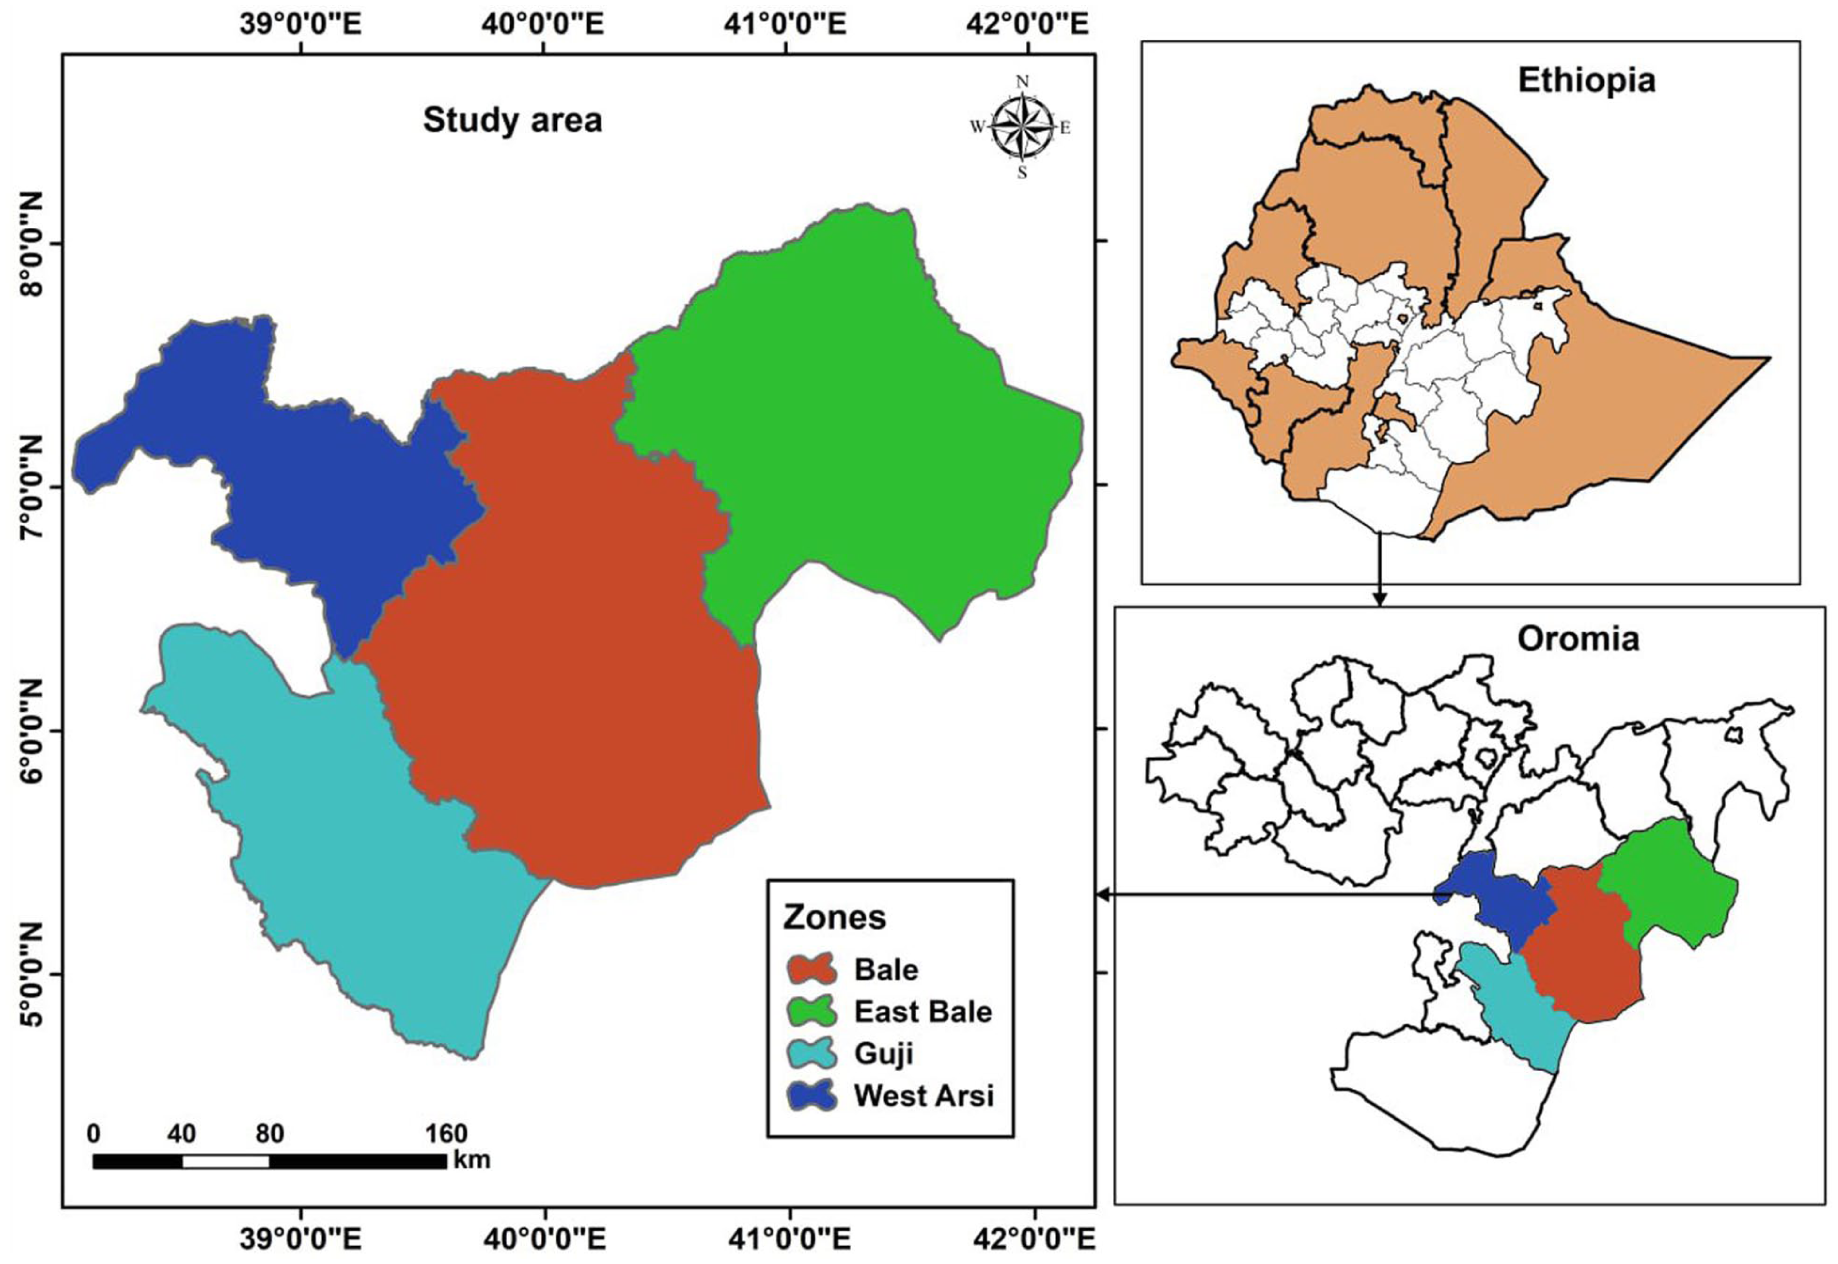
Map of the study area, Oromia, Ethiopia, 2023.
Selection of Study Participants
Selected cases and neighboring controls were surveyed in a 1:2 case-control ratio. Epi Info version 7.1.3 software was used to estimate the sample size using the double population proportion formula. The following assumptions were considered for the required sample size: a 95% confidence level, 80% power, and the lowest odds ratio associated with open defecation as a risk factor. The final estimated sample size, accounting for a 10% non-response rate, was 1290, comprising 430 cases and 860 controls. Cases were laboratory-diagnosed cholera patients, and epidemiologically linked controls were randomly selected individuals from the same kebele (the lowest administrative unit in Ethiopia) or neighboring households without cholera signs and symptoms since the onset of the current outbreak. To minimize the risk of misclassification among cases and controls, stringent criteria were applied, including the absence of clinical symptoms and adherence to the timeline of exposure
Cases listed in the consolidated line list since July 1, 2023, and admitted to the Cholera Treatment Center (CTC) were eligible for inclusion in the study. The admission registers at the CTC served as the sampling frame. We employed simple random sampling to select the cases and administered a structured questionnaire through face-to-face interviews in their households. Verbal consent was obtained from the cases and, in the case of minors, from their legal guardians.
For each case, we selected 2 population controls from the districts. Controls were recruited randomly by selecting every second household near the case household. We administered a structured questionnaire, similar to the one used for cases, covering demographics and risk factors but excluding clinical details. Before the interview, controls were screened for a history of cholera-like symptoms, including diarrhea, vomiting, abdominal pain, and any cholera cases in the household within the past month. Interviewers visited the residences of each case and selected controls from the same neighborhood. Controls and their household members were required to have no history of diarrhea. Each case, along with 2 controls from the same area, was interviewed.
Sample Collection and Processing
Stool samples were collected from the first 20 cholera patients and transported to the laboratory in Cary-Blair media. Stool samples were analyzed at the Shashamane Regional Public Health Research and Referral Laboratory. After culturing on selective media, typical Vibrio cholerae colonies were successfully isolated and identified in 17 cases. Consequently, cases with known contact with confirmed positive cases were considered epidemiologically linked, treated, and classified as cholera patients.
Data Collection Procedures
To ensure data quality, the questionnaire was prepared in English and then translated into the local language, Afan Oromo, for data collection. It was subsequently retranslated back into English to maintain consistency. Data collectors received training on the tools and procedures for data collection. The questionnaire was pre-tested on 5% of the total sample size in nearby communities before the actual data collection period to ensure its validity. Additionally, the primary investigator and supervisors reviewed and checked the data daily for completeness and consistency. Data was collected using CSPro software, sent to the central server, exported to Excel, and checked for consistency.
Operational Definition
Case
Any individual aged 2 years or older who experienced profuse acute watery diarrhea and vomiting, with stool testing positive for Vibrio cholerae O1 or O139.19,25
Control
An individual aged 2 years or older who lived in the same kebele as the case but did not exhibit any clinical symptoms suggestive of cholera or was not diagnosed with cholera during the outbreak period from September to November 4, 2023.
Suspected Case
An individual aged 2 years or older who developed acute watery diarrhea, with or without vomiting, but was not confirmed to have Vibrio cholerae.19,25
Inclusion criteria
Those who met the case/control definition and consented verbally to the study.
Statistical Analysis
Data was collected online using CSPro Data Entry 7.2.1 software and then exported to Stata version 16.0 for analysis. The questionnaires were recorded to ensure they met statistical assumptions and to determine the determinants of the Cholera outbreak. The data was cleaned for every possible error. Descriptive results were obtained to describe and characterize the study participants concerning the selected variables. Very few missing values were observed for some of the covariates, and the issue was handled with a modal value imputation approach after considering the types of variables and the pattern of missing values. Each availability and utilization index of the cholera prevention and control methods was analyzed individually, and a pooled variable was generated. Ultimately, the availability and utilization index were determined by summing the pooled variables from each category.
Initially, the identification of determinant factors of cholera infection during the outbreak began with fitting a bivariate binary logistic regression. In bivariate analysis, every variable considered as a factor/covariate was evaluated for its association with cholera infection status at a P-value of .25. A Multivariable binary logistic regression model was fitted to evaluate the combined effect of determinant factors of cholera outbreaks after adjusting for confounding variables. Statistical significance was declared at a P-value of <.05. In fitting the final model, thematic sub-analysis was performed to identify candidate variables from sub-components. A stepwise model fitting strategy was then employed. The significance of variables remaining in the model was evaluated using the likelihood ratio test. Insignificant variables were removed, and the model’s fitness was assessed using the Hosmer and Lemeshow test (P = .1274), indicating a good fit. The model’s discriminatory ability was also evaluated, correctly classifying approximately 77.64% of outcomes. Adjusted odds ratios (AOR) with 95% CI, was used to express the effect of each category on the outcome relative to the reference category
Results
Socio-Demographic Characteristics of Study Participants
A total of 1218 individuals participated in the study with a response rate of 94.4%, 424 (34.8%) being cases and 794 (65.2%) controls. The majority of respondents were aged 5 to 14 years 308 (25.29%), with a significant portion having no formal education 517 (42.45%). Most respondents were married 645 (52.96%) and both groups have a similar distribution of male and female respondents. A large proportion resided in rural areas 1037 (85.14%), and the case group has a higher percentage of rural residents. Family sizes were predominantly large 939 (77.09%), and the primary occupation of household heads was farming or housewifery 944 (77.50%). Family size distribution is similar in both groups, but the case group has more household heads who are farmers or housewives and also more household heads with no formal education (Table 1).
Socio-Demographic Characteristics of a Study Participant Concerning Their Cholera Status in Oromia, Ethiopia, 2023.
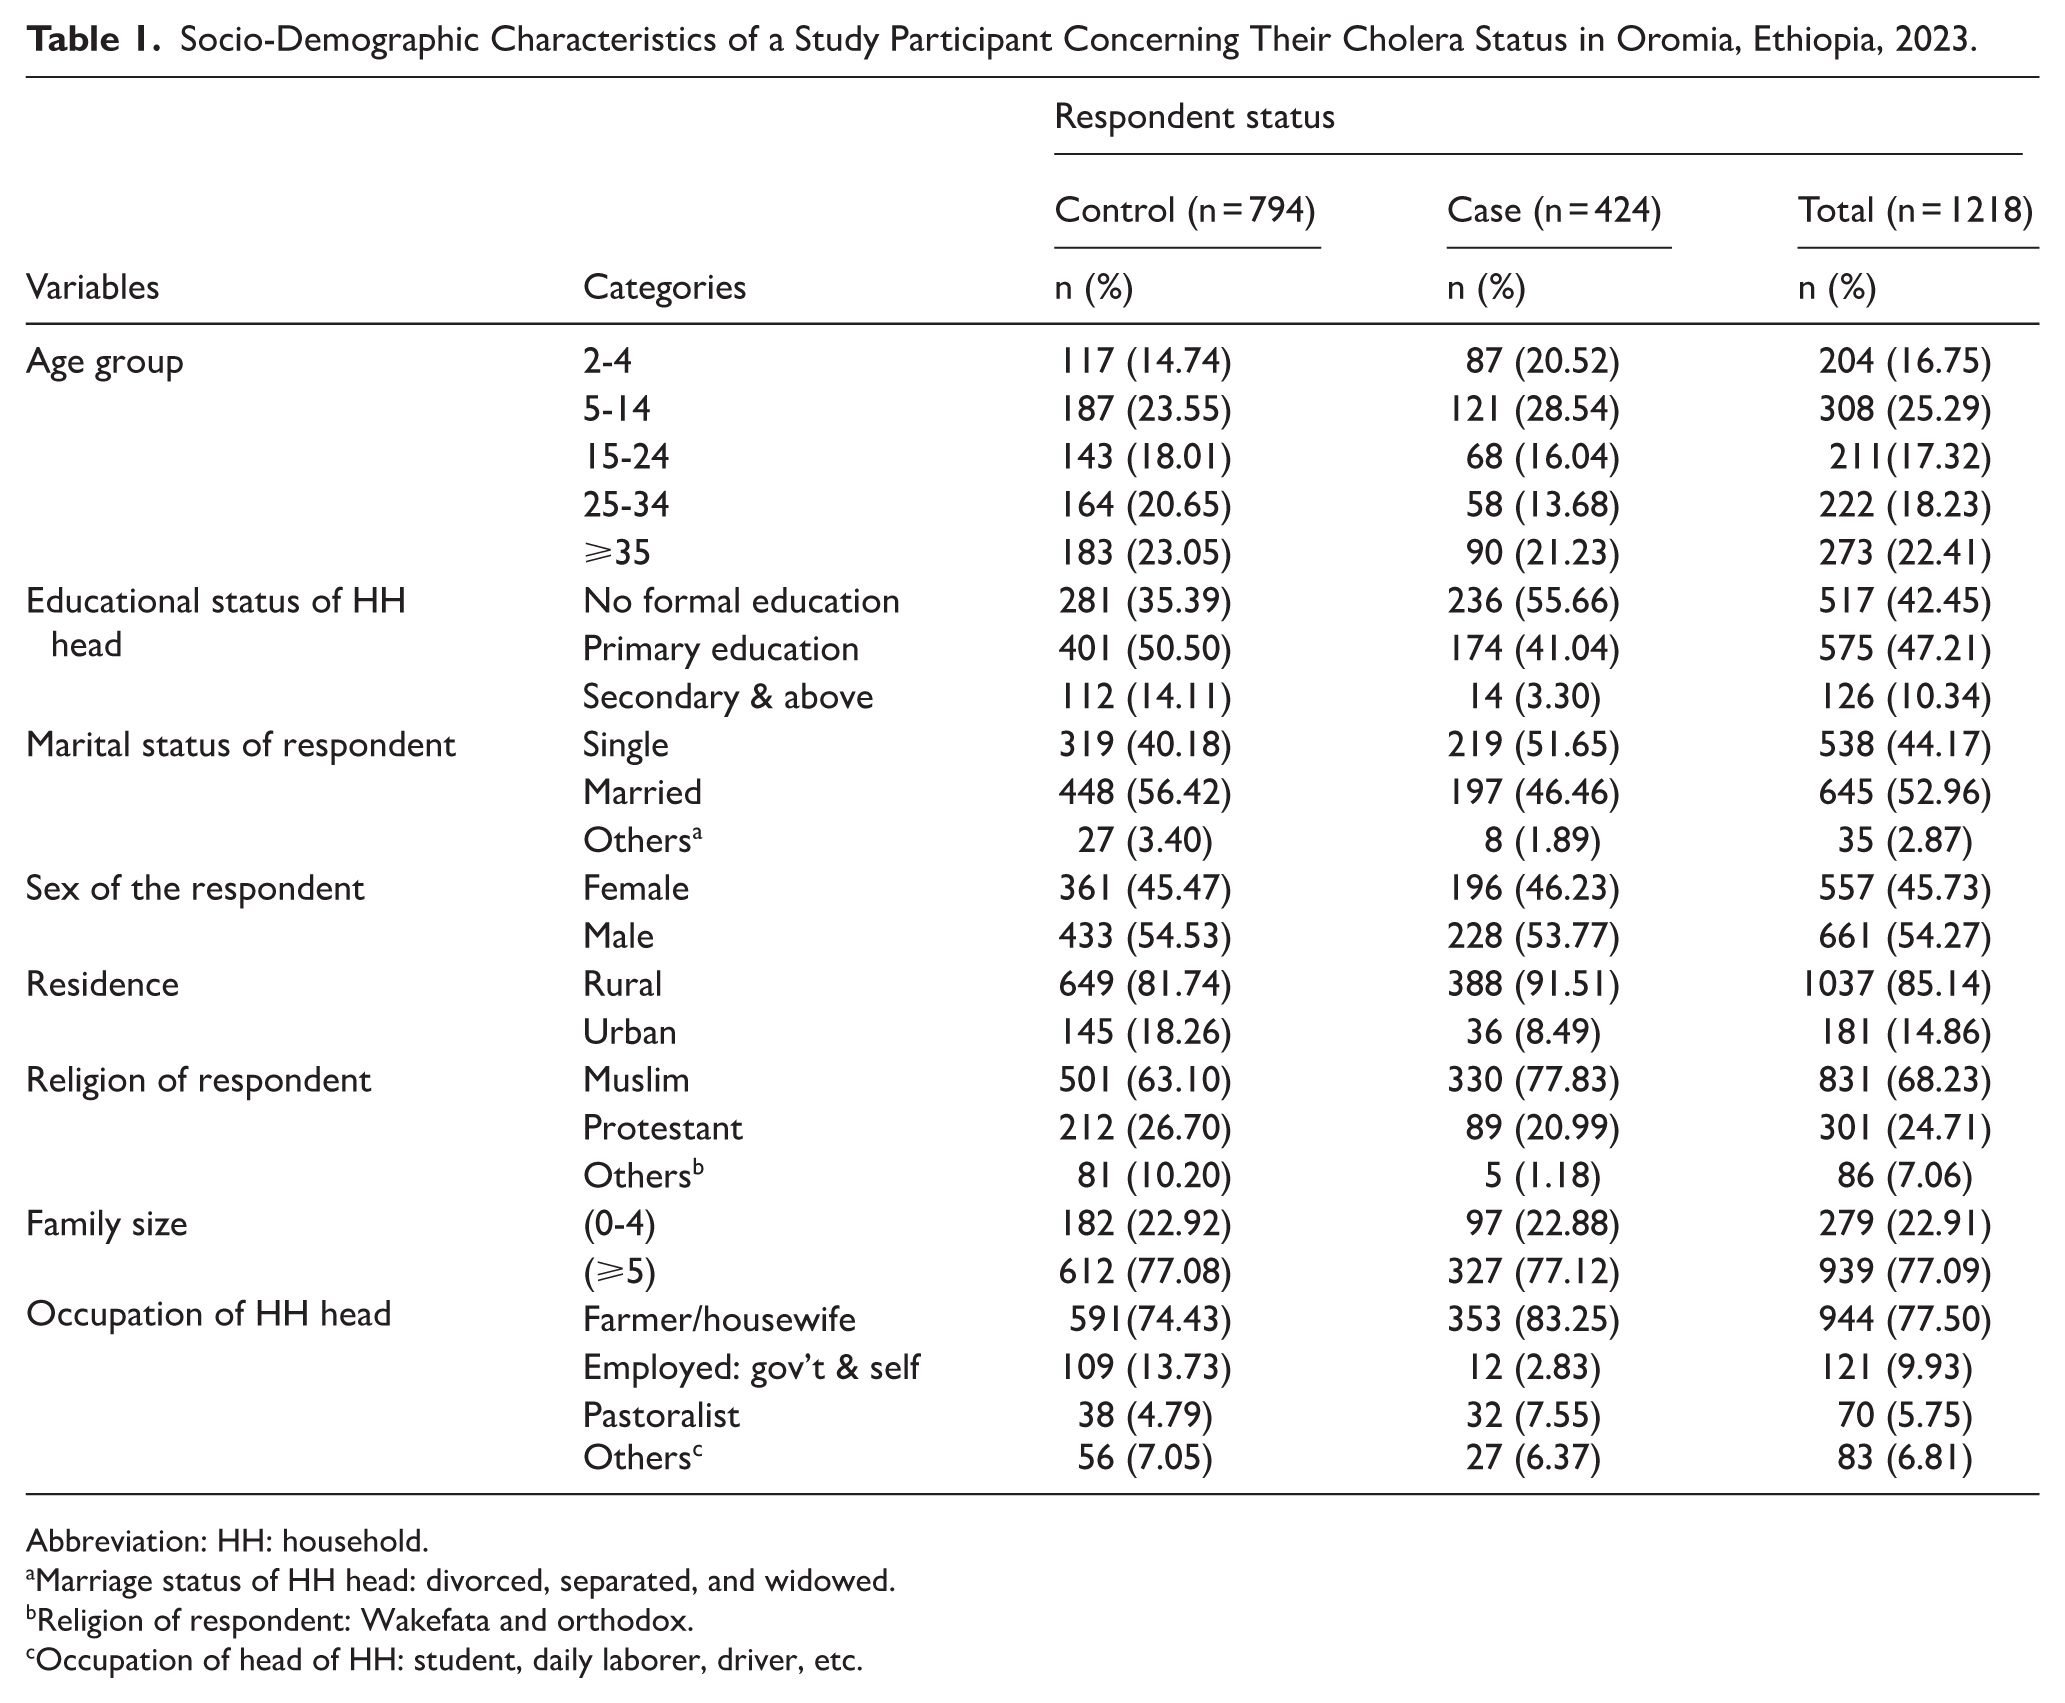
Abbreviation: HH: household.
Marriage status of HH head: divorced, separated, and widowed.bReligion of respondent: Wakefata and orthodox.cOccupation of head of HH: student, daily laborer, driver, etc.
Knowledge of Respondents on Cholera Prevention and Control Activities
The study participants’ knowledge indicators reveal that a majority had poor knowledge of cholera signs and symptoms, 969 (79.56%), with a slightly higher percentage among controls 637 (80.23%), compared to cases, 332 (78.30%). Knowledge of the mode of transmission was more evenly distributed, with 494 (40.56%) having good knowledge, 446 (36.62%) having fair knowledge, and 278 (22.82%) having poor knowledge. In a higher percentage of cases, 168 (39.62%) reported eating raw/uncooked food compared to controls, 257 (32.37%). Most participants reheat cooked food before eating which accounts for 811 (66.58%), with similar percentages among cases and controls. Accessibility to health facilities was high at 1006 (82.59%), but slightly lower among cases at 327 (77.12%) compared to controls at 679 (85.52%; Table 2).
Description of Study Participants Concerning Knowledge Indicator Variables of South Eastern Part of Oromia, Ethiopia, 2023.
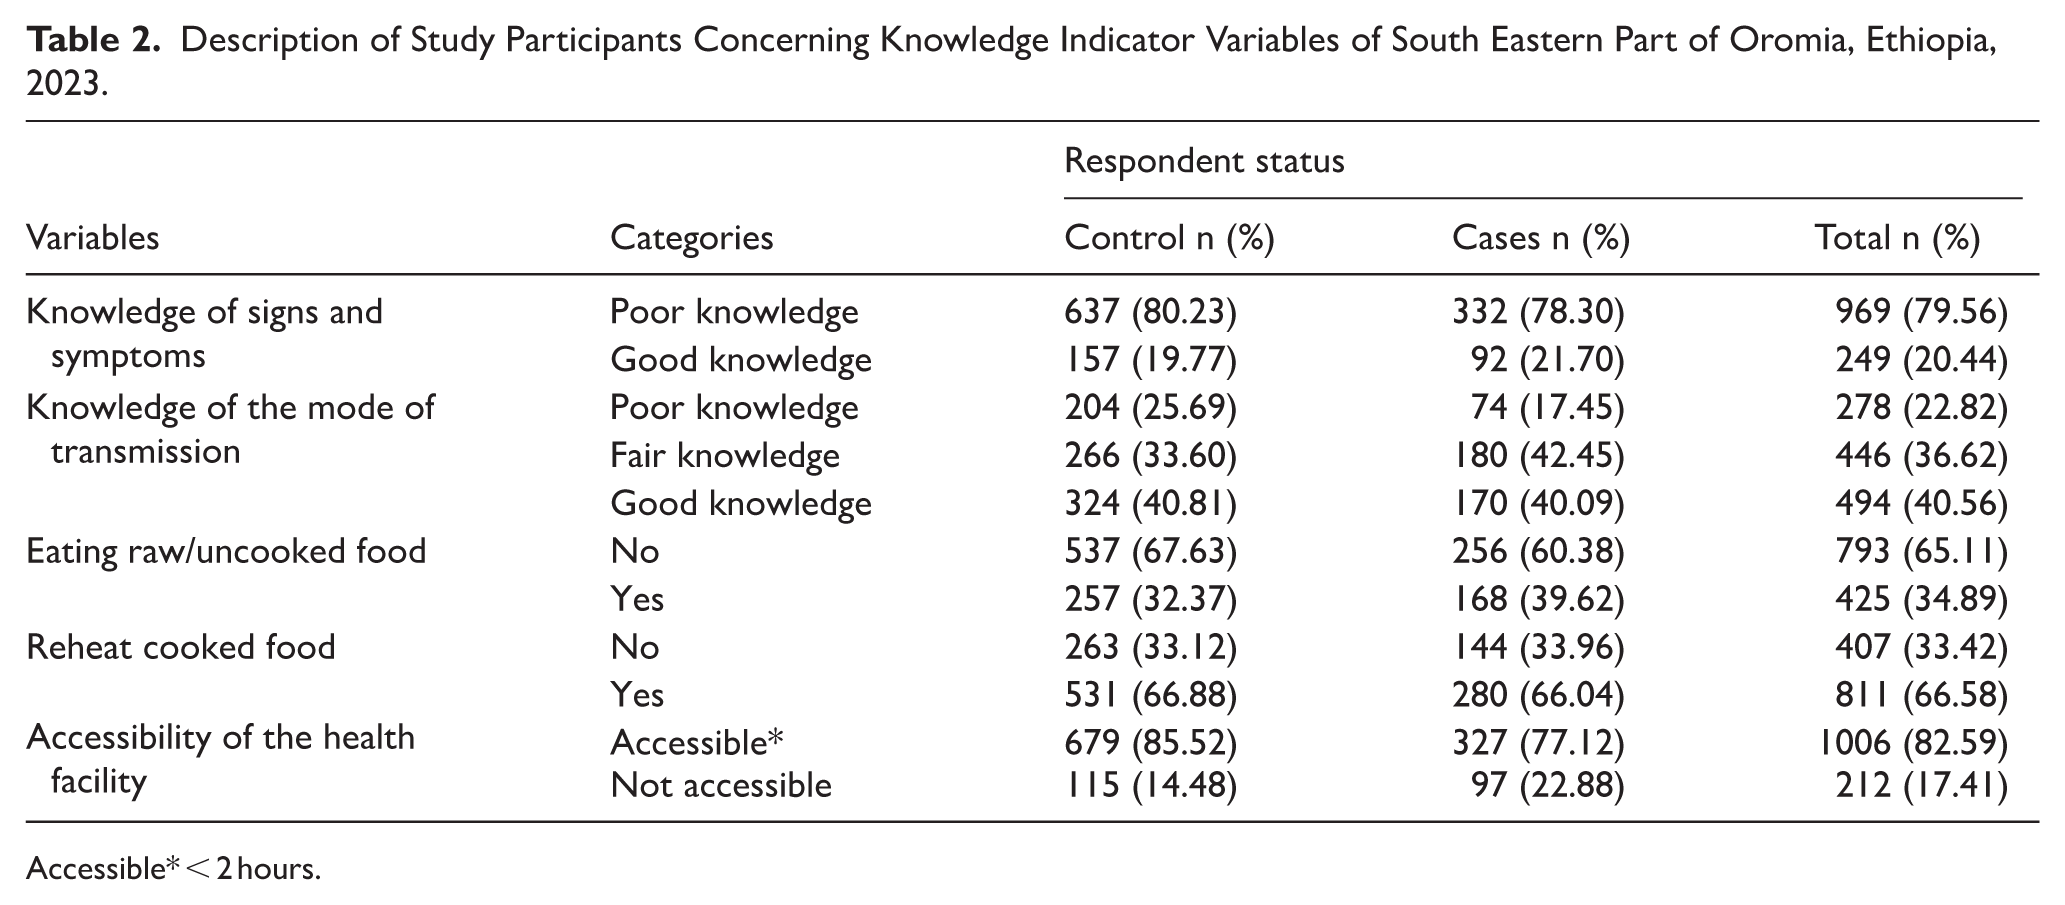
Accessible* < 2 hours.
Sanitation and Hygiene
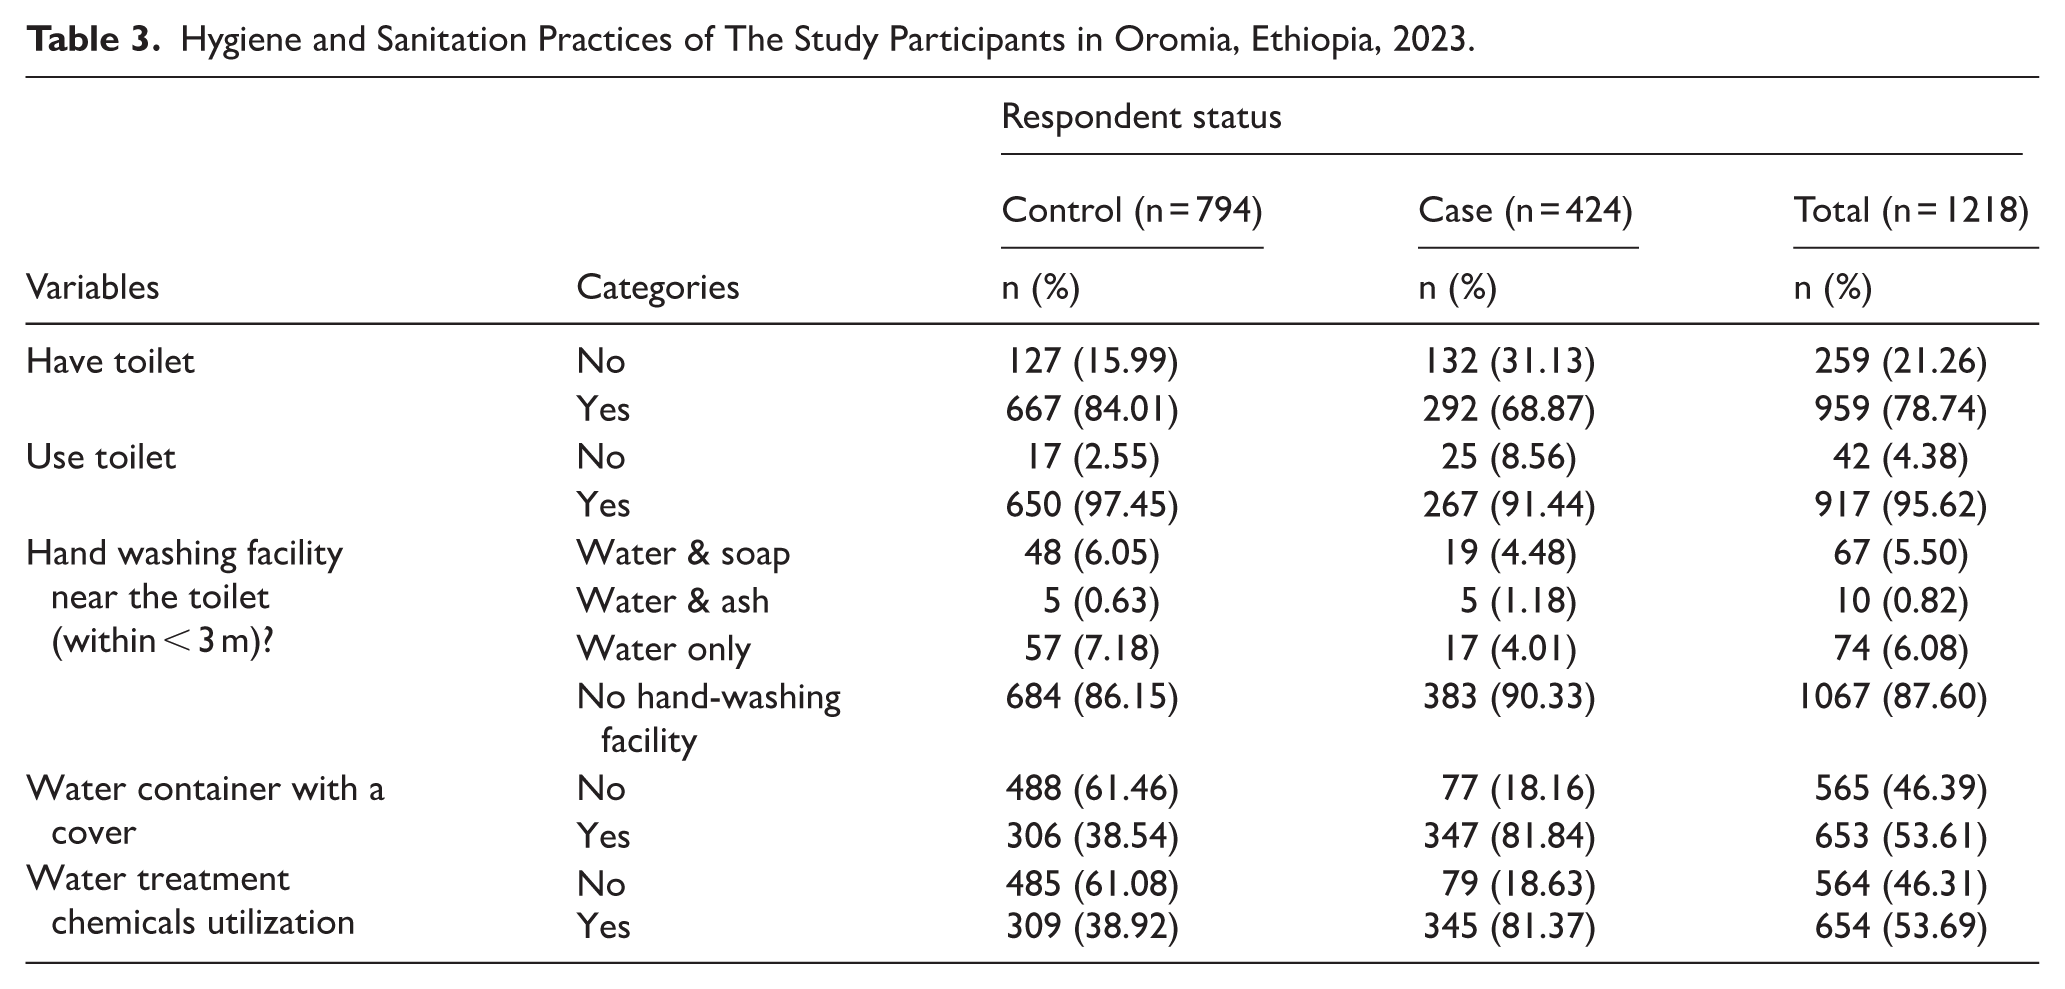
In the context of hygiene and sanitation practices, 292 (68%) of the cases and 667(84%) of the controls have access to a latrine. When it comes to toilet usage, 267 (91.4%) of the cases and 650 (97.5%) of the controls (650 individuals) utilize a toilet. However, during our observations, we rigorously verify whether individuals are genuinely using their latrines. Key indicators for utilization include the availability of walkways, rinsed water, the absence of flies, regular defecation, and the presence of spider webs in the latrine. Surprisingly, 67% of latrines have spider webs, suggesting that a majority of available latrines remain unused by the householders under observation. Notably, a significant proportion of under-five children (61% of cases and 59% of controls) prefer to use the backyard rather than the latrine.
Concerning handwashing facilities near toilets, it is remarkable that 383 (90.33%) of cases and 684 (86.15%) of controls lack such facilities. Only a small percentage have access to devices with water and soap, ash, or water alone. Additionally, during our observations, we found that 77 (18.16%) of cases and 61.46% of controls (488 individuals) do not have a cover or lid for their water containers. Lastly, 345 (81.37%) of cases and 309 (38.92%) of controls rely on water treatment chemicals. This practice emerged due to cases receiving water treatment chemicals upon discharge, accompanied by education on their proper use (Table 3).
Hygiene and Sanitation Practices of The Study Participants in Oromia, Ethiopia, 2023.
Water Quality Indicators
The primary water sources for the community were river water 52% among cases and 21% among controls, and pipe water 21% among cases and 56% among controls. Additionally, some respondents used spring water for drinking, accounting for 13% in both cases and controls. Among the study participants, more than half 58% of controls and 52% of cases use detergents to clean their water containers. Specifically, 680 respondents 55.83% reported using detergent for washing water containers. Additionally, 644 respondents 52.9% mentioned the presence of waste materials in their water storage containers.
Most households 1165 (95.65%) had covered containers, with 96% of controls and 94% of cases falling into this category. Furthermore, of 946 households 76% accessed water by pouring. Daily water storage was practiced by 674 respondents (55.34%), with 50% of controls and 66% of cases storing water for only 1 day. We assessed water handling practices at the household level, considering the cleanliness of water storage containers both inside and outside. Notably, in 287 cases 75% and 450 (68%) controls stored water in containers that were deemed dirty. Among the cases, 195 respondents (51%) washed their water storage containers using water only, which was higher compared to the controls 259 (39%) respondents (Table 4).
Descriptive Summary of Water Quality Indicator in the Study Areas, Oromia, Ethiopia, 2023.

Determinants of Cholera Infection
The study used a multivariable binary logistic regression model to examine the association between potential determinants of cholera infection status. Variables with a P-value less than .25 were considered for the multivariable model. These included age group, educational status, marital status, residence, religion, occupation, knowledge of signs and symptoms, knowledge transmission modes, consumption of raw/uncooked food, accessibility of health facilities, availability of water treatment chemicals, water treatment practices, materials used to wash water containers, cleanliness of water storage containers, mode of water access, number of days of water storage, latrine availability, safe water accessibility index, Latrine utilization index, and information source and access index (Appendix 1).
The study revealed several statistically significant associations. The results obtained from multivariable binary logistic regression analysis depict the risk of cholera infection. The study revealed several statistically significant associations. Household head with no formal education (AOR: 3.65, 95% CI: 1.92-6.95, P-value: .000) and primary education (AOR: 1.99, 95% CI: 1.05-3.78, P-value: .036), households who were farmer/housewife (AOR: 2.49, 95% CI: 1.26-4.93, P-value: .009), pastoralist (AOR: 4.20, 95% CI: 1.73-10.20, P-value: .002), or in other occupations (AOR: 2.59, 95% CI: 1.11-6.04, P-value: .027) increases the odds of being a case compared to being employed. Married respondents had lower odds of being in the cholera case group (AOR: 0.461, 95% CI: 0.345-0.617, P < .001) compared to unmarried respondents. For latrine utilization, good (AOR: 0.59, 95% CI: 0.40-0.85, P-value: .005) and very good utilization (AOR: 0.40, 95% CI: 0.26-0.61, P-value: .000) are associated with lower odds of cholera infection. Safe water accessibility shows that fair (AOR: 0.48, 95% CI: 0.30-0.75, P-value: .002), good (AOR: 0.26, 95% CI: 0.18-0.38, P-value: .000), and very good accessibility (AOR: 0.40, 95% CI: 0.28-0.57, P-value: .000) were associated with lower odds of being a case when compared to very poor accessibility. Safe water accessibility shows that poor (AOR: 0.48, 95% CI: 0.30-0.75, P-value: .002), good (AOR: 0.26, 95% CI: 0.18-0.38, P-value: .000), and very good accessibility (AOR: 0.40, 95% CI: 0.28-0.57, P-value: .000) are associated with lower odds of being a case when compared to very poor accessibility. The data indicates that individuals with poor knowledge of the mode of transmission have significantly lower odds of being cases compared to those with good knowledge, with an adjusted odds ratio (AOR) of 0.49 (95% CI: 0.33-0.72, P-value: .000). In contrast, individuals with fair knowledge have almost the same odds of being cases as those with good knowledge, with an AOR of 0.98 (95% CI: 0.72-1.34, P-value: .895), indicating no significant difference. Eating raw or uncooked food was associated with higher odds of being in the case group (AOR: 1.570, 95% CI: 1.177-2.099, P-value: .002), which indicates that eating raw or uncooked food increases the likelihood of cholera infection. Storing water every day also increased the odds (AOR: 2.510, 95% CI: 1.207-5.218, P-value: .014) compared to not storing water. The non-significance of other categories may be due to the usage of water stored for more than 1 day for household consumption during the outbreak. A low information index (AOR: 1.79, 95% CI: 1.25-2.56, P-value: .001) is associated with higher odds of being a case (Table 5).
Multivariable Binary Logistic Regression Analysis to Identify Determinants of Cholera Infection in Oromia, Ethiopia, 2023.

Discussions
The study revealed that individuals with no formal education or only primary education have higher odds of being infected with cholera compared to those with secondary education and above. Similar observations were made during the Haiti cholera outbreak in 2010, where education emerged as a significant predictor of cholera infection. 26 Lack of awareness about hygiene practices, sanitation, and preventive measures among less-educated individuals could contribute to their higher risk of cholera. The study also observed an association between the occupation of the household head and varying risks of symptomatic cholera infection. Specifically, farmers, housewives, and pastoralists face significantly higher odds of being affected by cholera compared to those employed in government or self-employed roles. Notably, a similar study conducted in Tanzania in 2011 highlighted challenges faced by pastoralist communities residing in water-scarce areas, where limited access to reliable water sources poses a risk of cross-contamination. 27 Similar findings in India during agricultural activities, most farmers practice open defecation and are exposed to contaminated water sources 28 and drink from nearby rivers. 29 Pastoralists residing in water-scarce areas could lead to limited access to reliable water sources, increasing the risk of cross-contamination. Additionally, the lack of proper sanitation facilities in farming areas contributes to cholera risk. This study is similar to the study done in Ethiopia in pastoralist communities
In our study, we found that proper latrine utilization significantly reduces the risk of cholera. Respondents who reported good or very good latrine utilization faced a lower risk of cholera infection compared to those with low latrine utilization. These findings align with a similar study conducted in India, where cholera outbreaks were linked to fecal contamination of water sources and open defecation. 30 Proper latrine use prevents fecal contamination of water sources, which is crucial in preventing cholera outbreaks. Open defecation can lead to contamination, emphasizing the importance of sanitation facilities. Despite progress in safe drinking water access and improved sanitation, significant disparities in water coverage and latrine utilization persist in affected districts. This implies that unequal access to clean water and sanitation facilities may contribute to varying cholera risks. Addressing these disparities is essential for effective prevention. Additionally, a study conducted in Ethiopia and Ghana identified an increased risk of cholera among individuals who practiced inconsistent handwashing after using the toilet.31,32 Other findings in Nigeria and Kenya also indicate that good hand hygiene was found to be protective.33,34 This implies that proper handwashing reduces the risk of contamination from germs, including cholera. Promoting proper latrine utilization, addressing disparities in water access, and emphasizing good hand hygiene are essential strategies to prevent cholera transmission
Long-term solutions for cholera control lie in economic development, specifically through universal access to safe drinking water and adequate sanitation. 19 This study revealed that inadequate access to safe water significantly increases the risk of cholera infection. Specifically, individuals with poor or very poor access to safe water are more likely to contract cholera compared to those with good or very good access. This correlation highlights the critical importance of improving water infrastructure and ensuring that all communities have reliable access to clean water. Studies conducted in Kenya and Tanzania also support these findings, highlighting a consistent pattern across different regions.27,34 The data from these studies reinforce the argument that better water accessibility reduces the likelihood of cholera outbreaks. Ensuring that all households have access to safe and reliable water sources is critical for preventing cholera transmission.
Understanding the mode of cholera transmission is crucial for effective prevention. Our study findings indicate that individuals with poor knowledge about cholera transmission were less likely to have cholera cases. This contrasts with studies conducted in Kenya, Tanzania, and Ethiopia, where knowing the mode of transmission was reported as a protective factor.27,29,34 The timing of data collection, interviewing cases after discharge versus at the time of admission, may explain this discrepancy. Treated cholera cases were more educated about the mode of transmission compared to the control group.
The impact of information access on cholera risk is substantial. Improving information dissemination plays a crucial role in preventing cholera outbreaks. The study investigated the relationship between information sources, access indexes, and cholera infection risk. Results indicate that low information access is associated with higher odds of being a cholera case. However, high and very high information access did not show significant differences in odds compared to the control group. These results are consistent with those that have been reported by other studies.23-25 Emphasizing the need to ensure accurate and timely information reaches communities for effective cholera prevention and control. Strengthening communication strategies and leveraging diverse media channels can enhance public awareness and mitigate cholera risk.
Our study has identified several limitations. First, Vibrio cholerae was isolated from only 5 cases in each district, while others were included based on case definitions. This inclusion method may have inadvertently included non-cholera cases, potentially affecting the measure of effect. This study involved laboratory confirmation, and the majority was based on case-defined case identification; however, potential misclassification of cases as controls is a possible limitation, as most cholera cases are asymptomatic and retrospective nature of the questions may introduce recall bias.
Conclusions and Recommendations
This study identified several behavioral, individual, and socio-environmental factors associated with cholera infection. Notably, households with better education, proper latrine utilization, knowledge about transmission, and avoidance of raw food were associated with lower rates of cholera infection, while individuals engaged in farming or pastoral occupations were associated with higher rates of infection. To enhance cholera prevention and control, targeted interventions, such as improving education, sanitation, water infrastructure, and public awareness.
Footnotes
Appendix
Overall Summary of Index Variable Calculation Procedure.

| Index variables | Categories | Categories label | Indicator variables | Remark |
|---|---|---|---|---|
| Knowledge of transmission modes | 1. Zero correct response 2. at least one or two correct responses 3. More than three correct responses |
1. Poor knowledge 2. Fair knowledge 3. Good knowledge |
1. Contaminated food 2. Contaminated hands 3. Contaminated water 4. Contact with cholera cases |
Yes, no question |
| Toilet utilization index | 1. Zero correct response 2. At least one or two correct responses 3. Three correct responses 4. More than three correct responses |
1. Very poor 2. Poor 3. Good 4. Very good |
1. Toilet use 2. Walk way 3. Rinsing water 4. Availability flies 5. Availability of defecation 6. Availability spider web 7. Number of latrine users 8. Material for anal cleansing 9. Availability of washing facilities near the latrine 10. When do you wash your hands? 11. Materials for hand washing? 12. How often wash your hands after toilet? 13. How often wash your hands before a meal? |
Quartile categorization was used for the index variable |
| Latrine availability index | 1. Zero correct response 2. At least one or two correct responses 3. Three correct responses 4. More than three correct responses |
1. Very poor 2. Poor 3. Good 4. Very good |
14. Do you have a toilet? 15. What types of toilets do you have? 16. Conditions of cleanliness? |
Weight is assigned accordingly |
| Safe water accessibility index | 1. Zero correct response 2. At least one or two correct responses 3. Three correct responses 4. More than three correct responses |
1. Very poor 2. Poor 3. Good 4. Very good |
Family sources of water. Water source for washing utensils. The time it takes to fetch water. Use treated water for domestic purposes. |
Weight is assigned accordingly |
| information source and access index | 1. Zero correct response 2. At least one or two correct responses 3. Three or more correct responses |
1. Low 2. High 3. Very high |
Television Radio Social media Health extension worker Peers News paper Phone message Religious leader School community |
Different weight was given for each of the variables |
The comprehensive summary of index variables was derived from an extensive review of various literature and insights from high-level experts.
Acknowledgements
We are extremely thankful to the Oromia Health Bureau, Fenot project, West Arsi, Guji, Bale, and East Bale zone health departments for their support in realizing this research project. Last but not least, we thank pubic health emergency management and the health research directorate colleagues for their unreserved support during this research project.
Ethical Considerations
Ethical clearance was obtained from the Ethical Review Board (ERB) of the Public Health Emergency Management and Research Directorate at the Oromia Health Bureau. Local government permission was secured during the response, and all respondents provided verbal consent. We documented their agreement to participate in the study by marking ‘yes’ in the introduction/consent section of the questionnaire. Confidentiality of records was strictly maintained and accessible only to the investigators.
Author Contributions
BKS brought the idea and prepared the proposal. BKS, ZB, YD, LA, TD, and DG carried out the data analysis and interpretations. BKS, ZB, YD, LA, TD, DG, BD, TT, AT, TK, CB, GS, and YK prepared the initial draft of the manuscript. Finally, all of the authors reviewed and approved the manuscript. BKS and ZB made final corrections to the manuscript.
Funding
The authors received no financial support for the research, authorship, and/or publication of this article.
Declaration of Conflicting Interests
The authors declared no potential conflicts of interest with respect to the research, authorship, and/or publication of this article.
Data Availability Statement
The data sets used in this study are available from the corresponding author on reasonable request.
Disclaimer
The authors of this paper are solely responsible for the findings, recommendations, and conclusions reported in it.