
Abstract
The environmental radiation levels in Anambra South Senatorial District were evaluated through in situ measurements using a well-calibrated nuclear radiation meter (Radalert-100TM). A Global Positioning System (GPS) was utilized to record the exact coordinates of the selected locations. A total of 170 sampling locations were surveyed across the district. The average exposure rate across the district was measured as 0.0123 ± 0.0003 mRh−1. The overall average values for the absorbed dose rate (ADR), equivalent dose rate (EDR), annual effective dose equivalent (AEDE), and excess lifetime cancer risk (ELCR) were 106.35 ± 2.82 nGyh−1, 1.03 ± 0.03, 0.131 ± 0.004 mSvy−1, and 0.459 ± 0.003 × 10⁻³, respectively. The findings indicate that the average exposure rates in the district were within the international threshold of 0.013 mRh−1 established by the International Commission on Radiation Protection (ICRP), suggesting that the region is generally safe for human habitation. However, the calculated radiological hazard indices, particularly ADR and ELCR, exceeded the permissible limits of 84 nGyh−1 and 0.29 × 10⁻³, respectively. While these elevated values do not pose an immediate radiological health threat, continuous exposure over a lifetime may present a significant risk to the population.
Introduction
Radiation exposure is an intrinsic aspect of life on Earth, originating from both natural and anthropogenic sources. Naturally occurring radioactive materials (NORM) are present in the Earth’s crust, atmosphere, and biosphere, leading to continuous background radiation exposure.1,2 Primary natural sources include cosmic rays and radionuclides such as Uranium-238, Thorium-232, and Potassium-40, which have half-lives comparable to the Earth’s geological timescale. These elements are pervasive, found in water, soil, flora, fauna, and even in certain foods consumed by humans.3,4
Human activities have augmented environmental radiation levels, resulting in Technologically Enhanced Naturally Occurring Radioactive Materials (TENORM). Industries such as mining, mineral extraction, fossil fuel combustion, and the application of phosphate fertilizers contribute significantly to this enhancement.5,6 In the Anambra South Senatorial District, activities like artisanal mining, agricultural practices involving phosphate fertilizers and improper waste disposal are potential contributors to elevated radiation levels. Additionally, medical procedures involving radionuclides and the use of radiological equipment in healthcare facilities further exacerbate exposure risks.
Exposure to elevated radiation levels can lead to a spectrum of health effects, ranging from acute conditions like radiation sickness to chronic diseases such as cancer, cardiovascular disorders, and even genetic mutations in extreme cases.7,8 The severity of these effects is influenced by the dose, type, and duration of exposure. Regulatory thresholds are essential to mitigate these risks, emphasizing the importance of monitoring and controlling radiation levels in various environments. 9 While radiation cannot be entirely eradicated, mitigation strategies such as minimizing exposure time, maintaining distance from radiation sources, and employing appropriate shielding have proven effective.1,10
This study focuses on the Anambra South Senatorial District of Anambra State, Nigeria, where geological formations and human activities may influence radiation levels. To map the radiation distribution in the selected area, the research employed in-situ radiation mapping techniques using portable hand-held detector to take measurement of the environmental radiation levels. By assessing the population’s exposure to background ionizing radiation, the study aims to evaluate radiation hazard risk indices. The findings will inform public health policies and community awareness efforts, emphasizing strategies to reduce exposure and safeguard public health.3,11 Understanding the local radiation profile is essential for enhancing radiation safety and management, as well as informing policies tailored to the region’s unique challenges.1,12
Materials and Methods
Study Area
The study area is Anambra South Senatorial District (shown in Figure 1) located in Anambra State, Southeast Region of Nigeria. It lies between latitude 5044′01.4180″N and 6013′34.7312″N and longitude 7020′20.4132″E and 6047′08.2053″E. The district covers about 1320 of the 4887 km2 area of Anambra State.13,14 The region contains typical semitropical rainforest vegetation with freshwater swamps. It has a humid environment with average annual temperatures of 30.6°C and yearly rainfall ranging from 152 to 203 cm. 15 The predominant season in the senatorial district is rainy season which takes place from April to November while dry season is from December to March. The yearly rainfall in the senatorial district ranged from 1500 to 2200 mm with a mean temperature of about 26.40°C which produces a relative humidity of 75%. The Anambra South Senatorial District in Nigeria is characterized by sedimentary formations, primarily consisting of the Anambra Basin, which includes shale, sandstone, and coal deposits. These formations are geologically significant due to their potential enrichment in uranium, thorium, and potassium-bearing minerals, which are sources of Naturally Occurring Radioactive Materials (NORM).16,17 The area is part of the Lower Benue Trough, with formations such as the Nkporo Shale, Mamu Formation, and Ajali Sandstone. These formations are rich in mineral resources, including limestone and lignite.18,19
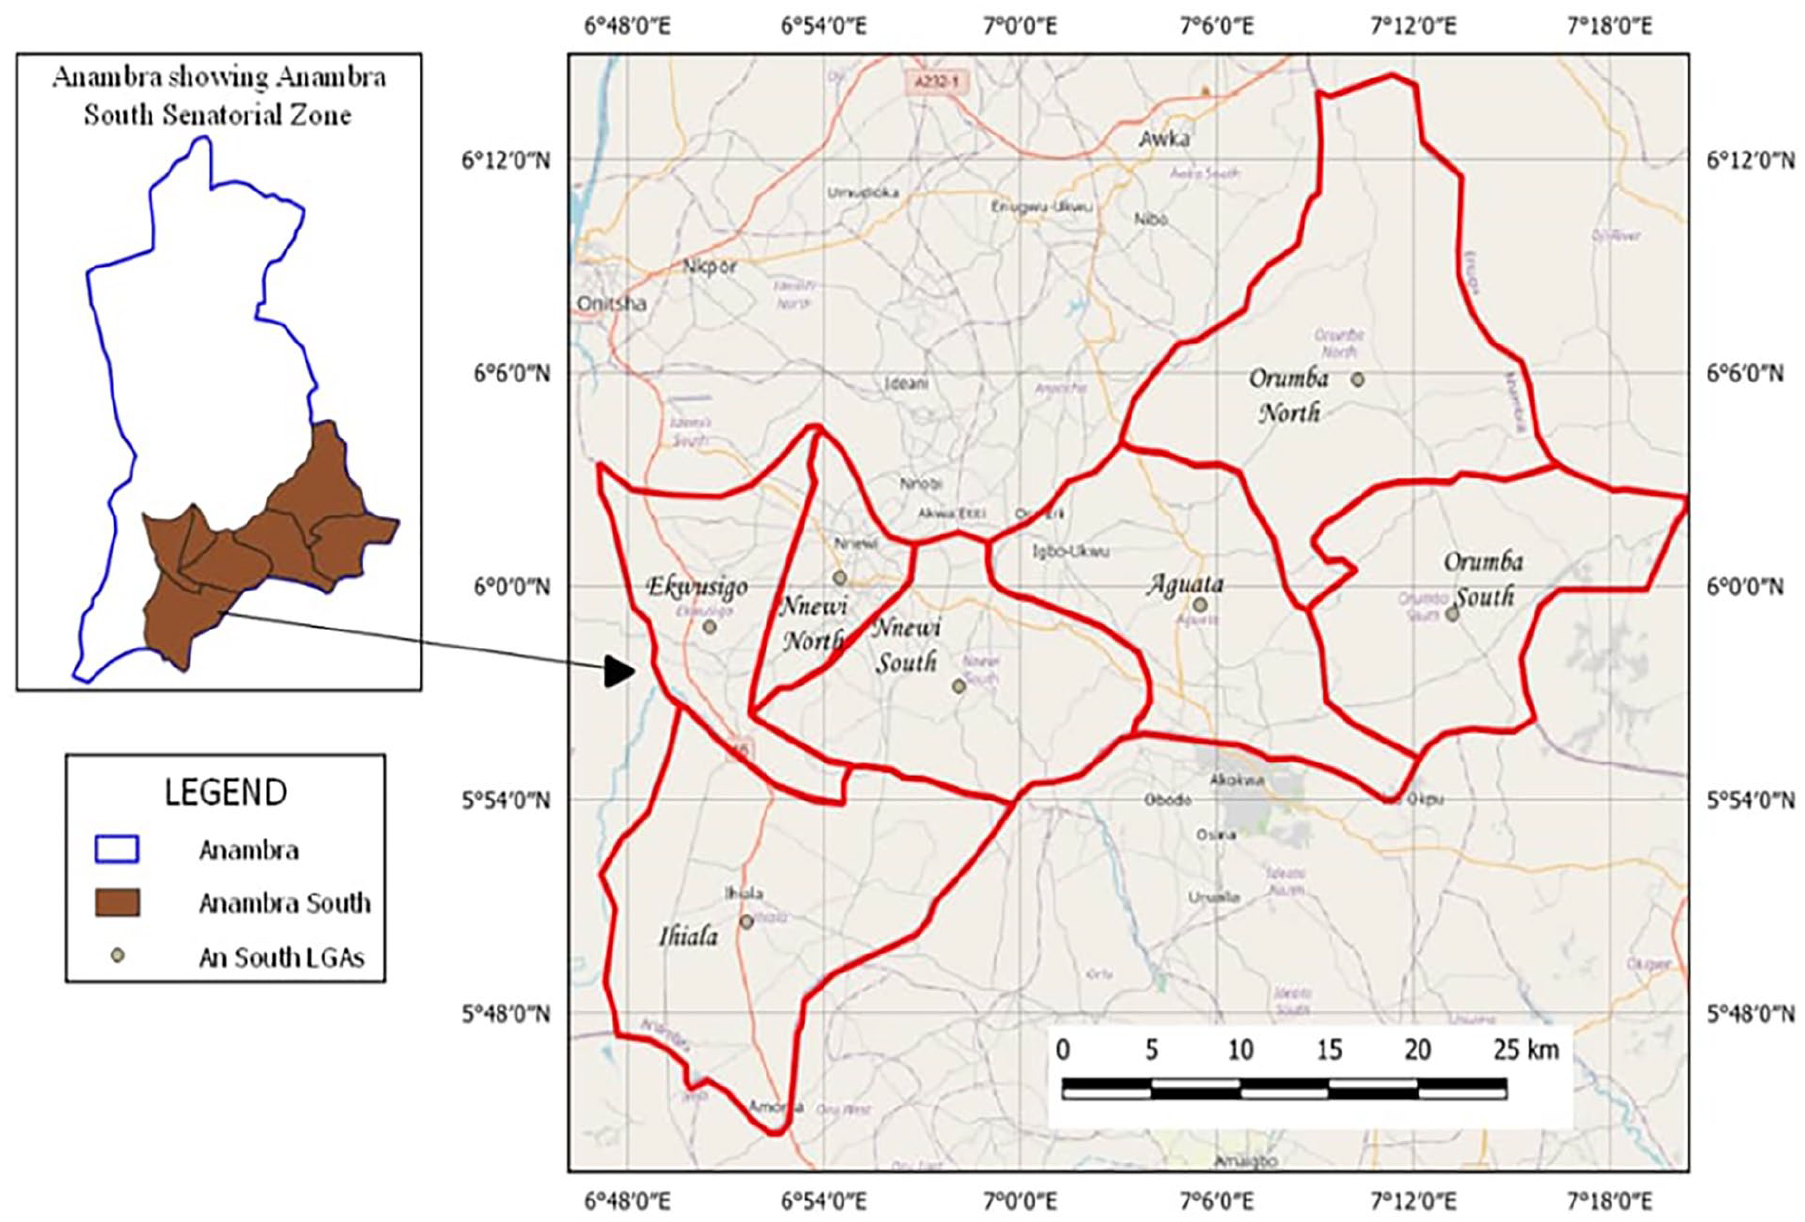
Map of Anambra South Senatorial District.
Methods
This study employed in-situ measurements to determine the terrestrial outdoor radiation exposure rate. To ensure that the sample locations retained their original environmental characteristics, measurements followed a conventional technique. This involved positioning the detector tube at a height of 1.0 m above ground level and orienting its window toward the area of interest. 20 The tube was kept at 1.0 m to minimize interference from surface emissions and to approximate the average height of vital human organs such as the gonads and thoracic region, which are sensitive to ionizing radiation.7,21 some sensitive human body such as the chest or head areas can be exposed to outdoor radiation at this height.
A total of 170 sampling locations were surveyed across the district. Five locations were randomly selected from each of the 5 towns within each Local Government Area (LGA), and their precise coordinates were determined using Geographical/Global Positioning System (GPS) technology. The GPS readings were recorded in decimal degree (DD) format, which is compatible with Geographic Information System (GIS) software.
The radiation exposure rate was measured using a Radalert-100 meter. The Nuclear Radiation Monitor used is a portable and properly calibrated nuclear radiation monitoring meter- Radalert 100X™ (referenced to Cesium-137 detector, model R100x) Geiger Counter, manufactured by Medcom, Inc. USA. The calibration was done for approximately a year by the National Institute of Radiation Protection and Research (NIRPR) on the 12th of October, 2021 with the due date of 11th October, 2022, with a serial number: X02848 and the research were carried out in November 2021, a month after the calibration was done. At each sampling point, the radiation exposure rate was measured 3 times. The average of these 3 measurements was calculated to determine the final exposure rate. The radiation exposure rate, initially recorded in micro Sieverts per hour (μSvh−1), was converted to milli Roentgens per hour (mRh−1) by multiplying the measured value by 0.1.
Measurements were conducted between 10:00 AM and 4:00 PM, as recommended by the National Council on Radiation Protection and Measurements, 22 since environmental conditions such as solar radiation intensity, ambient temperature, and humidity are relatively stable between 10:00 a.m. and 4:00 p.m., which enhances the accuracy and consistency of radiation meter readings.10,23 in addition some are calibrated to be more sensitive to certain environmental factors that varies throughout the day and therefore operate at peak efficiency leading to better performance during the day light period. To account for potential environmental fluctuations, readings were taken at 4-minute intervals. 23
The collected exposure rate data were quantitatively computed with their standard deviation subsequently and analyzed to assess radiation health risks to the surrounding population. In addition, the radiation health risk indices corresponding to the radiation exposure rates were calculated using Radiation models. Absorbed Dose Rate (ADR), Annual Effective Dose Equivalent (AEDE), Equivalent Dose Rate (EDR), and Excess Lifetime Cancer Risk (ELCR), were calculated using established formulas
Absorbed Dose Rate (D)
The BIR values gotten for outdoor exposure rate in milli-Roentgen per hour (mRh−1) were transformed into absorbed dose in nGyh−1 by applying the conversion factor. 24

Since the exposure rate is in mRh−1, equation (1) becomes

Annual Effective Dose Equivalent (AEDE)
The annual effective dose equivalent was calculated using the computed absorbed dose rates and it is given by Ononugbo and Nte 25 as

Where 8760 is the number of hours in a year, 0.7 SvGy−1 is the dosage conversion factor from the absorbed dose in the air to the effective dose and 0.25 (6 hours out of 24) is the occupancy factor for outdoor exposure. 24
Excess Lifetime Cancer Risk (ELCR)
The ELCR was calculated from the AEDE using the equation. 26

DL represent the average life expectancy/duration of life (70 years’) and RF denote the fatal cancer Risk Factor (Sv) that is, deadly cancer risk per Sievert (Sv−1). 27 For probability effects, ICRP 106 and 60 used a figure of RF = .05 for the whole masses.25,28
Equivalent Dose Rate
In order to assess the equivalent dose rate over 1 year period, the recorded exposure rate were transformed to absorbed dose rate using equation (5) below as given by the NCRP for equivalent dose and as used by Ononugbo et al 29 .

Data were analyzed using Microsoft Excel for statistical computations and Surfer-GIS and ArcGIS 10.7 for contour and radiometric mapping. Sampling locations were geo-referenced, and point features were used to represent radiation exposure rates on maps. Standard deviations were calculated to assess data variability.
Results and Discussions
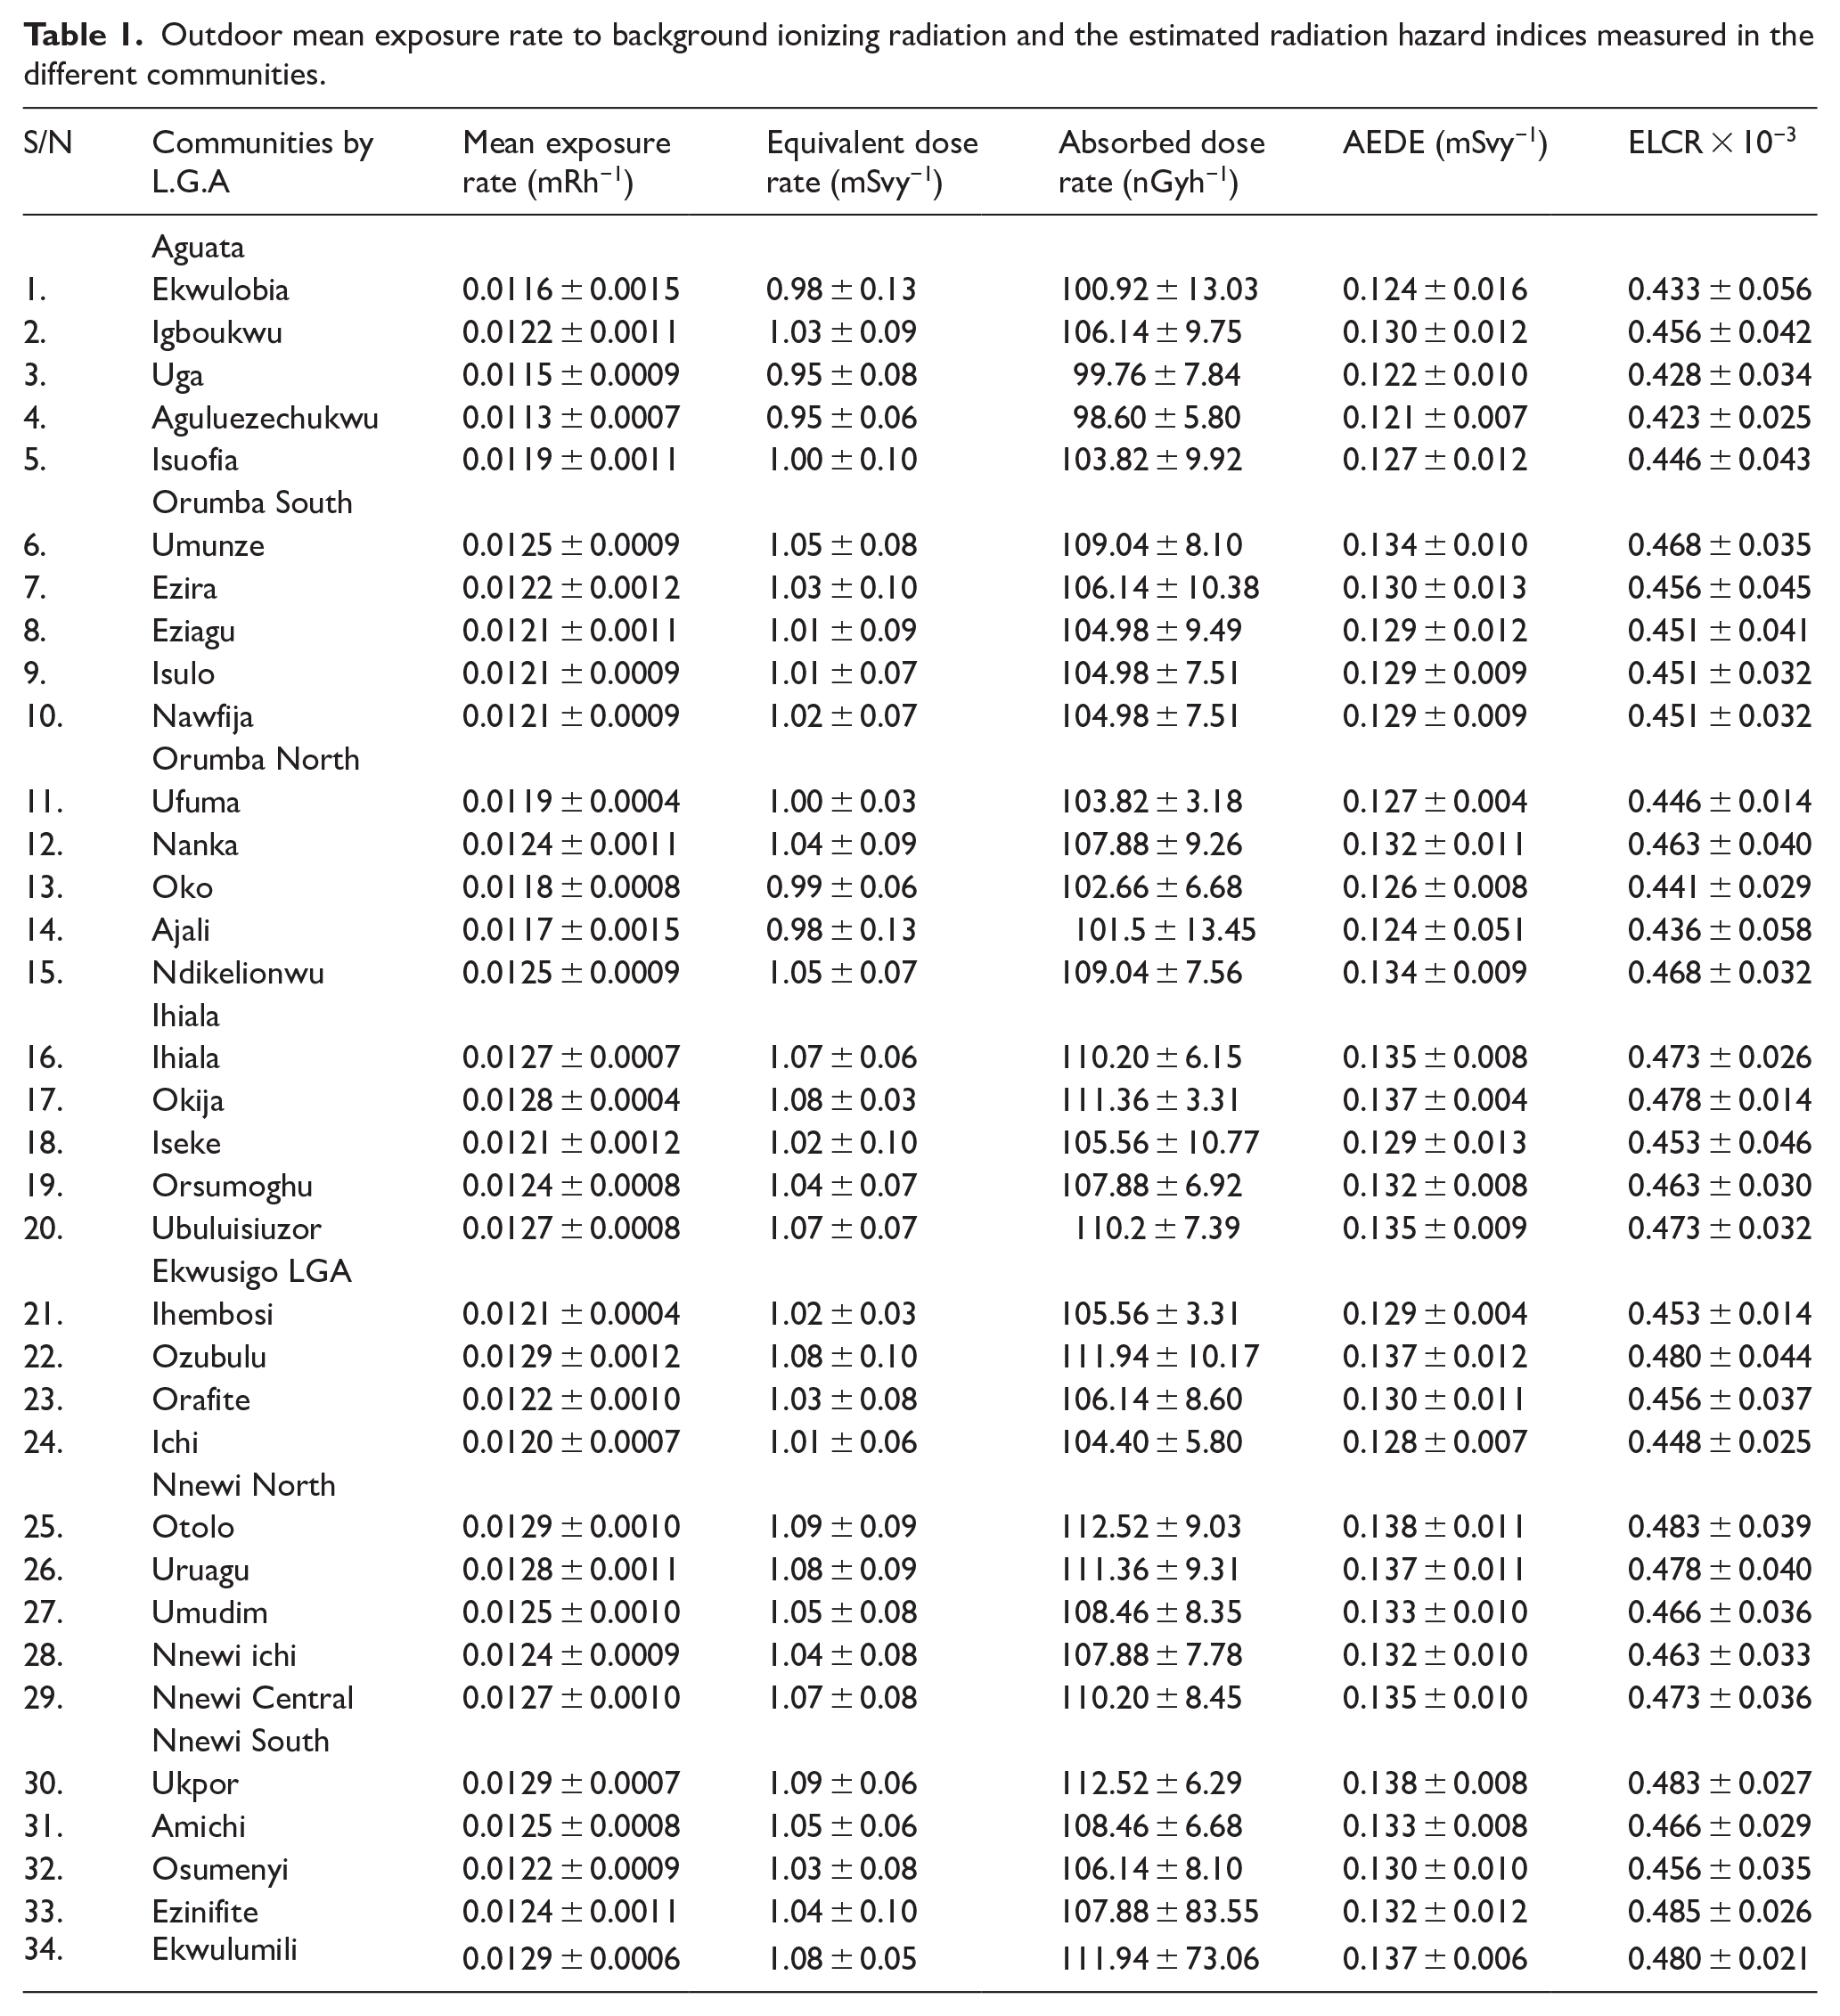
An in-situ background ionizing radiation measurement were carried out within the Anambra South Senatorial district using RadAlert 100 m. The measured radiological parameters were compared with the International Commission on Radiological Protection (ICRP) recommended limits and values reported in related studies. These parameters (shown in Table 1) include the average exposure rate, equivalent dose rate, absorbed dose, annual effective dose equivalent (AEDE), and excess lifetime cancer risk (ELCR). The GPS coordinates and a 3-Dimensional Arc-GIS Radiation map showing the background ionizing radiation (BIR) measurements for the sites are presented in Figure 2, while a comparison of the outdoor radiation exposure rate with ICRP standard is shown in Figure 3.
Outdoor mean exposure rate to background ionizing radiation and the estimated radiation hazard indices measured in the different communities.

A 3-dimensional arc-GIS radiation map showing the BIR measurement (mRh−1) of Anambra South senatorial district, Nigeria.

A barchart of the outdoor radiation exposure rate with ICRP standard in Anambra South Senatorial District.
Mean Exposure Rate
The mean exposure rate recorded in this study was found to be 0.0123 ± 0.0003 mRh−1, which is 5.38% lower than the ICRP recommended limit of 0.013 mRh−1. This percentage deviation provides a clearer understanding of the relative safety margin. The obtained results from the in-situ measurement of background ionizating radiation in Aguata local government area varied from 0.0113 to 0.0122 mRh−1 with an average value of 0.0117 ± 0.0010 mRh−1. In Orumba South L.G.A, this value ranged from 0.0121 to 0.0125 mRh−1 with average value of 0.0122 ± 0.0002 mRh−1; In Orumba North L.G.A, the BIR ranged from 0.0117 to 0.0125 mRh−1 with an average value of 0.0121 ± 0.0004 mRh−1; in Ihiala L.G.A, the BIR ranged from 0.0121 to 0.0128 mRh−1 with average values of 0.0123 ± 0.0003 mRh−1; in Ekwusigo L.G.A, the BIR ranged from 0.0120 to 0.0129 mRh−1 with an average value of 0.0123 ± 0.0004 mRh−1; in Nnewi North L.G.A, the BIR ranged from 0.0124 to 0.0129 mRh−1 with an average value of 0.0127 ± 0.0002 mRh−1; and in Nnewi South L.G.A, the BIR ranged from 0.0122 to 0.0129 mRh−1 with average value of 0.0126 ± 0.0003 mRh−1. These results are all shown in Table 1.
From the results, the exposure rates were found to be lowest in Aguata LGA whereas the maximum exposure rates were found in Nnewi North and Nnewi south LGA as presented in Table 2. The high exposure rates found within the Nnewi north and Nnewi south area could be as a result of myriads of manufacturing industries and stones quarry sites within the districts respectively.
Anambra South Senatorial District total outdoor mean exposure rate and their radiation hazard risk parameters measured by each L.G.A.

These outdoor exposure rates for LGAs, Aguata, Orumba south, Orumba north, Ihiala, Ekwusigo, Nnewi north, and Nnewi south, are illustrated in Figures 4 to 10 respectively as contour maps. The regions on the contour map with very close contour lines represents dense distribution of background ionizing radiation, while regions with sparse spacing represents regions with less dense distribution of background ionizing radiation. The colors from the bottom to the top of the key band show values that are below the 0.013 mRh−1 standard which change gradually as the value of BIR increases to the ICRP value. The red colors on the contour maps show values that are above the ICRP values. Figure 11 shows the overall distribution pattern of background ionizing radiation of the 7 LGAs in the Anambra South Senatorial district considered in this study.
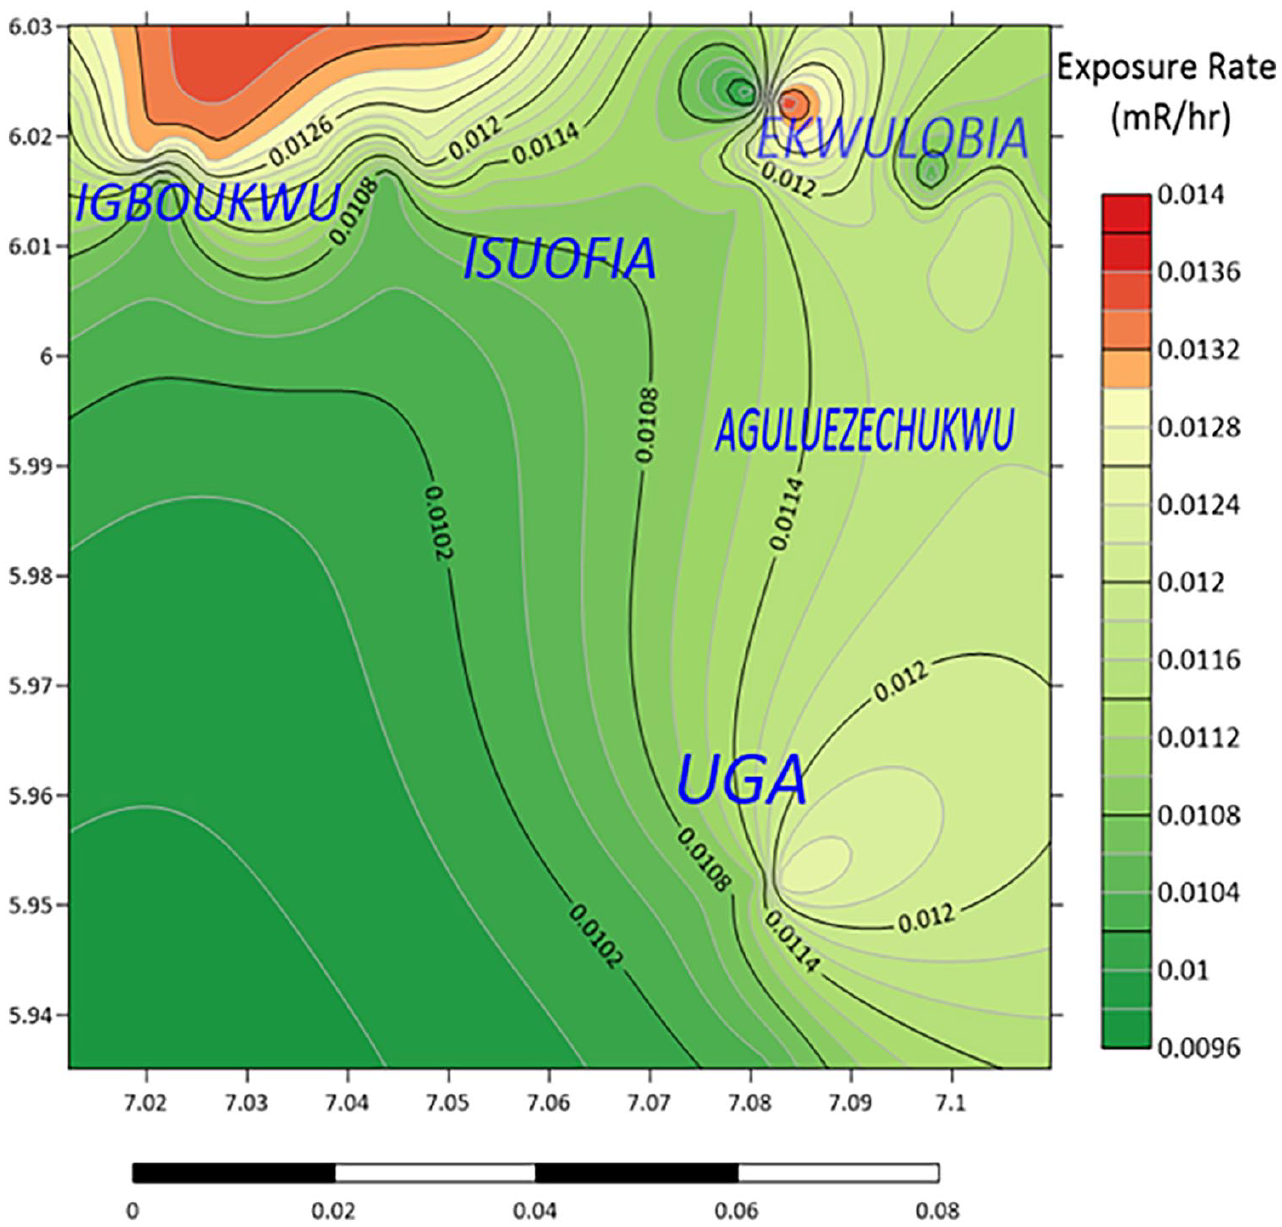
Contour map of outdoor exposure rate in Aguata LGA.
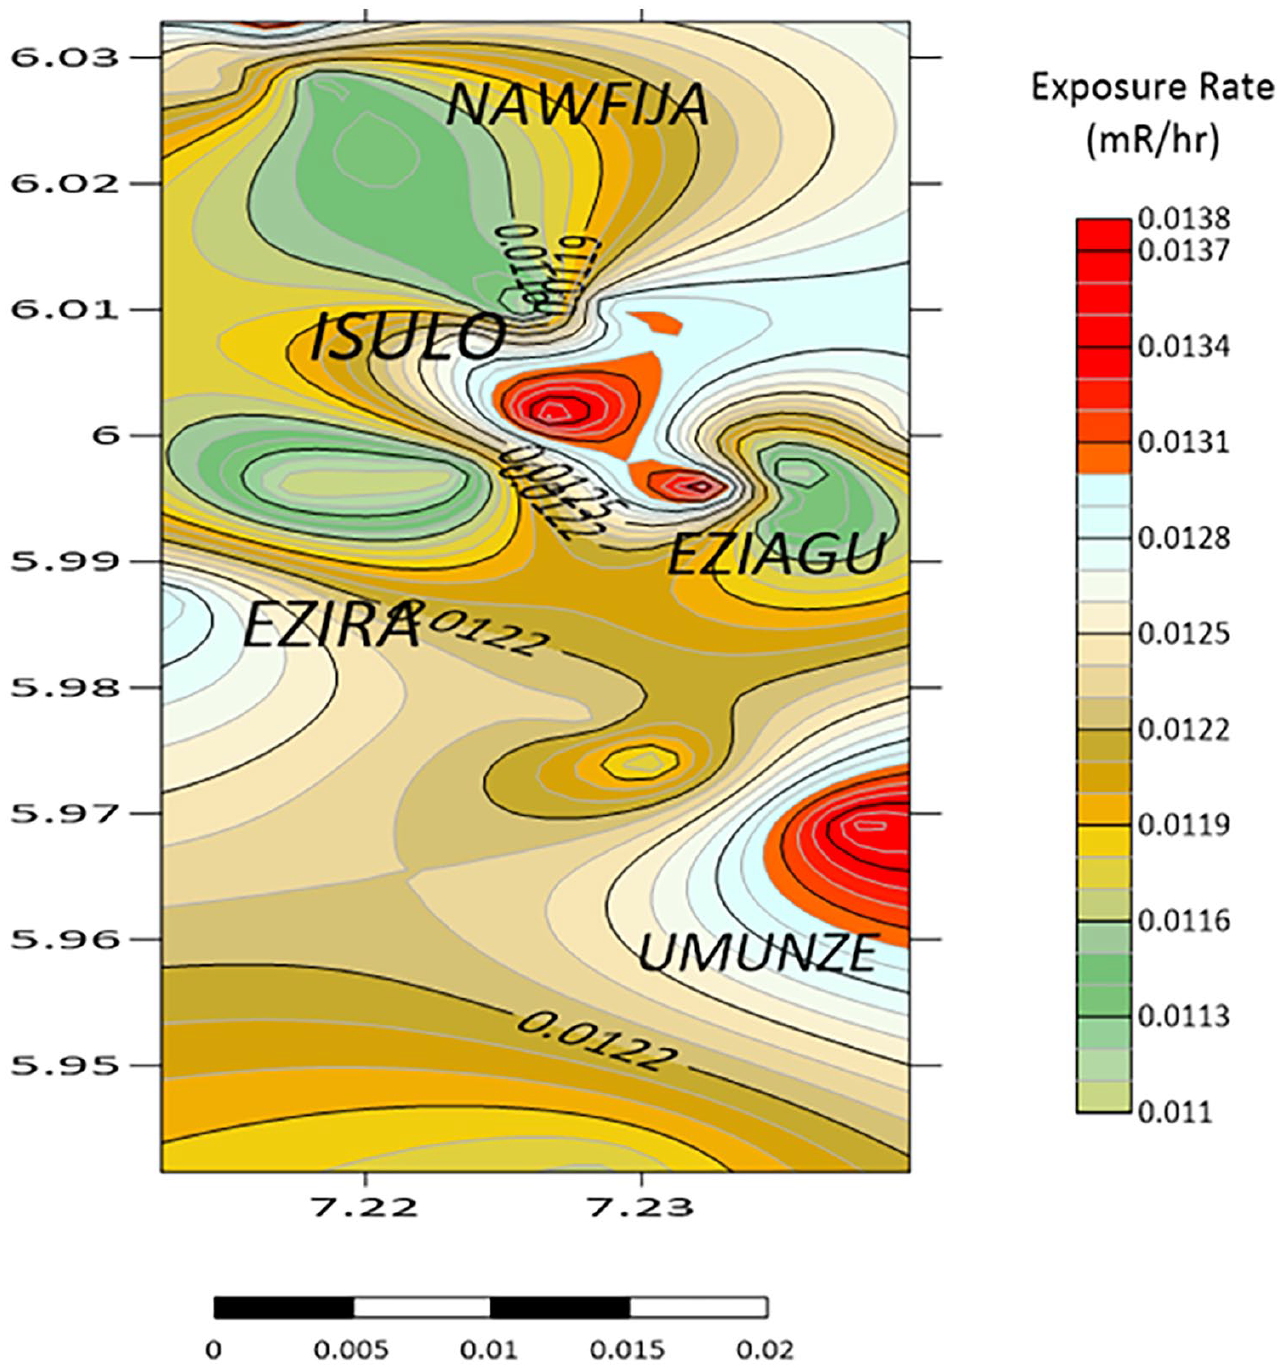
Contour map of outdoor exposure rate in Orumba South LGA.
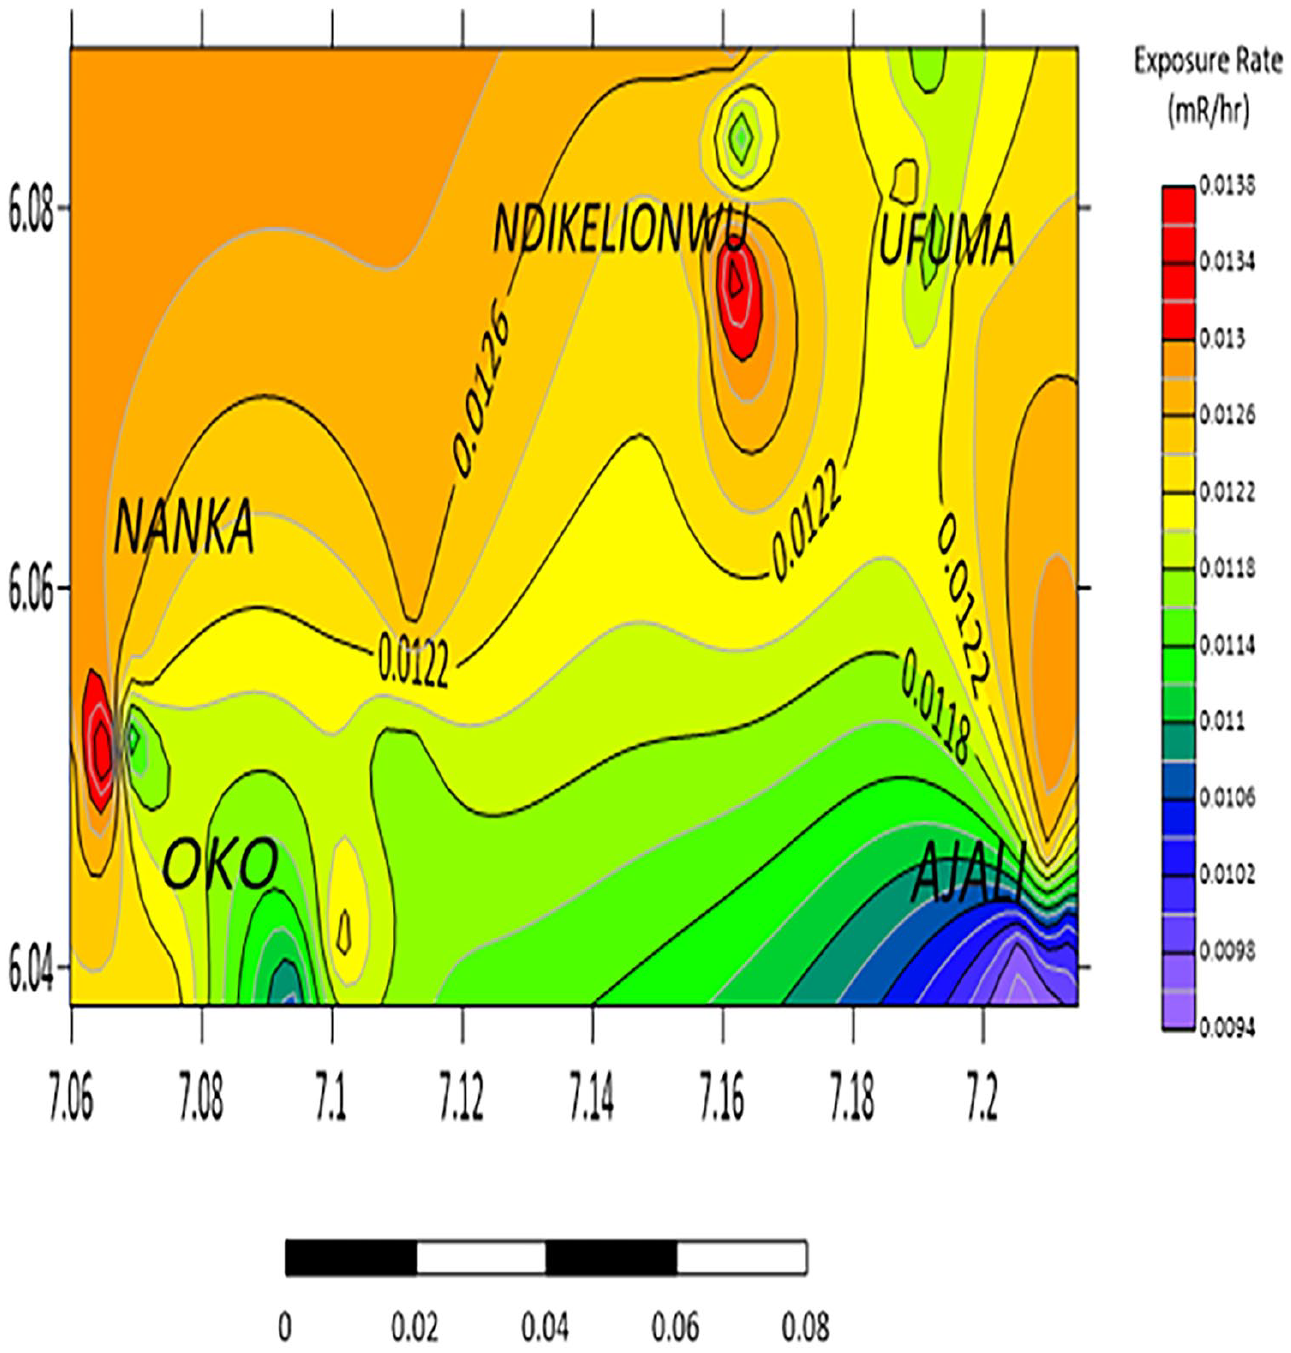
Contour map of outdoor exposure rate in Orumba North LGA.
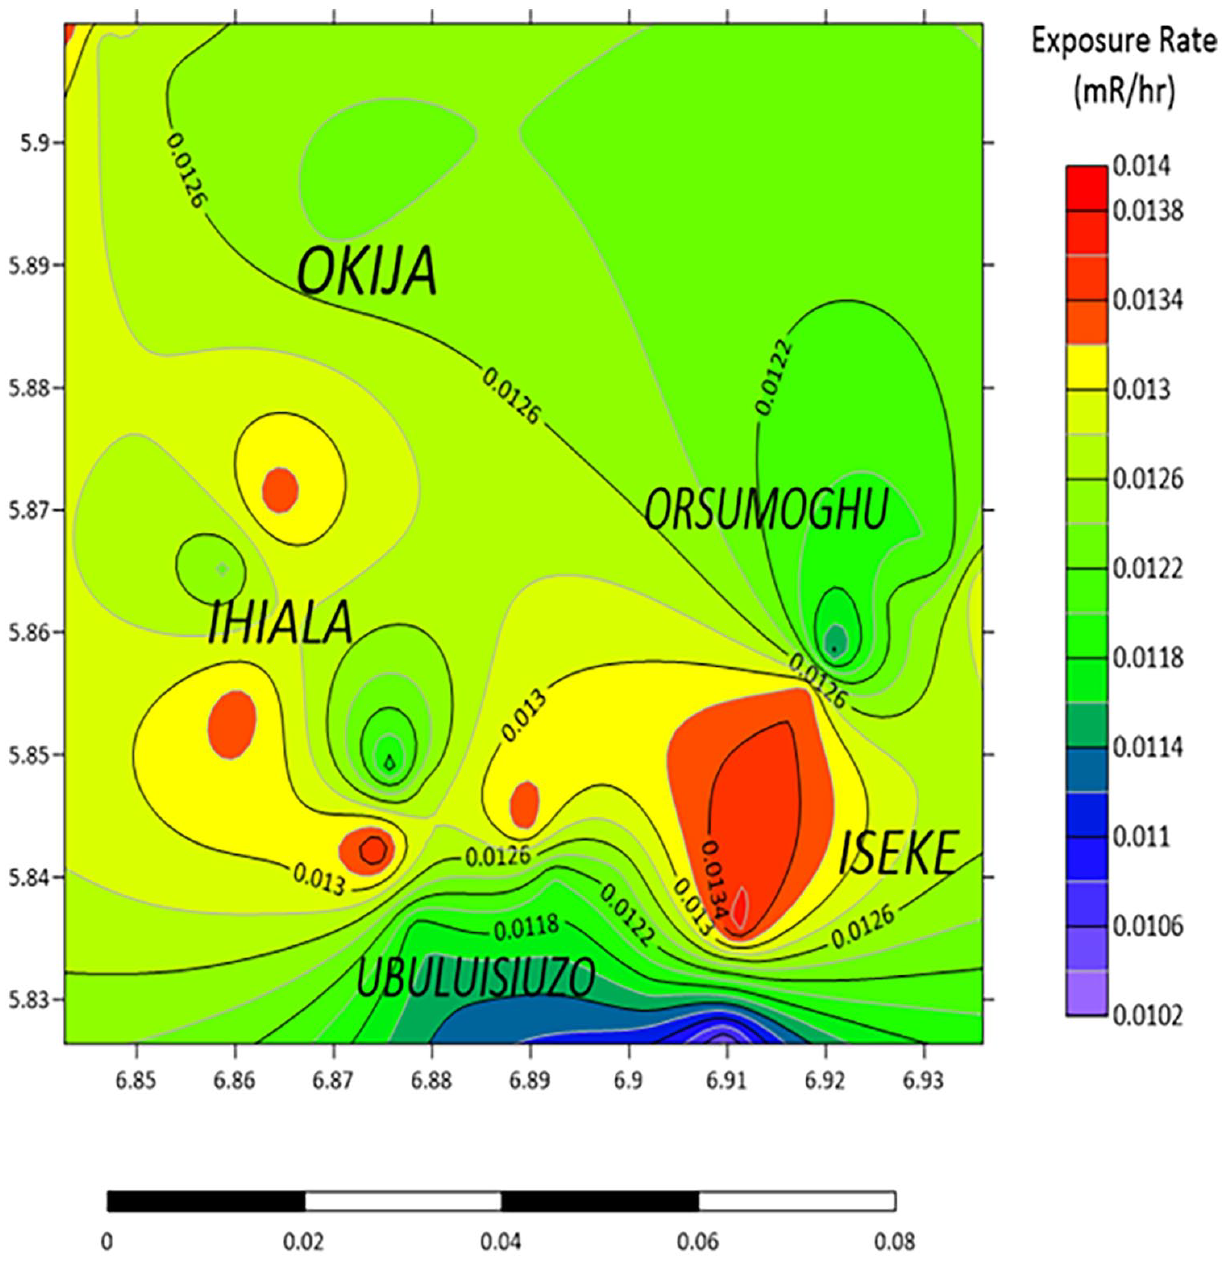
Contour map of outdoor exposure rate in Ihiala LGA.
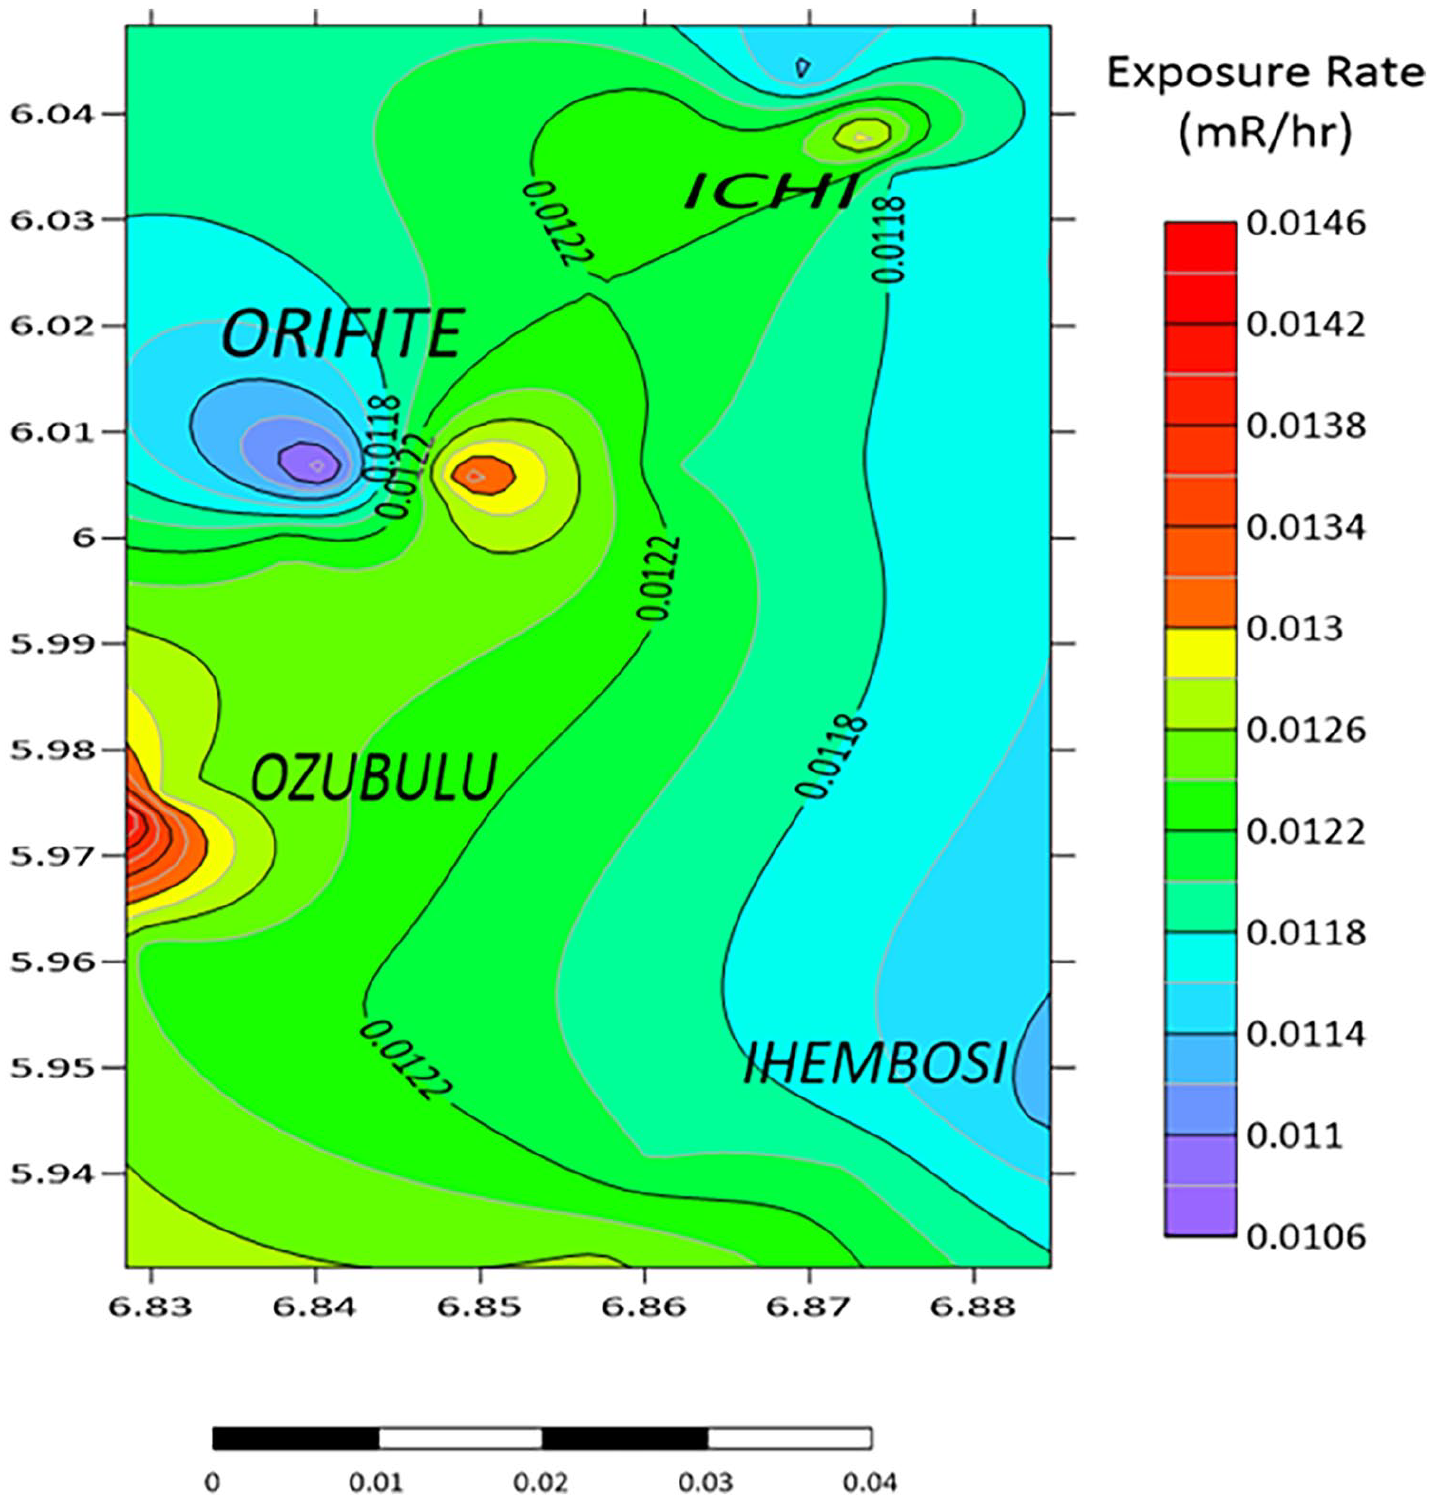
Contour map of outdoor exposure rate in Ekwusigo LGA.
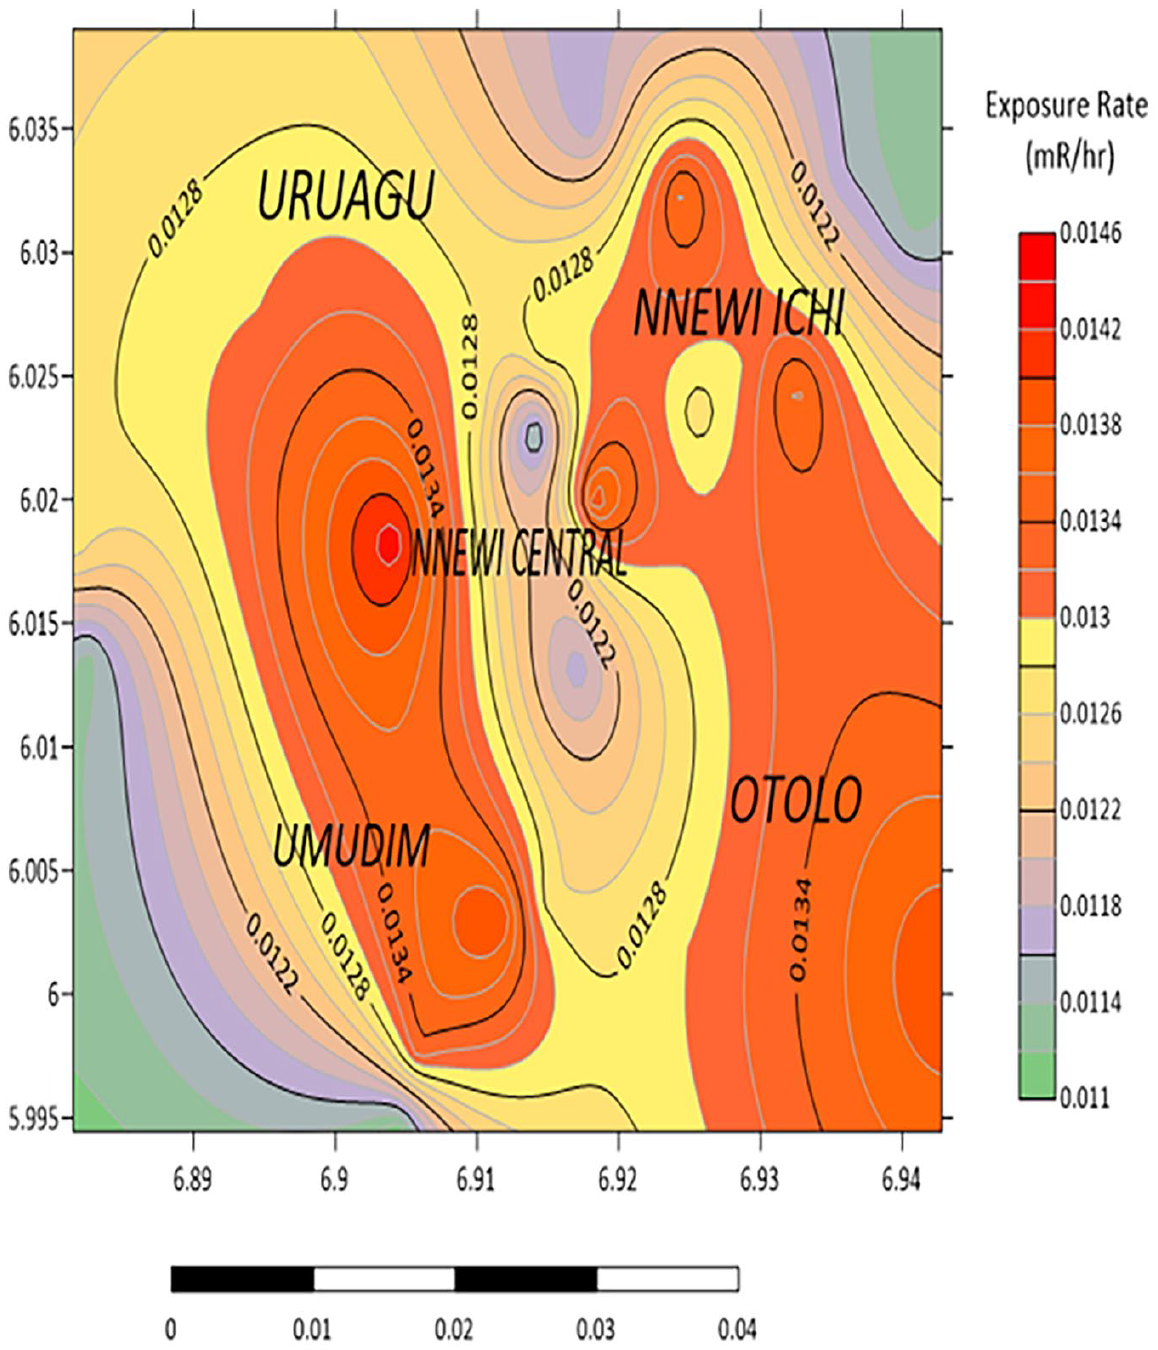
Contour map of outdoor exposure rate in Nnewi North LGA.

Contour map of outdoor exposure rate in Nnewi South LGA.

Contour map of outdoor exposure rate in Anambra South Senatorial district.
The mean exposure rate of 0.0123 ± 0.0003 mRh−1, recorded from this research is comparable to values from several studies, such as Muhammed et al 30 in Shanu Village (0.0128 mRh−1) and Ugbede 24 in Ebonyi State (0.0145 ± 0.0017 mRh−1). However, the exposure rate in this study is lower than those reported in other regions like Ebonyi State by Onwuka and Ononugbo 31 , who observed an exposure rate of 0.026 ± 0.005 mRh−1, indicating that certain areas may be exposed to higher levels of natural background radiation.
Equivalent Dose Rate
The equivalent dose rate in this study (1.03 ± 0.03 mSv−1) is slightly above the ICRP’s recommended limit of 1.00 mSv−1 but falls within a range similar to other regions such as Agbalagba et al 32 in Enugu State (1.43 mSv−1) and Ugbede 24 in Ebonyi State (1.22 mSv−1). These findings suggest that the radiation levels in the study areas are generally within acceptable limits, but some regions exhibit slightly elevated radiation exposure.
Absorbed Dose Rate
The absorbed dose rate in this study was 106.35 ± 2.82 nGyh−1, which is slightly higher than the global average of 84 nGyh−1 33 possibly due to radioactive contamination from improper disposal of radioactive waste which will lead to contamination of land and water sources. However, this absorbed dose is within the range reported by Ugbede 24 which was 128.33 ± 15.65 nGyh−1 and Agbalagba et al 32 132.16 ± 24.36 nGyh−1, indicating a moderate level of exposure to natural radiation. The absorbed dose from the study is lower than that observed in regions with high exposure, such as Ebonyi State, 34 where a dose of 228.38 nGyh−1 was recorded. This variation suggests the importance of geographical and environmental factors in influencing the radiation levels in different areas.
Annual Effective Dose Equivalent (AEDE)
The AEDE in this study was 0.131 ± 0.004 mSv−1, which is well below the ICRP’s recommended public exposure limit of 1.00 mSv−1. This value is lower than the AEDE reported in other studies, such as Agbalagba et al 32 (0.16 mSv−1) and Onwuka and Ononugbo 31 (0.28 mSv−1), but is higher than those reported by studies like Ekong et al 35 in South-South Nigeria (0.05 mSv−1) and lower than what Jafari et al 36 obtained in Iran (0.64 mSv−1).
Excess Lifetime Cancer Risk (ELCR)
The ELCR for this study was 0.459 ± 0.013 × 10⁻³, which is slightly greater compared to the ICRP’s limit of 0.29 × 10−3 by 0.169, possibly due to higher natural radiation level from geological formation such as uranium, thorium, and radon within the district, indicating chance of expected risk of cancer from radiation exposure. The value is slightly lower than values obtained in other studies, such as Ugbede 24 (0.551 ± 0.067 × 10⁻³) and Agbalagba et al 32 (0.56 ± 0.11 × 10⁻³), suggesting that the risk of cancer from natural radiation is moderate in the district. However, higher risks were observed in some studies, such as Onwuka and Ononugbo 31 (0.98 × 10⁻³) and Anekwe and Onoja 9 (0.810 × 10⁻³), showing the varying degrees of radiological hazard across different regions of Nigeria.
In summary, the results from this study when compared to the international studies fall within the ranges observed in various parts of the world. For example, Jafari and Bahmani 36 in Iran reported an exposure rate of 0.008 mRh−1, equivalent dose rate of 0.67 mSv−1, and an absorbed dose of 64.40 nGyh−1, which are significantly lower than those observed in this study, suggesting that different geographical and environmental conditions contribute to regional differences in radiation exposure. Also, Haghparast et al 37 in Southeast Iran observed relatively lower values for exposure rate (0.007 ± 0.002 mRh−1) and absorbed dose (60.97 nGyh−1) compared to this study.
Conclusion
This study successfully assessed the radiation exposure rate across the 7 LGAs of the Anambra South Senatorial District. The measurements revealed that although mean exposure values remain below the ICRP safety threshold, some derived hazard indices, such as ADR and ELCR, were elevated, indicating potential long-term radiological risks. These findings contribute critical data to the radiological profile of southeastern Nigeria and underscore the necessity for ongoing monitoring and policy interventions. by an in-situ measurement approach using a radalert 100TM meter and a global positioning system. The radiation health hazard parameters were computed from the measured dose rates using radiation models with the overall average values obtained for the absorbed dose rate (ADR), equivalent dose rate (EDR), annual effective dose equivalent (AEDE) and excess lifetime cancer risk (ELCR) to be 106.35 ± 2.82 nGyh−1, 1.03 ± 0.03 mSvy−1, 0.131 ± 0.004 mSvy−1, and 0.459 ± 0.003 × 10⁻³ respectively
By the help of computer software programs such as Microsoft Excel, Quantum Geographic Information System(QGIS® 3.16.8) and Golden Software Surfer®, the radiation map of Anambra South senatorial district was produced in Arc Map 10.7. The Map was geo-referenced and digitized in ArcGIS environment. From the results, the exposure to radiation levels in Anambra South Senatorial district, as measured in this study, were within safe limits according to the ICRP recommendations, the average exposure rate of 0.0123 ± 0.0003 mRh−1and AEDE of 0.131 ± 0.004 mSvy−1 values are lower compared to the recommended maximum thresholds of 0.013 mRh−1 by 0.0007 ± 0.0003 mRh−1 which is 5.38% lower and 1.00 mSvy−1 by 0.869 ± 0.004 mSvy−1 respectively. The findings, when compared with other studies both within and outside Nigeria, suggest that certain regions may experience elevated levels of natural background radiation due to the influence of geographical and environmental factors, showing the need for continued monitoring and mitigation measures, particularly in areas with higher radiation exposure.
Footnotes
Author Contribution
VCE participated in data collection, field survey, and manuscript drafting. CMA conceptualized the study, coordinated the research activities, and critically revised the manuscript. CPO contributed to the development of the methodology and supervised the data analysis. GOA provided technical guidance, reviewed the statistical methods, and ensured data integrity. REU assisted in GIS mapping and visualization of results. All authors read and approved the final manuscript.
Declaration of conflicting interests
The author(s) declared no potential conflicts of interest with respect to the research, authorship, and/or publication of this article.
Funding
The author(s) received no financial support for the research, authorship, and/or publication of this article.