
Abstract
In this study, we aimed to investigate the impact of predicted particulates with a diameter of 2.5 μm or less (PM2.5) using the satellite data on Years of Life Lost (YLL) as a health burden of air pollution. A 2-stage methodology was used in order to predict PM2.5 using Aerosol Optical Depth (AOD). The predicted PM was corrected for its bias through Bland-Altman method and observed data. Relative Risk (RR), Attributable Fraction (AF), and Attributable Number (AN) of YLL were estimated as the effect of PM2.5 on health. Based on the minimum value as the optimum value of PM, statistically a significant cumulative dose-response association was found. The significant association was mainly observed between lags 4 and 13. Also, based on the scenario, the total estimated YLL attributable to air pollution was 74227 years, with an AF of 0.45 which was statistically significant (95% CI: 0.14, 0.65). Based on the median value as the second scenario, there was not cumulative significant dose-response association. The subgroup analysis revealed that females and the elderly exhibited higher PM2.5-related YLL compared to males and younger, respectively. Totally, the study revealed that impact of the predicted PM on YLL was significant when we selected the minimum value as reference. While, the impact was insignificant when we changed it to median value. This result highlights the important effect of reference value selection on the interpretation of dose-response and lag-response associations between PM2.5 and YLL which should be addressed in next studies.
Introduction
Air pollution has a substantial impact on individuals’ health, including mortality and diseases such as respiratory, cardiovascular and even neurological disorders.1,2 Particulate matter (PM) is one of the most important air pollutants. The particulates are result of various sources such as human activities and natural phenomena that can be loaded with chemical and organic compounds. Particulate Matters are of particular importance depending on their size. The Particulate Matter with a diameter of less than 2.5 µm (PM2.5) can penetrate deep into the lungs and enter the blood.3-5 Exposure to PM2.5 can lead to oxidative stress and inflammation, causing tissue damage and worsening conditions like respiratory and cardiovascular diseases. Toxic compounds in the particles develop reactive oxygen species (ROS), further damaging cells. During time, these effects impair cellular function and elevate disease risk.6-10 Previous studies have revealed that exposure to ambient air pollutants, particularly PM2.5, has been linked to increased mortality mainly from non-accidental causes, including cardiovascular and respiratory diseases.5,11-13 In addition, populations with prolonged exposure to PM2.5 (ie, long-term effect) may exhibit increased susceptibility to infection, hospitalization, and mortality.14,15 Thus, given the significance impact of PM2.5, it is beneficial to explore the spatio-temporal dispersion of PM2.5 to assess its impact on the environment and human health, especially in vulnerable communities. Although numerous studies9,12,16 have been conducted on PM2.5 pollution globally, there is limited information on the impact of the pollutant using remote sensing data, especially in Iran, which is located to the world’s desert belt. The PM2.5 data is predominantly gathered either through field measurements or strategically located monitoring stations in urban areas aimed at monitoring criteria pollutants.7,17 In recent years, remote sensing technology has been well utilized for monitoring of air pollution. It offers a cost-effective alternative for monitoring and controlling air pollution, particularly in regions with limited resources for epidemiological studies and prevention policies. 18 This technology enables the collection of comprehensive data over large geographic areas, providing valuable insights into pollution patterns and trends. Additionally, remote sensing data can assess the magnitude of atmospheric pollutants, help tracking changes over time, ascertain human exposure levels, and support the development of targeted intervention strategies to mitigate the adverse health effects of air pollution. 18 So, the images emerge as invaluable tools, effectively filling information gaps caused by the lack of traditional monitoring station. 19 Aerosol Optical Depth (AOD) is one of the measurements used to investigate the aerosol load and its distribution in the atmosphere. AOD values vary at different spatio-temporal scales.20,21 Recent progress has facilitated the extension of spectral AOD retrieval across a broader range through the utilization of spectro-radiometers calibrated in laboratory settings.22,23 Using the AOD offers significant advantages and, its measure at low cost way makes it useful for remote areas where no monitoring data is available. Several studies have shown the association between AOD and PM2.5 in different regions.24,25 For example, a study has revealed that the MODIS AOD indicated a strong correlation with PM2.5 in China, particularly in the Chengyu, Beijing-Tianjin-Hebei, and Yangtze River Delta regions. 25 These evidences highlight the use of AOD as a predictor of PM.
As mentioned, previous studies have suggested that increased exposure to PM2.5 is associated with an elevated risk of chronic respiratory conditions, including COPD, chronic bronchitis, and lung cancer, as well as cardiovascular events such as heart attacks and stroke. Additionally, PM2.5 exposure can worsen pre-existing heart conditions.11,13,15 As a result, these health complications can potentially lead to premature mortality, especially in areas with high levels of PM2.5. Although many studies have investigated the impact of PM2.5 on mortality, few researches have focused on YLL as the outcome and AOD as the predictor.26-29 It’s worth mentioning that the YLL takes account several factors, including age of death and general public health which have been less frequently addressed in previous researches. Dust is one of the most important air pollutants in arid and semi-arid regions, including Iran, which can have adverse effects on public health. Sanandaj city, due to its geographical location and exposure to dust phenomena, faces serious challenges in the field of air pollution and its consequences. In the city, air pollutant monitoring stations are poorly distributed. The use of remote sensing techniques allows for a more accurate assessment of PM2.5 exposure and, as a result, its relationship with health outcomes. Therefore, in this study, we initially estimated the concentration of PM2.5 using remote sensing data (AOD) in Sanandaj, Iran. We then investigated impact of the predicted PM on YLL by different concepts including dose-response association, attributable fraction (AF), and attributable number (AN).
Methods
Data Collection and Process
This study is part of a larger project being carried out in Sanandaj, a city in western Iran (35°19′00″ N, 46°59′45″ E) with a cold, semi-arid environment. Sanandaj sprawls across rough terrain, with an elevation of 1494 m above sea level and an area of 3000 km2 bounded by mountain ranges. Data were gathered from multiple sources, including mortality statistics from the Health Deputy of Kurdistan Province, Aerosol Optical Depth (AOD) measurements from satellite imagery, air quality indicators from the Environmental Department, and meteorological observations from Meteorological Organization. The dataset covers the years 2017 to 2022. The study investigated mortality across all causes, sex, and age groups (young: <65 years and elderly: >65 years). Indeed, the mortality statistics were used to estimate YLL for each sex and age group (next section). PM2.5 values were extrapolated using observed data from strategically located sites, allowing for fine-scale mapping over the region. Meteorological factors, including daily mean temperature (°C), wind speed (m/s), and humidity (%), were utilized in both risk assessment and PM2.5 prediction models. Aerosol Optical Depth (AOD) data originated from MCD19A2 Version 6.1, is a high-resolution product of Aqua and Terra satellites and derived using the Multi-Angle Implementation of Atmospheric Correction (MAIAC) approach.
Estimation of YLL
The measurement of premature mortality is typically evaluated using a metric called Years of Life Lost (YLL). The YLL assesses the number of years of life that are lost due to deaths occurring prematurely, often defined as before a certain age threshold, typically around 70 or 80 years old. This metric is valuable for evaluating the impact of different diseases and injuries on a population, thus guiding public health interventions. YLL is calculated by multiplying the number of deaths by a standard life expectancy corresponding to the age at which the death occurs. 30 It was calculated for all causes of death by each age and sex groups using equations (1) and (2) and the Iran’s life table which is available from the World Health Organization. 31 In these equations, N indicates the daily number of deaths in each day t for age category i (ie, <65 and > 64) and sex g. L denotes the standard life expectancy for the same age and sex groups. In health economics and burden of disease assessments, a 3% discount rate (ie, the value in equation (1)) is commonly applied to YLL-related health outcomes. This practice, known as time discounting, reflects the preference for immediate health benefits over those realized in the future. As a result, each additional year of life is valued slightly less than the preceding 1. For example, the value assigned to a year of life at age 60 would be approximately 3% lower than that at age 59. This approach is fundamental to the calculation of metrics like Disability-Adjusted Life Years (DALYs), where future years of healthy life are discounted to their present value to account for time preferences in health interventions. The approach to estimate YLL and the discount rate in YLL estimation have been widely applied in both general epidemiology and air pollution-related studies.32-34 Finally, the total value of YLL for each day t was calculated through summation of YLL from the age-sex subgroups (equation (2)). Indeed, we primary calculated the daily YLL for 2 age categories of <65 years old and ⩾65 years old by the sex groups in equation (1), and the subcategory YLL was then summed by the groups in order to estimate the total YLL in each day t. In addition to the overall value, the YLL value was calculated for different age and sex subgroups.

Estimation of PM2.5 and Bias Correction
PM2.5 was predicted using Aerosol Optical Depth (AOD), which measures atmospheric turbidity and represents the exponential attenuation of solar radiation caused by air particulates. 35 AOD is a significant measure in determining air pollution levels and has previously been used as a predictor for particulate matter in numerous studies.17,36 Our pilot study revealed that the AOD data was variable from 0.14 (±0.09) in 2022 to 0.23 in 2019 (±0.08) in the region. The lowest and highest AOD was observed between April to September (Mean April-June: 0.15, Sd: 0.11; Mean July-September: 0.15, Sd: 0.12) and October to December (mean: 0.21, Sd: 0.11), respectively. In this study, AOD was used as a predictor of PM2.5 within a regression framework. Details of this technique has been provided in the main project. Briefly, PM2.5 was estimated using a 2-stage linear regression. Cross-validation techniques and regression modeling were applied in the first step to establish an unbiased relationship between AOD (the predictor) and PM2.5 (the dependent variable). In the model which was applied to days having both AOD and observed PM2.5 data on the location nearest to monitoring stations (ie, to enhance model accuracy), we considered wind speed as a covariate. It should be noted that the association coefficient between AOD and PM2.5 was positive (35.20), though it was not significant which might be due to lack of sufficient observed PM2.5 in the region. Also, the 10-fold cross validation technique showed that there is variability in fitness of the model between subsample data (ie, fold dataset). For example, fold 3 revealed a 15% in R square while subsample 4 showed .06 in the index. So, the model we used still needs to be improved by other covariates that should be addressed in next studies.
When the best association between the variables was found, we used it in the second stage where the PM2.5 was predicted. Essentially, the preceding stage’s coefficient was applied to AOD values on days and places where monitoring stations could not provide PM2.5 data, allowing for high-resolution PM2.5 estimates over the whole research region. To reduce bias in the model and subsequent PM2.5 predictions, a 2-stage process was used. In the first stage, the Bland-Altman approach was used to determine amount of bias. This approach consisted of comparing the difference between observed and calculated PM2.5 levels to the average of the 2 measurements. Specifically, in this approach, a plot including the average of the measurements in x axis and the difference of the measurements in y axis is used. Using this approach, the more difference, the more bias, and the equal to zero shows that there is no bias. The average of the measurements helps understanding the pattern of the bias by the average which plays the standard of the measurement. However, it is essential to acknowledge that, while this method eliminates some prejudices, it may not cover all potential sources of bias. As a result, in the second step of the bias correction procedure, an approach typically used in General Circulation Models (GCMs) was utilized to integrate the mean and standard deviation of daily measured PM2.5. To summarize, the daily PM2.5 was adjusted for bias using the Bland-Altman approach and then standardized using its daily mean and standard deviation, resulting in a daily standardized time series. Following that, the normalized daily data was converted into the daily mean and standard deviation of measured PM2.5. As a result, a bias-adjusted PM2.5 variable was developed, which acted as the main exposure of the risk estimation model.
Risk and Attributable Risk
The dose-response association between YLL and bias-corrected PM was derived from the following model:

Where,
Cumulative relative risk (RR) was calculated for different age and sex groups throughout 21 lags by comparing extreme values to reference values. The extreme values were 3 percentiles of PM2.5 (90, 95, and 99). In our study, we addressed 2 reference values as 2 scenarios: the median and the minimum value (zero) of PM2.5. The results of both risk and attributable risk were compared between the 2 scenarios. Utilizing the model’s cumulative relative risk (RR), the attributable fraction (AF) was calculated using the formula (RR-1)/RR. 38 This approach was used to estimate the fraction of years of life lost (YLL) due to air pollution during the previous 21 days. Furthermore, the Attributable Number (AN) was calculated by multiplying AF by the number of YLL reported on each day. The uncertainty surrounding the attributable fraction (AF) was derived using Monte Carlo simulation in which the lower and upper bounds of the confidence interval at the 2.5th and 97.5th percentiles were estimated, respectively.
Model parameters and non-linear functions were determined by minimizing the Quasi-Akaike Information Criterion (Q-AIC) and undertaking a comprehensive literature research to assure the model’s robustness.
Results
Figure 1 shows the temporal distribution of the exposure variable and the YLL by sex and age groups. The maximum and minimum of total YLL was observed in October and July, respectively. Males had higher YLL than females with the highest in October. Also, not surprisingly, young people shared higher YLL compared with elderlies. The highest and lowest median of PM2.5 concentration were seen at the end of the year (December) and March, respectively. The daily average of observed PM2.5 (ie, station-based data) between 2017 and 2022 was 8.96 µg/m3 (±7.22 µg/m3) with the minimum and maximum of 1.68 to 74.54 µg/m3, respectively. The daily average of satellite-based PM2.5 (ie, predicted data using AOD) was 8.42 (±4.74), respectively. Geographically, the AOD-based data was variable from 0 to 28.6 µg/m3 with uncertainty (ie, standard error) between 3.6 and 20.2 µg/m3 across the region.

Boxplot of YLL by subgroup and predicted PM2.5 in Sanandaj over 2017 to 2022.
The dose-response association between PM2.5 and YLL as well as its corresponding lag-response association have been provided in Figure 2. In the figure, the associations have been presented by 2 scenarios of reference value. Based on the minimum value as the reference of model, there was statistically a significant cumulative dose-response association between the predictor and YLL with significant adverse effect of extreme values compared with the reference. There was high uncertainty (ie, wide 95% confidence interval) in the impact of the highest values of the predictor. The significant association was observed between lags 4 and 13. Based on the median value as the reference, there was not cumulative significant dose-response association till the maximum lag of 21 days. However, in short-time (lags 6-8), it tended to have significant cumulative effect (Figure 2, the last panel).
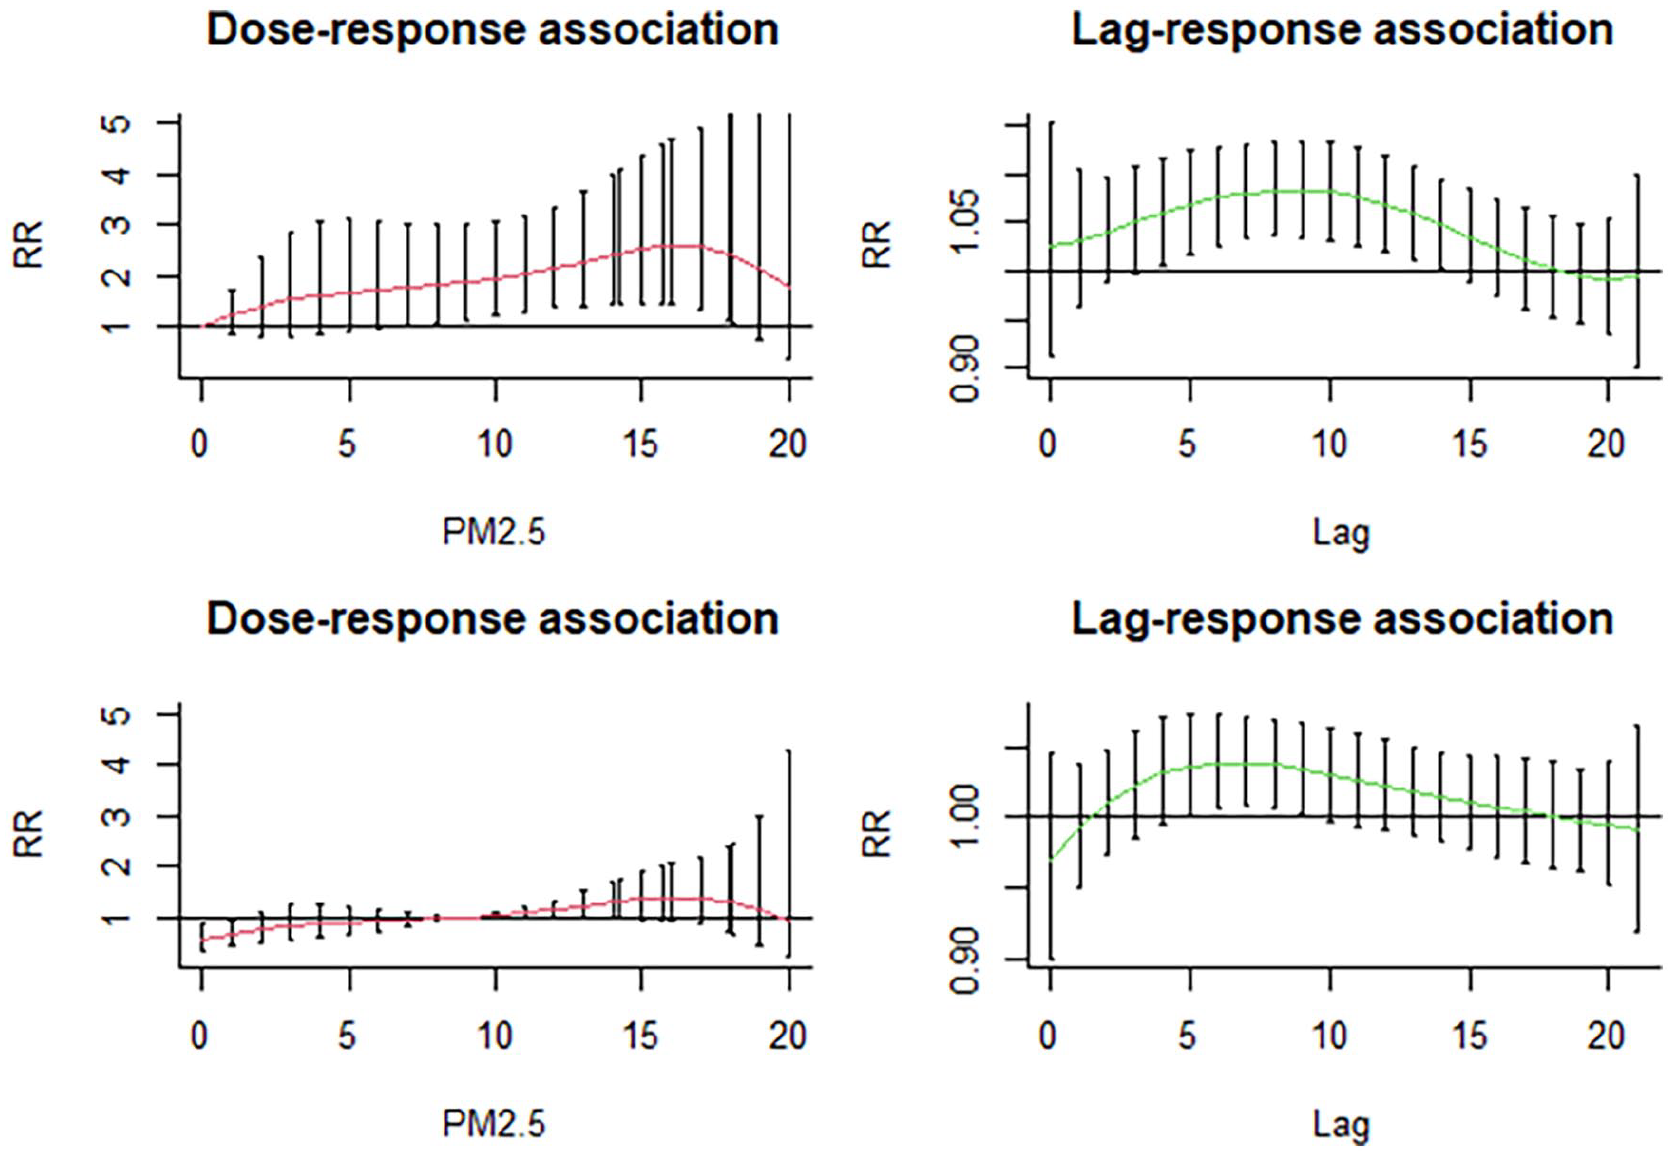
Dose-response and lag-response associations by 2 scenarios; the 2 above and the 2 below panels show the results when minimum (zero) and median values were the references, respectively. The statistically significant values were based on the 95% CI.
Table 1 provides the impact of exposure to extreme PM2.5 (90th, 95th and 99th percentiles) on YLL across 2 scenarios and subgroups. Within the context of differing scenarios, the minimum scenario portrays more pronounced YLL impacts while the median scenario suggests no significant effect. Moreover, the disaggregation of data by sex and age groups reveals notable disparities, with females and the elderly exhibiting consistently higher PM2.5-related YLL compared to males and younger individuals, respectively.
Relative risk (RR) of YLL by subgroup due to extreme values (percentiles) compared to 2 scenarios.

The bold estimations are statistically significant based on %95 Confidence Interval.
The results of attributable number by the scenarios and subgroups have been presented in Figure 3. Also, the corresponding AF and their uncertainty have been shown in Table 2. When we selected minimum value as reference, the total estimated number of attributable YLL to air pollution was 74 227 years, with an AF of 0.45 which was statistically significant (95% CI: 0.14, 0.65). In the median scenario, the estimate was −3275 years, indicating a slight decrease in the number of attributable YLL, with an AF of −0.02 which was not statistically significant. Indeed, there was uncertainty in all estimations related to the median scenario. Meanwhile, the attributable number or fraction was statistically significant under the minimum scenario for females and elderlies. The number of attributable YLL to the PM among the groups were 37 248 and 23 653 with their corresponding AF of 0.53 and 0.58, respectively. By the median scenario, the predictor tended to be protective with the number of attributable YLL among elderly as −3885 years, with an AF of −0.09. However, as mentioned it was not significant. Under the median scenario, there was 1635 attributable YLL among females, with an AF of 0.02. Among males, the minimum scenario suggests an estimated number of attributable YLL as 36 420 and AF as 0.39, while in the median scenario, there was a decrease in the number of attributable YLL as −4634 years, with an AF of −0.05.

Number of YLL attributed to the predicted air PM2.5 by subgroups and scenarios.
Attributable fraction (AF) and number (AN) of YLL along the uncertainty related to the predicted air PM2.5 by subgroups and scenarios.

The bold estimations are statistically significant based on %95 Confidence Interval
Discussion
In this study, the concentration of PM2.5 in Sanandaj, Iran, was assessed over 2017 to 2022 using Aerosol Optical Depth (AOD) data gathered over the same years. The highest exposure levels were detected in December, while the lowest were recorded in March. These findings are consistent with those of Seidel et al. in Europe, who found greater levels of exposure during the colder months and a drop in PM2.5 concentration at the warm months. 39 We also found a change in the Years of Life Lost (YLL) between 2017 and 2022; the highest level of mean YLL occurred in October, indicating potentially a positive relationship with PM2.5 concentrations. The main analysis revealed a variation in the estimated YLL attributable to air pollution across different subgroups and scenarios. While some subgroups exhibit an increase in YLL, others show a decrease, with varying degrees of uncertainty as indicated by the confidence intervals. The attributable fractions provided insight into the relative contribution of air pollution to YLL within each subgroup and scenario. Specifically, we found that females and elderly tend to be more vulnerable to the pollutant than men and young people, especially when the minimum value was the reference. The reasons for the disparity are many: The increased susceptibility of females to air pollutants can be attributed to several physiological and hormonal differences. For instance, women generally have a higher fat-to-muscle ratio, which can affect the absorption and distribution of pollutants in the body. However, there is controversy about vulnerability of females to the pollutant in literature. For example, a study conducted by Yin et al 40 suggested that males experienced higher PM2.5-related YLL than women. A study conducted in the Basque, Spain, indicated a significant difference in PM-related YLL across sex. 41 Also, a study conducted by Moradi et al 7 in Ahvaz confirmed this finding. Males may be exposed to a higher level of PM due to their increased physical activity in outdoor settings. Furthermore, males and females face different economic and social situations, as well as differing degrees of stress, all of which contribute to the aforementioned different impacts among the sex groups.28,41
Elderlies are inherently more vulnerable to pollutants due to age-related physiological changes. As people age, their respiratory and cardiovascular systems undergo structural and functional declines, reducing the body’s ability to filter and expel inhaled pollutants. Furthermore, the presence of pre-existing health conditions, such as chronic obstructive pulmonary disease (COPD), asthma, and cardiovascular diseases, which are more prevalent in the elderly, exacerbates the impact of air pollution on this group. This finding is consistent with many studies. 14 For instance, Ni et al 29 showed that the impact of air PM2.5 on YLL for non-accidental diseases and cardiovascular diseases in elderly people were higher than those for younger people. Also, Liu et al 42 found that short-term exposure to PM2.5 has stronger adverse impact on YLL among women and the elderly (⩾65 years) than men and young people. However, a study in Tehran, Iran, revealed that young people had a greater YLL attributed to PM2.5 than senior persons. 43 This finding was different from our results which is probably due to increased activity and higher exposure to pollutants. Also, a study conducted by Zallaghi et al 44 in Ahvaz, Iran showed that all age groups are vulnerable to PM2.5. According to a study by Chen et al, 43 YLL can be a complete alternative measure for assessing mortality since the true impact of air pollution falls mostly on young people. This demonstrates that the elderly and women are more vulnerable to PM2.5. In addition, some earlier investigations supported our findings,7,43,45,46 as well. Totally, as mentioned the different results among subgroups can be biologically acceptable because the elderly’s respiratory system functions is less efficiently than that of young individuals and males. Women also have smaller lungs and narrower airways, which contributes to increased particulates accumulation and allergy responses. 29
Given that we used different reference scenarios in the relationship between PM2.5 and YLL, our findings can be useful for improvement of air pollution management and allocation of health resources. The change in PM2.5 exposures, in contrast to the minimum value as a reference model, revealed a substantial cumulative dose-response relationship, with higher values having a greater influence than lower ones. This considerable influence was found between lags 4 and 13. Changing the reference model to the median value resulted in no significant effect in any of the subgroups. However, in a similar study conducted in Tehran, the biggest effect was shown between lags 0 and 8 days using the mean value as a reference. Although several epidemiological studies have investigated the detrimental health effects of pollutants’ mean concentrations, some of them have concluded that utilizing the mean daily concentration might lead to bias. So, given the controversy between studies, it is preferable to utilize different references for population-based investigations.43,47,48 The World Health Organization 49 recommended an annual mean concentration of less than 5 µg/m3 for PM2.5 in 2021. Regarding that our results revealed adverse impact of extreme values compared to the minimum value, the recommended concentration threshold value might be questionable and not appropriate for all locations of the world. Probably, as mentioned, it is preferable to define the threshold value based on the conditions and dose-response associations in each place. Thus, additional examination, especially the population-based research should be undertaken using the threshold values established at the regions.
In the region under study, relying on data from a single ground-based station to assess the concentration of standard pollutants and calculate spatial distribution might lead to inaccurate and incomplete assessments of air quality. We used alternative data (AOD data), which provides extensive spatial and temporal coverage. The aerosols are a measure of the absorption of solar radiation by atmospheric aerosols and serves as a proxy for surface particulate matter concentrations.5,9 Studies have shown that AOD can be effectively used to monitor and model air quality, offering insights into the distribution and intensity of particulate matter over large areas. 50 In Iran, and specifically in the western regions like Sanandaj, AOD data has been instrumental in filling the gaps left by insufficient ground-based monitoring stations. The AOD data in our study highlighted the seasonal and geographical variability of the PM2.5. The data revealed high levels of aerosols during the spring and summer months, correlating with the peak dust storm periods. The variability in the area is particularly due to its geographical and meteorological conditions. Given our results, this data not only aids in understanding the temporal dynamics of dust storms but also in predicting and mitigating their impact on public health and the environment.
This study suffers from some limitations. We used high resolution images to estimate PM2.5. Although this is a strength of the study but the data were eventually aggregated in the risk analysis, thereby having less generalizable results to each individual which leads to an error named the ecological fallacy. However, given the strong model and high-resolution data, the results are so robust that can be used by health policy makers at population level. We should note that several data such as socio-economic or climate-related variables were not available to be used in the model of association between AOD and PM2.5 (stage 1 in Section 2.3.) which might lead to some residual in the model. This should be highlighted by stronger methodology in next studies. Another limitation was to use the median value of PM2.5 as a reference in the dose-response association. This concern results from the fact that a threshold concentration is not permanent in a geographical location. Indeed, due to some reasons such as climate change and change in human activities, individuals are not always exposed to the same level of outdoor air pollution (ie, median level of the pollution) throughout their lives. To cope with this issue, the minimal scenario was also examined in this study. In the estimation of PM2.5 model and risk analysis we only used the AOD and meteorological variables, while there might be several factors such as socio-economic and climate-related factors which might affect the estimations. So, a stronger study including these factors is suggested in Iran.
Conclusion
This research revealed that the impact of predicted PM2.5 on YLL was significant when the minimum value was selected as the reference, but negligible when the median value was used. This highlights the critical influence of reference value selection on interpreting dose-response and lag-response associations between PM2.5 and YLL. The findings also underscore the substantial public health burden of PM2.5, particularly among females and the elderly. Therefore, public health policies should prioritize reducing PM2.5 exposure, especially during periods of extreme pollution. Future research in Iran should refine these associations and explore the mechanisms behind the observed disparities in exposure (ground and satellite-based data) and subgroups, to better inform public health strategies.
Footnotes
Acknowledgements
The authors thank the National Department of Environment and Iran Meteorological Organization for providing us the data. This research was supported by Deputy of Research and Technology, Kurdistan University of Medical Sciences. So, we thank the university grant committee for supporting us (Grant No. 1402.201).
Ethical Considerations
This study was approved by the ethics committee of the Kurdistan University of Medical Sciences (Ethic code: IR.MUK.REC.1402.201).
Author Contributions
SS: Investigation, Conceptualization, Methodology, Resources, Software, Writing – orginal draft, Writing – review & editing. OA: Supervison, Methodology, Data analysis; Conceptualization; Resources; Project administration, Software; Writing – orginal draft, Writing – review & editing. AM: Investigation, Conceptualization, Resources, Software. RR: Methodology, Validation, Writing – review & editing. SF: Writing – orginal draft, Writing – review & editing. MS: Writing – orginal draft, Writing – review & editing. SR: Writing – orginal draft, Writing – review & editing.
Funding
The author(s) disclosed receipt of the following financial support for the research, authorship, and/or publication of this article: This work was supported by the Deputy of Research and Technology at Kurdistan University of Medical Sciences with grant number 1402.201.
Declaration of Conflicting Interests
The author(s) declared no potential conflicts of interest with respect to the research, authorship, and/or publication of this article.
Data Availability Statement
Our data are available from the corresponding author upon reasonable request.