
Abstract
Water quality issues in Ethiopia necessitate the implementation of the Water Safety Plan (WSP) to safeguard drinking water. Despite its benefits, WSP implementation is underutilized, a situation exacerbated by urbanization, agriculture, pollution, and climate change. This study evaluated water supply system vulnerability and delineated protection zones in the Upper Awash River subbasin. By employing the DRASTIC model, the National WASH Inventory-2 (NWI-2), and qualitative methods, this research aims to integrate the NWI-2 with vulnerability assessments. The study revealed that, among 2864 schemes, only 14.4% had a water safety plan, while 20.7% practiced water safety, and 6% reported the occurrence of waterborne diseases. Over 39.23% of the schemes were in high vulnerability areas, 12.32% were in very high vulnerability areas, and only 8% were in low vulnerability areas. The validation revealed a 61.7% association between the vulnerability indices and nitrate concentration. The strengths of the strategy included coordination and guideline development, but challenges such as institutionalization, catchment protection, the legal framework, and climate information remain for the Water Safety Plan. To promote public health, these findings help to demonstrate and integrate the NWI-2 with vulnerability assessments to protect drinking water sources. The conclusion also calls for all concerned authorities to implement water source protection, emphasizing the use of GIS technology and the adoption of integrated watershed management practices, which encompass regulatory control and conservation strategies. Furthermore, more research on the pollutant time of travel, assimilation capacity, and land use priorities is needed to delineate specific protection zones.
Keywords
Introduction
Water quality problems are a major issue in many parts of the world, and they are severe in less developed countries such as Ethiopia. 1 In 2018, the national water supply coverage, as per the standards outlined in the second phase of the Growth and Transformation Plan (GTP-II), reached 47%, 57%, and 49% for rural, urban, and total areas, respectively. Despite these figures indicating relatively low access to water, only 14% of the population had access to water from low-risk sources based on common microbial indicators. Additionally, in 2016, only 13% of Ethiopians utilized safely managed water services.2,3 Other reports indicate that, although the standard for thermotolerant coliform levels in water is set at zero CFU/100 mL, approximately 40% of water supply schemes exceeded the permissible standard values for thermotolerant coliform counts. 4 The deterioration of water quality, compounded by limited access, is primarily attributed to the absence of national source protection zoning or delineation aimed at safeguarding drinking water quality. This absence, coupled with challenges such as urbanization, intensive agriculture, industrialization, water pollution, deforestation, and climate change in the Upper Awash River subbasin, emphasizes the critical need for proactive measures.5,6 The urgency of addressing drinking water risks in polluted and sociopolitically significant subbasins highlights the motivation behind this study. The key factors driving this research include safeguarding public health, promoting sustainable water management, enhancing decision-making, reducing economic burdens, ensuring regulatory compliance, raising public awareness, and facilitating long-term planning. Additionally, expanding the scope of the national WASH inventory to include various factors could improve water supply quality and resilience.
SDG-6 aims to ensure access to clean water and sanitation for all, which aligns with activities such as
Protecting water sources ensures the availability of clean and safe drinking water, directly contributing to achieving SDG-6 targets. Source protection provides considerable benefits for the water supply system. These include reducing exposure to risk agents, minimizing treatment costs, avoiding the need for sophisticated water treatment plants, limiting the influence of disinfection byproducts, and contributing to the long-term sustainability of a safe and adequate water supply system. Source protection zones can be used to aid in catchment management challenges, such as the demarcation of safeguard zones for places where water quality is poor around abstractions. 14 Source protection through delineation is a globally used strategy for maintaining water quality and preventing hazardous material pollution of groundwater. 15 Delineating protection zones helps safeguard water sources from contamination, supporting the goal of ensuring sustainable water management. WSP, for example, is justified as a more cost-effective strategy for reducing nonpoint pollution in a specific watershed. 16 Evidence suggests that the use of WSPs results in a considerable decrease in the prevalence of diarrheal diseases, resulting in improved water quality.17,18 In contrast, even in high-income countries where WSPs are strictly enforced, risk management occasionally fails, and outbreaks of waterborne disease have been reported. 19 Water source protection has not received significant attention in low-income countries such as Ethiopia, despite possible anthropogenic pollutants, lack of institutional capacity for integrating land and water management at the local level, lack of understanding and organizational responsibilities, conflicts over multiuse watersheds, and poor watershed planning.20,21
Distance to the point of concern, cone of depression in the unconfined aquifer, time of travel, assimilative capacity, flow boundaries, level of contaminant loading, land use-land cover, topographic and hydraulic conductivity of the aquifer, local context, enabling environment, and required levels of protection are major criteria commonly used for delineating source protection zones as part of watershed management. 20 Considering these characteristics, most groundwater wells and springs, as well as intake buildings, require 3 zones of protection, which can be accomplished by using the ArcGIS environment. 22 These zones include (1) the inner protection zone (IPZ), which has a minimum radius of 50 m; (2) the outer protection zone (OPZ), which has a minimum radius of 250 m; and (3) the catchment protection zone (CPZ). 23 Additionally, the delineation of surface water source protection considers factors such as slope, land use, soil type, drainage density and runoff to delineate 3 protection zones around the water body. 22 Experience has shown that Zone I is an immediate protection zone within a radius of 100 m; Zone II is the second zone with close protection within a radius ranging from 350 m to 100 m around zone I; and Zone III is a distant protection zone outside zone II. 24
Vulnerability assessment, on the other hand, is an input for source protection zones. It identifies risks to water sources and vulnerabilities in water supply systems, guiding efforts to strengthen resilience and achieve SDG-6 objectives effectively. It is a risk assessment for groundwater resources exposed to pollution from various activities and contaminants. The assessment approach is classified into 3 types. These include indexing and/or overlaying methods (e.g., DRASTIC), logistic regression approaches and process-based methods (e.g., SWAT) and numerical models (e.g., MODFLOW). 25 Based on guidelines for groundwater vulnerability mapping in sub-Saharan Africa, DRASTIC can sufficiently delineate the groundwater in vulnerable zones. 26 Hence, given that the upper Awash subbasin is characterized by economic activity, pollution, and a dense population, the significance of groundwater vulnerability maps in safeguarding groundwater sources cannot be overstated. 27 These maps can play a crucial role in establishing legal regulations, allocating resources wisely, prioritizing interventions, monitoring groundwater, and accurately predicting pollutant sources to delineate protection zones. Consequently, this study focuses on groundwater vulnerability mapping using the DRASTIC method and defining source protection zones based on National WASH inventory findings validated through nitrate concentration analysis. Higher index values of groundwater vulnerability indicate zones that are particularly susceptible to contamination, emphasizing the need to delineate these zones as groundwater protection zones for effective groundwater aquifer management by promoting access to clean water and sanitation, which is essential for sustainable development and human well-being. The DRASTIC assessment method has been applied to detect vulnerable aquifers based on topographical, geological, and hydrogeological factors, independent of the status of susceptibility to existing water supply schemes. This study presents an innovative approach that goes beyond simple identification of vulnerable areas, provides real-time information to identify whether existing water supply schemes are located in vulnerable areas, and proposes the establishment of practical protection zones, which can be integrated with the national WASH inventory and integrated watershed management, including water conservation, WSP, and regulatory control.
Methods and Materials
Study area
The Awash River Basin is divided into 4 subbasins, including the Upper, Middle, Lower, and Eastern Catchments, before it ends at Lake Abe. The basin has more than 24 million residents, of whom approximately 65% (15.7 million) live in the Upper Awash subbasin. The subbasin has population densities ranging from 110 to 270 persons per km2. Many urban residents with industrial, agricultural, and other socioeconomic activities are attributes of the subbasin. The upper Awash subbasin has a total area of 11,720 km2, which is 9.9% of the area of the Awash basin (112,000 km2). It starts approximately 80 km west of Addis Ababa, at Ginchi, and extends to Koka Dam, with a total length of 220 km. The Akaki, Holeta, Berga, and Legedadi Rivers are the 4 major tributaries of the subbasin. It is located between 8°16′ and 9°18′ and between 37°57′ and 39°17′ with elevations ranging from 3000 m to 1500 m above sea level. The land use and land cover of the subbasin consist of cultivated agricultural land, grassland, shrub land, forestland, and rural and town settlements. The wet period is between June and September, and the dry period is between October and February. The hottest month is May, and the coldest months are November and December. The rainfall distribution is mostly unimodal and is usually controlled by the movement of the intertropical convergence zone. The annual maximum daily rainfall varies from 62 to 37 mm. A map of the study area is shown in Figure 1. This study is significant because of the notable socioeconomic benefits associated with the subbasin. Conversely, it stands out as one of the most densely populated, polluted, industrialized, urbanized, and utilized subbasins compared to others across the country.

Study area.
DRASTIC model
DRASTIC modeling was simulated using a spatial analyst extension of the ESRI Arc GIS 10.7 software. The ArcGIS tool (Spatial Analyst) can process different layers of digital maps into vulnerable zones by calculating the vulnerability index and analyzing the spatial variability of groundwater vulnerability. 28 For each DRASTIC parameter, digital geospatial datasets were created through the ArcGIS environment. Vector formats were converted to raster formats, and weights and rates for the 7 parameters were assigned based on the DRASTIC guidelines. Using a raster calculator and Lookup syntax from the ArcGIS environment, overlay analysis of the parameters was performed to produce a DRASTIC map. The overall model formula is described in equation (1) as follows.
Where:
D: Depth to water table; R: Effective recharge; A: Aquifer media; I: Impact of vadose zone; S: Soil type; T: Topography; C: Hydraulic conductivity; r: Rate and w: Weight.
The depth to water table (D) was created using an interpolation technique from the generated raster map of the water table, which was developed from the static water level of boreholes. 26 The effective recharge (R) was calculated from the precipitation, evapotranspiration and land use/land cover data based on equation (2):

Where:
PPT: Precipitation (PPT), 30 years of rainfall data from 13 rainfall gauges using the Thiessen polygon method
ET: annual evapotranspiration (ET);
RR: Recharge Ratios (RRs) based on land use/land cover raster data were downloaded from the USGS/NASA, 29 and Landsat 8 30 websites, respectively. 31
Aquifer media (A) was produced based on a geological shape file that was converted to a geological raster map, and the impact of the vadose zone (I) was synthesized based on these geological map attributes (Annex A). Soil type (S) and topography (T) were determined from the soil type map prepared based on the soil texture map and from the digital elevation map, respectively. The hydraulic conductivity (C) was estimated based on the major geological nature of the aquifer. The weights of the parameters and the rate values were assigned to each class based on the DRASTIC model guidelines (see the Supplementary Materials).28,32 The DRASTIC map product was sorted in the ArcGIS environment into 4 classes to interpret vulnerability levels: low vulnerability, with values less than 109; moderate vulnerability, with values between 109 and 138; high vulnerability, with values between 138 and 166; and very high vulnerability, with values greater than 166 according to the product raster map.
Validation of DRASTIC model
The model was validated by linear regression analysis using SPSS version 24. The parameters were the model output (DRASTIC index) values extracted from the product map by applying the ArcGIS spatial analysis tool (extraction – extract values to points) and the observed nitrate concentrations from 60 drinking water samples collected in 2 districts of the study area. The R2 was predicted from the relationship between the dependent variable (NO3) and independent variable (DRASTIC index value) with the assumption that if there was valid groundwater vulnerability, the index value increased proportionally to the concentration of nitrate with a significant R 2 . The nitrate concentration is used for validating the DRASTIC model and assessing the accuracy of its predictions, as it is a common indicator of groundwater contamination, particularly from agricultural sources such as fertilizers.27,33
National Water, Sanitation and Hygiene (WASH) Inventory
Spatial point data of 2864 water supply schemes located in the subbasin were extracted from the National WASH Inventory-2 (NWI-2) database of the Ministry of Water and Energy (MOWE). The National WASH inventory is a key component of the comprehensive One WASH National Program (OWNP) monitoring and evaluation system used to achieve the Sustainable Development Goal (SDG-6), which was implemented nationwide in March 2019 to generate information to improve service levels. 34 The NWI-2 database was established as an online mobile data collection platform through the management of the MOWE. NWI-2 point data were processed in the ArcGIS environment. Ten percent of the scheme data were not extracted from the downloaded file due to errors and were excluded from the analysis. Additionally, users of boreholes in urban areas were excluded, as the data for water supply systems in urban areas are limited user data and need further analysis, which is beyond the scope of this study.
Water quality sampling and testing
Sixty water quality samples were collected from NWI-2 inventoried water supply schemes in dry and wet seasons from the Sebeta-Hawas District and Bereh Districts to verify the susceptibility of the designated groundwater to low, moderate, high, and very high levels. The exact location of the samples was determined by using the GIS environment from the National WASH Inventory (NWI-2). Based on other water quality parameters, nitrate was chosen as one of the water quality markers for this investigation. A Palintest 7100 Photometer was used to analyze the concentration of nitrate. 35 The necessary equipment and materials were prepared, representative water samples were collected, records were documented, and the requirements of sample preservation, handling, storage, and transportation were met based on quality assurance protocols. Water quality analysis was carried out in accordance with WHO guidelines, and blank measurements and duplicate/triplicate analyses were utilized to ensure the quality of the data collected. Calibration and validation were conducted prior to analysis, and specific dates and intervals were verified in accordance with the manufacturer’s documentation. .
Delineation of the water source protection zone
The delineation of the groundwater protection zone was performed based on the overlay analysis of the resulting DRASTIC model map with National WASH Inventory point data (Figure 2). Accordingly, the following 3 zones are established for wells, boreholes and springs as well as water intake structures using the ring-buffering tool in the ArcGIS environment. The groundwater source protection zones include (1) the Inner Protection Zone, which has a minimum radius of 50 ms 23 ; (2) the Outer Protection Zone, which has a radius of 500 m 36 ; and the Catchment Protection Zone, which is the area around the water source within which all the groundwater recharges. It includes the entire groundwater catchment of the well field. 36 Source protection areas were produced for the upper Awash River subbasin. The resulting map is then overlain with simple maps of the inner and outer source protection areas to delineate the vulnerability of both the inner and the outer source protection areas. This map is the basis for defining the level of protection to be implemented for each area. 23

Procedures of source protection area delineation.
Qualitative data collection and analysis
Focus group discussions (FGDs) were held with 5 MOWE professionals working on the WSP. The experts discussed the subject matter (thematic area) based on their knowledge, experiences, and what is going on in the MOWEs related to the WSP. Source protection and zoning (buffering) are accomplished with the assistance of field reports, training reports, workshop reports, and annual performance reports. A structured questionnaire (Supplementary material) was used to manage the focus discussion, which was moderated by the primary investigator. The questionnaire includes the enabling environment for WSP at the national and local levels, current and implemented significant WSP activities, and implementation gaps with remedial strategies, such as idea development for policy and decision-makers. Thematic analysis was used to analyze the acquired data on the water source protection themes.
Results and Discussion
Description of NWI-2
As a component of the national WASH monitoring and evaluation system, the first National WASH Inventory (NWI-1) was created in 2011. The results were obtained in March 2013 by the Water and Energy Minister to track the progress of the Millennium Development Goals (MDGs). 37 More than 92,000 rural water supply systems, 1600 small town water supply systems, 50,000 institutions and 12 million households were included in the first NWI census. 38 The second National WASH Inventory (NWI-2) was conducted in March 2019 to assess the effects of drinking water supply schemes on physical status, beneficiaries at the scheme level according to government standards, service delivery performances, management status, sanitary conditions, and other relevant parameters for monitoring and evaluating the WASH program, such as hygiene practices and sanitation facility functionality. In this study, approximately 2864 drinking water supply schemes (408 of which are nonfunctional) were extracted from the national database. More than 1010 (35%) shallow wells, 1032 (36%) hand dug wells, 604 (21%) boreholes, 206 (7%) springs, and 10 (0.35%) various types of drinking water supply schemes were inventoried in the subbasin (Table 1).
Distribution of drinking water supply schemes in the upper Awash subbasin, NWI-2.

Figure 3 shows that the density of water supply schemes is concentrated in the western part of the subbasin, whereas the central part of the subbasin in the southern direction of Addis Ababa has fewer water supply schemes.

Map of the water supply scheme distribution in the Upper Awash Sub-River Basin.
The findings showed that among the 2864 inventoried water supply schemes, 14.4% (413) had a water safety plan, 20.7% (594) implemented water safety practices, and 6% (174) reported the incidence of waterborne diseases in the past year. The sanitary conditions of the water supply scheme sources were 12.2% bad, 71.1% fair, and 16.6% good. According to the NWI-2 guidelines, a “good” sanitary situation indicates a clean source free of pollution or contamination. “Fair” indicates a clean source but with room for improvement. “Bad” indicates a dirty source exposed to pollution or contamination (Table 2).
Water safety plan, safety practice, incidence of waterborne diseases, and sanitary situation of water supply sources, NWI-2.

Overlapping data from the NWI-2 results and vulnerability assessment revealed that a number of schemes require immediate attention for source protection due to their locations in extremely vulnerable areas and poor management of water supply schemes (Table 4). In addition to poor water safety standards and sanitary conditions, the risk of pollution or contamination further increases if the source is located in a sensitive groundwater aquifer. To safeguard these schemes, establishing a fixed radius around the source can be an appropriate strategy for both microbiological protection and the creation of a surveillance zone. 39 Thus, integrating the delineation method with NWI-2 can facilitate groundwater recharge and delineate activity-free zones around water sources. 40 This integration not only improves the effectiveness of WASH monitoring in Ethiopia but also provides valuable insights for the international Joint Monitoring Program (JMP) to consider source protection issues in its WASH monitoring system. 41
The situation of WSP at the national level
Expert discussions revealed that the MOWE has a National WSP Technical Working Group (N-WSP-TWG). This group comprises representatives from the Ministries of Health, Water and Energy, the Environmental Protection Agency, the National Meteorology Agency, the Ministry of Agriculture, and other relevant sectors. The experts highlighted major ongoing WSP activities such as capacity building, development of working documents, pilot-level risk and vulnerability assessments, supportive supervision and review meetings, coordination of WSP implementations, and identification of research topics. They also explained the purposes of WSP and responsibilities of the MOWE at the national level.
The discussion, along with the supplementary materials, revealed that comprehensive water supply risk assessment and risk-based management have not received significant attention since the fifth WASH Multistakeholders meeting in November 2012. MOWIEs and regional water bureaus have been piloting methods, building capacity, and assessing risks since then, and WSP guidelines and a strategy framework have been developed; however, implementation has remained in a pilot phase since June 2018. As a result, the strategy and guidelines have not been fully implemented. However, capacity-building interventions targeting 20 urban water utilities and 11 rural woredas on the development and implementation of WSPs for existing water delivery systems were estimated to benefit almost 2,113,567 people. As part of those efforts, climate resilient WSP projects were piloted in the Addis Ababa and Adama city water supply systems to practice WSP and provide attention to the impact of climate on drinking water supply schemes. 42 A review of the literature revealed that WSP was in its pilot phase in China at the time, and full-scale implementation only began in 2018. 43 Challenges to effective WSP implementation exist globally. In the United States, for example, a lack of preventive culture, prioritization, leadership, and difficulty integrating WSPs into existing practices hinder progress. 44 Similarly, WSP monitoring, verification, and management in Uganda have not been entirely successful, with the exception of system assessment and improvement. 45 However, progress has been made in high-income countries under the OECD (Organization for Economic Co-operation and Development). This is evident in the creation of an enabling environment through guidelines, regulations, tools, and resources, public health support, and context-specific evidence 19
Beyond the identified best practices, several challenges hinder traditional WSP implementation. These challenges include a lack of institutionalization, limited efforts for catchment protection, a neglect of sanitation safety planning, and the unavailability of climate information. These limitations have necessitated the development of climate-resilient WSPs (CR-WSPs). Furthermore, due to challenges such as the COVID-19 pandemic, country instability, organizational reform, limited stakeholder engagement, and stakeholder commitments, the implementation of the CR-WSP has not progressed well. An additional challenge identified by technical experts is the absence of national source protection zoning or delineation guidelines, except for existing CR-WSP implementation guidelines for urban and rural water supply systems. The requirements of legal restrictions further complicate this issue. Water sector responsibilities are limited and do not include the management and administration of land around the water source, development activities within the catchment zones, or the removal of hazards/contamination risks from source to point of use. Additionally, there is a lack of evidence and established practices for source protection zoning. These findings address these gaps by demonstrating how to delineate water source protection zones in the Upper Awash River subbasin using ArcGIS and national WASH inventory data. This approach can strengthen national water safety plan implementations by integrating program implementation and an information management system within the One WASH national program.
Linear regression analysis
The analysis of water quality data revealed an average nitrite concentration of 0.15 mg/L, ranging from 0.02 mg/L to 0.31 mg/L (with a 95% confidence interval). Similarly, the average nitrate concentration was 24.98 mg/L, ranging from 17.72 mg/L to 32.25 mg/L (with a 95% confidence interval). These parameters are crucial for assessing water safety and environmental impact, especially considering the health risks associated with elevated nitrate concentrations. Nitrate contamination is more commonly associated with agricultural practices, including the use of fertilizers and manure. Further evaluation of nitrate levels, although variable, is needed, especially considering the potential health risks associated with chronic exposure to high nitrate concentrations (Table 3).
Descriptive statistics of nitrate and nitrite in drinking water.

In addition to the public health significance of nitrate, various scholars have suggested that nitrate concentrations can be used to validate different models, such as the DRASTIC model. High nitrate levels often indicate agricultural runoff, sewage contamination, or other forms of pollution that can affect groundwater quality.27,33,46 As a result, the relationships between vulnerability indices and nitrate concentrations were established, and the fluctuations were described by R 2 values of 61.7%. This suggests that variations in nitrate concentration correlate with vulnerability index values. The validation method also yielded a predictable model; if the groundwater vulnerability index increased by 1 unit, the nitrate content increased by 2 times (P value << 05) (Table 4). Therefore, in accordance with these validation results, the DRASTIC model input parameters are acceptable.26,47
Results of linear regression analysis of the DRASTIC index value (independent variable) and NO3 concentration (dependent variable).

Delineation of the water source protection zone
This study revealed that more than 39.23% (1124) of the 2864 water supply schemes were located in highly vulnerable areas, with an additional 12.32% (353) in very highly vulnerable areas. Conversely, only 8% (229) of the schemes were located in low vulnerability areas. This vulnerability translates to user exposure, as 55.30% (286,403) of users depend on water sources in highly vulnerable areas (Table 5). These findings highlight the critical need for source protection zone delineation in subbasins. This method, one of the most widely used approaches for maintaining water quality, involves mapping groundwater vulnerability and delineating zones around water sources to prevent pollution. 48 This study employed a GIS environment to conduct groundwater vulnerability mapping and protection zone delineation. Using the ring buffer approach in the ArcGIS toolbox, all the extracted water supply schemes were designated as inner (50 m), immediate (500 m), and outer (entire water catchment) zones. 23 The most effective way to limit the risks of water resource pollution is to divide the region around a water source into 3 protection zones and determine the protection perimeters based on the vulnerability map.13,22 The methods for source protection zoning include fixed radius, flow system mapping, analytical modeling, and numerical modeling. Generally, a fixed radius is the most effective among these methods. This can be put into practice to safeguard water supply schemes from contamination, but more complex aquifers and more vulnerable water supply schemes require robust methods. 49 For example, when there is low vulnerability, the fixed radius approach can be used, but when there is high vulnerability, the isochrone method and the groundwater vulnerability mapping method should be used to characterize the aquifer properties. 50 Fixed radius and groundwater vulnerability mapping were used in this study to integrate the national WASH inventory results for a synergetic approach. This form of protection is equally crucial to the wellhead, sanitary seal surrounding the well casing, and surface water intake. In the Upper Awash Subbasin, this source protection zone can be used to help with watershed management problems in areas near abstractions where there is a risk of water pollution and a vulnerability to pollution. 51
Groundwater vulnerability level and distribution of drinking water supply schemes.

On the other hand, a high groundwater vulnerability index indicates that the sensitive zone influencing aquifer recharge should be defined as a groundwater protection zone or pollution-free zone for managing groundwater sources. These areas must be safeguarded from point and nonpoint sources of water pollution since the subbasin is at the country’s center, including the capital city, and is affected by significant pollution risks caused by population, industrialization, urbanization, and intense agricultural activities (Figure 4). 40
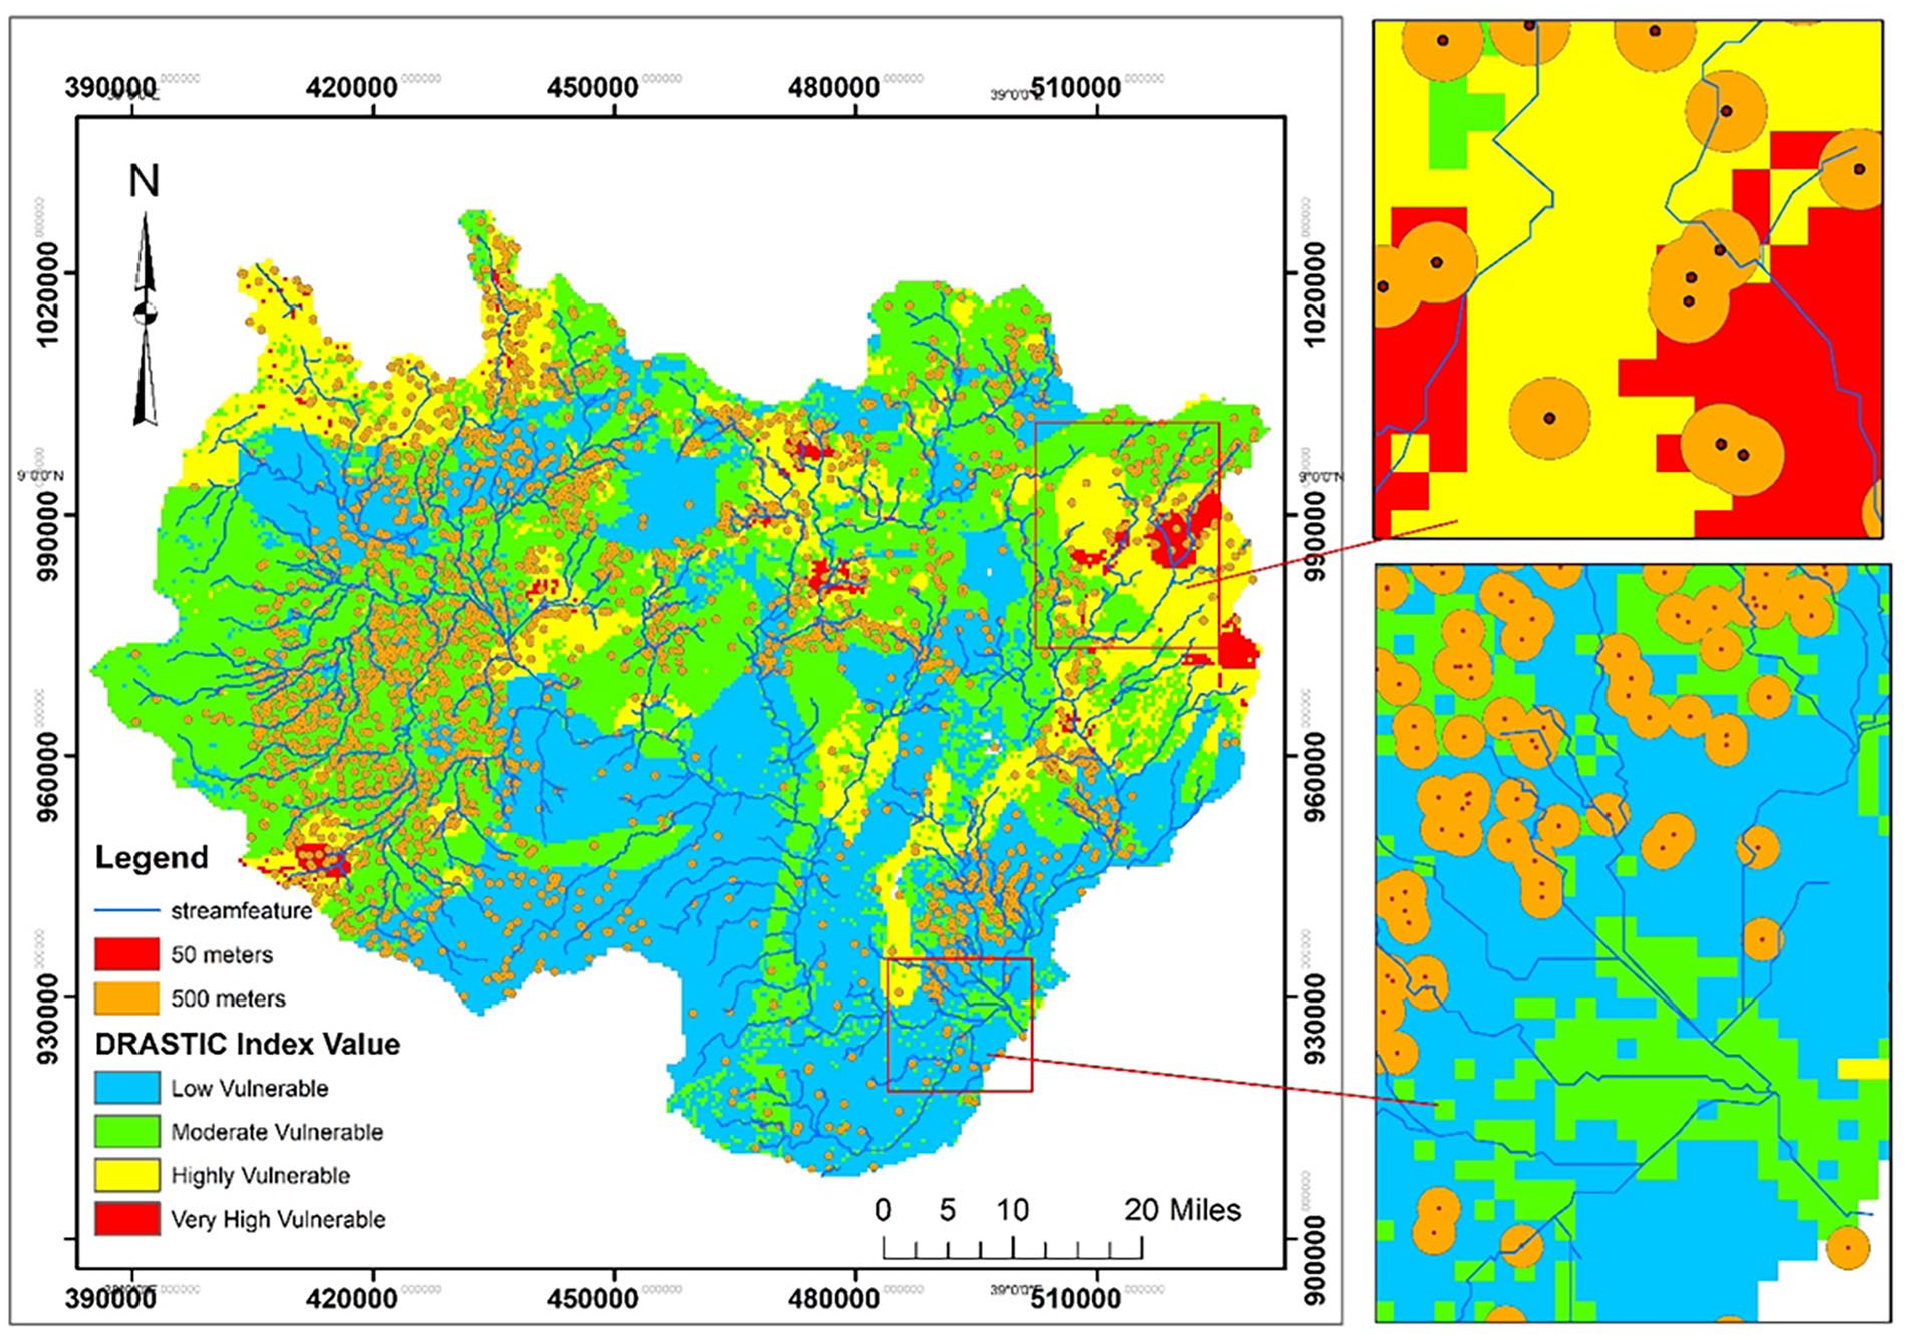
Delineated zones for groundwater source protection in the Upper Awash Sub-River Basin.
There are numerous examples of groundwater vulnerability mapping and groundwater protection zone delineation in various parts of the world. 52 However, in low-income nations such as Ethiopia, where there is a lack of institutional capacity to integrate land and water management at the local level, water source protection has not received enough attention, in addition to concerns arising from anthropogenic activities. 20 It is therefore believed that these results encourage relevant authorities to standardize source protection delineation, particularly for the Upper Awash River subbasin. This can be achieved by developing protection policies, establishing regulatory controls on waste disposal, managing sites, planning land use with consideration for compensation to account for the growth of zoned areas, and coordinating stakeholders for integrated watershed management.
The construction of new water sources and the maintenance of existing water supply sources can benefit from such protective techniques. Responsible authorities and users should establish bylaws to restrict the boundaries of the protection zone after delineation, define types of waste disposal, manage sites, select sites in relation to aquifer vulnerability status, and prioritize water safety when developing land use and cover analysis. Examples of managing land use and human activities in protection zones include restricting polluting activities, planning land use, establishing regulatory frameworks, taking into account the characteristics of the protected zone, and compensating or providing other forms of financial support to current land users impacted by changes. Vulnerability assessments are used for long-term planning of groundwater resource safeguarding, corresponding to the system assessment concept in building a water safety plan. It is possible to define action levels to provide the necessary protection for drinking water sources. By classifying vulnerability status in terms of protection requirements, it is possible to define action levels that provide the necessary protection for drinking water sources. Including these factors in a water safety plan (WSP) helps to communicate their significance for meeting quality standards and facilitates the management of a drinking water catchment.
Limitations of the study
The limitations of this study include the reliance of the DRASTIC model on 7 factors, which may overlook complex hydrogeological interactions determining groundwater vulnerability. The model may not adequately address site-specific conditions, such as the nature and intensity of contaminant sources. Additionally, confined aquifers are treated similarly to unconfined aquifers, and the study represents a single point in time without accounting for future changes in land use or climate. The use of WASH inventory data is constrained by the inherent limitations of secondary data sources. These limitations highlight the need for cautious interpretation and complementation with additional approaches to ensure a comprehensive assessment of water supply scheme vulnerability and protection zone delineation.
Conclusion
This study highlights the critical issue of water quality protection in Ethiopia, particularly in the Upper Awash River subbasin. The WSP strategy involves a comprehensive risk assessment and offers a promising approach for mitigating contamination risks. However, its implementation faces significant challenges, including inadequate source protection measures and a lack of legal restrictions. Urbanization, intensive agriculture, industrialization, water pollution, deforestation, and climate change further exacerbate the vulnerability of water supply systems in the basin. With the DRASTIC model and the NWI-2 results, this research assessed the vulnerability of water supply systems and delineated source protection zones. Accordingly, 14.4% of the water supply scheme sources had a water safety plan, 20.7% had water safety practices, and 6% had a reported incidence of waterborne diseases. More than 39.23% of these schemes were located in highly vulnerable areas, 12.32% were in highly vulnerable areas, and only 8% were in less vulnerable areas. Furthermore, coordination, capacity-building efforts, and the development of guidelines were strengths at the national level; however, a lack of institutionalization, catchment protection, legal frameworks, and climate information were the major challenges of water source protection. To address these challenges and promote public health, several key actions are necessary. First, there is a need for the implementation of water source protection measures, as demonstrated in this study, which integrates vulnerability assessment with NWI-2 and integrated watershed management, including water conservation strategies, WSP, and regulatory control. Additionally, efforts should be made to institutionalize WSP practices and establish a robust legal framework to support source protection initiatives. By implementing these measures, stakeholders can ensure the long-term sustainability of water supply systems and safeguard public health. Finally, future research should focus on the pollutant duration of travel, assimilation capacity, and land use priorities to delineate specific protection zones more accurately.
Supplemental Material
sj-docx-1-ehi-10.1177_11786302241258349 – Supplemental material for Vulnerability Assessment and Protection Zone Delineation for Water Supply Schemes in the Upper Awash Subbasin, Ethiopia, Sub-Saharan Africa
Supplemental material, sj-docx-1-ehi-10.1177_11786302241258349 for Vulnerability Assessment and Protection Zone Delineation for Water Supply Schemes in the Upper Awash Subbasin, Ethiopia, Sub-Saharan Africa by Tesfa Aklilu, Geremew Sahilu and Argaw Ambelu in Environmental Health Insights
Footnotes
Funding:
The author(s) received no financial support for the research, authorship, and/or publication of this article.
Declaration of Conflicting Interests:
The author(s) declared no potential conflicts of interest with respect to the research, authorship, and/or publication of this article.
Author Contribution
TA conceived the research idea, collected and analyzed data, drafted and reviewed the manuscript; GS supervised the data collection and analysis, reviewed and edited the manuscript; AA supervised the data collection and analysis, reviewed and edited the manuscript.
Supplemental Material
Supplemental material for this article is available online.
References
Supplementary Material
Please find the following supplemental material available below.
For Open Access articles published under a Creative Commons License, all supplemental material carries the same license as the article it is associated with.
For non-Open Access articles published, all supplemental material carries a non-exclusive license, and permission requests for re-use of supplemental material or any part of supplemental material shall be sent directly to the copyright owner as specified in the copyright notice associated with the article.