
Abstract
Greenhouse gases (GHGs) are the primary drivers of global climate change. Human activities, particularly those related to energy production, transportation, and industry, have long contributed to the escalating levels of GHGs in the Earth’s atmosphere. Recognizing the significance of this issue, universities, including Thammasat University, play a vital role in Greenhouse gas (GHG) emissions research and education, carrying a responsibility to address the matter. This study is aimed aims to assess the greenhouse gas emissions and mitigation measures at Thammasat University (Lampang campus), Thailand. The emissions are categorized into 3 types: (1) direct GHG emissions; (2) energy-related indirect GHG emissions; and (3) other indirect GHG emissions. Activity data from the years 2019 to 2022 was used for the calculations, resulting in GHG emissions of 1051.70, 778.28, 558.64, and 1034.531 tons of carbon dioxide equivalent. Among these emissions, energy-related indirect GHG emissions from electricity purchases represent the majority, accounting for approximately 78.55% of the total emissions. Consequently, implementing mitigation strategies, such as solar panel installations and solid waste reduction (combined scenario), has the potential to reduce GHG emissions by up to 57.78%. Furthermore, the university should actively promote GHG emissions reduction through the enactment of energy-saving policies and the adoption of energy-efficient technologies to reduce reliance on energy purchases.
Introduction
The effects of climate change extend to human health, air pollution, extreme weather events, food scarcity, and various other factors.1 -3 Since 2020, the Paris Agreement has redirected the approach to addressing global climate change, moving away from focusing solely on certain developed nations toward implementing a universal system.4 -6 The assessment of emissions and the calculation of greenhouse gas (GHG) emissions have gained significance, especially concerning GHG reduction and achieving carbon neutrality.7 -9 Furthermore, long-term low greenhouse gas emission development strategies (LT-LEDS) are national initiatives that delineate pathways or scenarios for achieving low-emission development in alignment with long-term visions and/or targets, while also considering broader socio-economic objectives. Each country encounters unique challenges, necessitating distinct approaches, priorities, and actions to facilitate the requisite transformation.10 -12 Certainly, sustainable development stands as a pivotal global endeavor focused on tackling the intertwined issues of environmental degradation, social inequity, and economic instability.
Universities possess a significant obligation and distinct capability to take the lead in confronting climate change through education and research.13 -15 Consequently, evaluating and minimizing carbon footprints within higher education institutions has emerged as an urgent priority, with universities and colleges worldwide recognizing their contribution to climate change mitigation strategies. For instance, research conducted by Everitts 16 estimated the GHG emissions inventory for the University of Wyoming in the base year of 2018. The findings indicated that the total emissions amounted to 29 800 metric tons of carbon dioxide equivalent (MTCDE), with purchased electricity (41.1%), on-campus stationary sources (35.9%), fertilizers and livestock (7.44%), and directly funded air travel (6.58%) being the main contributors to UW’s GHG emissions. Additionally, a life cycle assessment was employed to evaluate GHG emissions from Clemson University’s campus for the year 2014. The results revealed an estimated total of approximately 95 000 MTCDE, equating to 4.4 MTCDE per student. The principal sources of greenhouse gas emissions were electricity generation (41%), commuting by car (18%), and steam generation (16%). 17 Furthermore, GHG emissions from 20 universities across Europe and the United States were assessed utilizing Scopes 1 to 3 of the GHG Protocol. It was observed that energy consumption, encompassing electricity and heat generation, ranged from 8.6% (Umwelt-Campus Birkenfeld) to 76.8% (Minnesota State University Mankato). Nevertheless, many buildings at specific universities in Europe, notably in Germany and Switzerland, lack a cooling system and rely entirely on green power. 18 Moreover, energy usage intensity and greenhouse gas emissions were also examined at universities in Taiwan. The findings revealed that the primary source of energy consumption was electricity, accounting for 92%. 19
Accordingly, the procurement of electricity, consumption of mobile fuels, and the depositing of solid waste in landfills stand as notable contributors to GHG emissions, exacerbating the global climate emergency. Studies reveal that electricity generation, predominantly sourced from fossil fuels, constitutes a significant portion of GHG emissions.20,21 Similarly, the transportation industry’s dependence on petrol and diesel fuels continues to be a primary driver of GHG emissions. 22 Furthermore, the inadequate disposal of solid waste in landfills produces methane, a potent greenhouse gas. 20
Thailand has demonstrated a steadfast commitment to tackling the urgent challenge of climate change, aligning itself with the global endeavor to combat this crisis. With ambitious targets on the horizon, Thailand aims to attain carbon neutrality by 2050 and achieve net zero emissions by 2065. In pursuit of these goals, the country is poised to enhance its nationally determined contribution (NDC) by up to 40% by 2030, subject to sufficient support in technology transfer, collaboration, and access to green financing.9,23 As Thailand strives to advance its sustainability agenda, universities prioritizing GHG management not only contribute to the nation’s climate objectives but also position themselves as pioneers in the education sector and valuable collaborators in the broader sustainability sphere. Therefore, GHG emissions inventories hold significance for all activities, including universities.
This study aims to assess the GHG emissions inventory of Thammasat University (Lampang campus) across 3 scopes: direct emissions (Scope 1), indirect emissions linked to electricity consumption (Scope 2), and other indirect emissions (Scope 3), using data spanning from 2019 to 2022. The GHG emission findings, measured in tons of carbon dioxide equivalent (tCO2eq), are outlined for each scope individually and collectively. Additionally, the assessment involves evaluating scenarios for implementing mitigation measures to address predominant GHG emissions and devising strategies to reduce overall GHG emissions.
Materials and Methods
Scope of the study
The research centered on Thammasat University (Lampang campus), located in Lampang province, northern Thailand. This province is known for experiencing the highest summer temperatures, with a maximum recorded temperature of 44.2°C in 2019. The university comprises approximately 10 main buildings and 6 faculties including Social Science Interdisciplinary Program Interdisciplinary College, Faculty of Law, Faculty of Public Health, Faculty of Social Administration, Faculty of Science and Technology, Faculty of Arts Industrial Craft Design Program, spread across 0.58 km2, as illustrated in Figure 1. The estimation of greenhouse gas emissions was carried out using the GHG Protocol, jointly developed by the World Resources Institute (WRI), an environmental Non-Governmental Organization (NGO) based in the United States, and the World Business Council for Sustainable Development (WBCSD). 24 This guideline outlines 3 categories for estimating greenhouse gas emissions: scope 1 encompasses direct GHG emissions, covering those controlled by the organization including mobile combustion sources (Diesel and gasohol E20), CO2 fire extinguisher and hydrofluorocarbon (HFC). Scope 2 addresses electricity-related indirect GHG emissions, while scope 3 accounts for other indirect GHG emissions resulting from activities including water usage, solid waste, paper usage (A4), liquefied petroleum gas (LPG) for cooking, tissue paper and solvents from laboratories within the organization that are not under the organization’s control. The base year for this study was 2019, and the GHG emissions inventory durations from 2019 to 2022. Figure 2 illustrates the scope of emissions examined in this research.

Thammasat University (Lampang campus).

Scope of the study.
Data collection and calculation approach
To classify the scopes and types of activities within the study area, we employed the GHG Protocol Corporate Standard, issued by WRI and WBCSD,25 -28 along with the data sources utilized for their calculation. Data covering the period from 2019 to 2022 were collected from the Center Administration Division, Property and Sports Management Office, and the green library report of Thammasat University (Lampang campus).
The subsequent procedures were employed to ascertain the GHG emissions associated with each scope, which involved identifying the energy consumption within each scope, such as kilowatt-hours (kWh) of electricity and liters of fuel consumed. Additionally, the updated GHG emissions factors associated with each category were sought to be discovered, such as kilograms of CO2 equivalent per liter (kgCO2eq/L), metric tons of CO2 equivalent per kilowatt-hour (tCO2eq/kWh), and kilograms of CO2 equivalent per kilogram (kgCO2eq/kg). The amount of CO2eq in each scope was then calculated by multiplying the consumption by the corresponding emissions factor for each scope.
In this study, Scope 1 encompasses direct emissions from mobile sources at the university, including buses, vans, and cars. It also examined emissions from air conditioning systems using R-22 refrigerant, classified as HFC emissions, and the use of CO2 extinguishers for fire training, which were considered direct emissions. In Scope 2, GHG emissions were determined by indirect emissions stemming from power purchases measured in kWh.
Finally, Scope 3 entails documenting water consumption in cubic meters (m3). Data on the average daily quantity of solid waste disposed of in sanitary landfills (kg/day) were gathered, and the amount of solid waste per person was estimated in kilograms per year (kg/year). In this study, waste recycling is not factored into the calculation of GHG emissions reduction. This aligns with the University’s strategies that were implemented prior to the base year and have since been in place.
Information on paper usage (A4) in each university department, the use of LPG for cooking in canteens, the disposal of solvents at laboratories in the faculties of science and technology and public health, and the consumption of tissue paper in restrooms were gathered to estimate GHG emissions. Furthermore, data encompassing all staff and students was collected to calculate carbon emissions per person.
In terms of commuting to the university, nearly 50% of students walk from the university’s dormitories to the classrooms, while approximately 30% utilize the university’s buses, which fall under Scope 1. Around 20% of students use their personal vehicles, such as motorcycles. However, data on students’ and staffs’ travel was not collected in the base year; therefore, efforts will be made to gather this information in future studies.
For each task, GHG emission factors particular to that task were chosen from references such as the Thai National Life Cycle Inventory Database, the Thailand Greenhouse Gas Management Organization (TGO), and the Intergovernmental Panel on Climate Change (IPCC). GHG emissions from each source were computed in tons of carbon dioxide equivalent per year (tCO2eq/year) by amalgamating the activity data (measured in units) with the corresponding emission factor (kgCO2eq/unit). Table 1 displays the sources of emission data for each activity and furnishes specifics on the components of greenhouse gas emissions.
Emission factors influencing greenhouse gas emissions and activities.

Uncertainty
The precision of a reported value may arise from measurement inaccuracies, incomplete data availability, or future estimations. The emission data presented in this study were acquired from recorded sources. However, the quantity of solid waste was approximated through a study and estimated as solid waste generation per person per kilogram per day in 2023. This estimation involved calculating the total solid waste generated from 2019 to 2022 based on the total number of people on working days. The uncertainty regarding emission factors is due to the lack of country-specific data. Consequently, global emission factors were also utilized in accordance with the IPCC guidelines.
Scenario design
Thammasat University is actively advancing toward a leadership position in clean energy, fulfilling its dual role as an educational center and a model for energy conservation through various strategies. These approaches encompass the adoption of electric vehicles, the integration of energy-efficient technologies, and the construction of environmentally sustainable buildings. Initiatives such as installing solar rooftop systems, transitioning to electric vehicles, promoting efficient energy usage, shifting to LED lighting systems, and implementing energy-efficient building designs have already commenced at the main campus and are being expanded to other campuses, including Lampang campus. The installation of 720 kW solar rooftops at the Lampang campus has been ongoing since 2019.
Furthermore, a sustained commitment to energy conservation measures has been in effect since 2019, fostering collaborative endeavors. These initiatives encompass a range of actions, including conducting thorough inspections and switching off all electrical switches when the last employee leaves the office, deactivating unnecessary electric bulbs during meal breaks, operating air conditioning units from 9:30 a.m. to 12:00 p.m., followed by deactivation between 12:00 p.m. and 1:00 p.m., as well as 30 minutes before the end of the workday. Additionally, employees are encouraged to power down computers and printers when not in use or before starting work, to turn off computer monitors, to minimize paper usage during meetings, to conserve water resources, and to conduct routine inspections to identify and address any leaks or maintenance needs.
Scenario planning serves as a valuable tool for designing alternative energy infrastructures and for long-term planning, addressing the challenges associated with uncertain future greenhouse gas emissions. The current study explores 2 GHG emission scenarios for the period 2023 to 2030, using 2019 as the baseline year. These scenarios encompass an assessment of the business-as-usual (BAU) scenario as well as various emission reduction alternatives. The BAU scenario was chosen as the initial reference point, and the remaining scenarios were developed to mitigate both direct and indirect GHG emissions.
Results and Discussions
GHG emissions inventory
The summary of activities across scopes 1 to 3 for the period 2019 to 2022 is presented in Table 2. Within Scope 1, the university’s fleet comprises buses and vans fueled by diesel, while cars use gasoline E20 (a blend containing 20% ethanol in gasoline). There is an expected reduction in fuel consumption for the year 2020 to 2021 due to the coronavirus 2019 (COVID-19) pandemic. With the majority of working and on-site classes conducted online, students and employees did not need to travel for studying and working using the university’s vehicles for approximately half of the year. Moreover, the utilization of CO2 fire extinguishers and HFC (R-22) is determined based on the fire training schedule, with replacements being made as necessary. This includes replacing expired CO2 fire extinguishers with new ones. The trend in Scope 2, which includes energy indirect emissions from purchased electricity, reflects the trend seen in fuel usage within Scope 1 for the fleet. Both decreased from 2019 to 2021 but increased in 2022 due to the same reason of virus pandemics. Furthermore, within Scope 3, the waste generation rate was approximately 0.15 kg per person per year during the base year. The composition of solid waste includes food (12.22%), paper (15.87%), plastic (27.45%), rubber (0.04%), fabric (7.07%), wood (0.15%), glass (30.87%), and cans (6.33%), respectively.
Amount of activities and GHG emissions in three scopes at Thammasat University (Lampang Campus) from 2019 to 2022.

The trend levels for water supply usage, solid waste, LPG for cooking, and tissue paper during 2020 to 2021 reflect those observed in Scope 1 and 2. However, the quantity of paper usage varied depending on the specific work conducted within each division. However, all departments have been encouraged to adopt paperless practices in alignment with the University’s strategy. Waste generated from solvents in laboratories was collected in containers meeting a minimum weight requirement before being sent to a chemical waste disposal company for safe disposal. In 2020, solvents accounted for the highest volume of waste collected over a 2-year period compared to other years. In terms of solid waste management, individuals at the university are continuously encouraged to reduce solid waste. However, there is a need for further promotion of awareness regarding waste aggregation and methods for the proper disposal of items such as plastic bags.
The quantity of solvents used in laboratories varied based on the practices in specific subjects and the number of students in each class, as well as projects undertaken by the chemical laboratories affiliated with the faculties of Science and Technology and Public Health.
Overall, the volume of activities experienced a decrease in 2020 and 2021 compared to the base year of 2019 but showed an increase in 2022. This fluctuation may be attributed to the impact of the COVID-19 pandemic that occurred between 2020 and 2021 in Thailand, during which almost all activities transitioned away from on-site operations at the university. A significant majority of employees worked remotely, and students also pursued their studies online. However, approximately 10% of students opted to stay at the dormitory located within the campus for their online studies. The count of employees and students engaged in on-site work and study at the university from 2019 to 2022 was approximately 2402, 389, 386, and 2333, respectively.
Table 2 illustrates the average GHG emission sources for each activity across the 3 scopes at Thammasat University (Lampang campus) from 2019 to 2022. The annual average GHG emissions for the respective years totaled 1051.70, 778.28, 558.64, and 1034.531 tCO2eq. These findings reveal that GHG emissions from diesel vehicles and paper usage increased in 2022 compared to the baseline year (2019). This could be attributed to the frequent use of vans for commuting to work and an expansion in the university welfare bus timetable. However, emissions from other activities demonstrated a decreasing trend in contrast to the base year.
Moreover, the predominant GHG emissions in the reference year (2019) originated from electricity purchased, categorized under scope 2 indirect emissions (826.09 tCO2eq), succeeded by scope 3 other indirect emissions (135.85 tCO2eq), and scope 1 direct emissions (89.76 tCO2eq), respectively. Hence, it is imperative to consider these major GHG emissions when proposing potential mitigation measures. Nevertheless, specific actions have already been implemented at the university, such as waste minimization within scope 3. Furthermore, the average GHG emissions per capita, per student, and per employee in the baseline year were approximately 0.43, 0.50, and 3.74, respectively.
Figure 3 illustrates the primary sources of GHG emissions at Thammasat University (Lampang campus), with purchased electricity accounting for approximately 80% to 85%, diesel fleets contributing around 6% to 9%, solid waste representing 2% to 9%, and water supply comprising approximately 2% to 3% of the emissions. The findings regarding the primary GHG emission sources in this study align with research conducted at Clemson University in the USA (41.0%), 17 Universitas Pertamina in Indonesia (92.3%), 32 and nearly 18 other universities (Average 52.1%). 18 Consequently, efforts to mitigate GHG emissions should primarily focus on these key sources.

Comparison of GHG emissions from 2019 to 2022 at Thammasat University (Lampang campus).
Mitigation measure scenarios
Reducing GHG emissions by a small margin is no longer enough to achieve long-term climate stability on a global scale. 18 Therefore, it is essential to reduce GHG emissions originating from primary sources at Thammasat University (Lampang campus). With this aim in mind, scenarios for mitigation measures have been developed, considering relevant policies and potential strategies. These scenarios encompass 2 primary approaches: alternative energy adoption and a combined scenario that integrates alternative energy adoption with solid waste reduction.
BAU scenario
The data for the years 2023 to 2030 were projected by extrapolating the growth rate of routine activities, excluding CO2 fire extinguishers, refrigerants, and laboratory solvents, using average data from 2019 to 2022. The growth rate of mobile sources using diesel fuel and paper usage (A4) was approximately 0.02%, while other activities remained consistent with 2019 levels. Subsequently, the quantity of each activity was evaluated alongside the growth rate, and then multiplied by the corresponding emission factors to derive an estimation of greenhouse gas emissions.
Consequently, GHG emissions under the Business-As-Usual (BAU) scenario remained constant from 2023 to 2030. GHG emissions from 2019 to 2030 under the BAU scenario and all other scenarios are represented in Figure 4. The findings indicate a notable decrease in GHG emissions from the base year up to 2021, followed by a precise increase until 2022, and a consistent upward trend continuing until 2030. It is evident that the COVID-19 pandemic has resulted in an unparalleled impact on numerous countries worldwide and persists in posing a threat to human lives globally, including Thailand. The stringent lockdown measures implemented have yielded detrimental effects on both human health and national economies. However, these measures have also played a pivotal role in notably enhancing air quality and mitigating greenhouse gas emissions.33,34 For instance, measures implemented by universities, such as transitioning to remote work and conducting on-site classes online, significantly contributed to the reduction of greenhouse gas emissions during the years 2020 to 2021.

GHG emissions of the combined scenario compared to the BAU scenario at Thammasat University (Lampang campus).
Alternative energy utilization scenario
Considering that the largest portion of GHG emissions originates from electricity purchases, a reduction in electricity consumption should be prioritized. Implementing solar panels with on-grid systems, including solar farms and floating solar panels, presents a favorable strategy for reducing GHG emissions. The feasibility of expanding solar panel installations should be explored.
However, the university has not yet set specific targets for reducing GHG emissions or outlined plans for alternative energy adoption, although it supports such initiatives. As a result, this mitigation strategy will be developed based on the available unused areas for installing solar systems, potentially becoming a policy consideration for the university in the near future.
The analysis and design of both a solar farm or a floating solar system utilizing PVSyst software (version 7.4)35 -39 have been carried out within an area of 1908 m2 which including both unused area and water puddle areas. The solar system is based on electricity consumption throughout the day. A system with a capacity of 403 kWp was tested, resulting in an estimated annual production of 552 MWh. The performance ratio achieved was 0.77. Consequently, when the power factor falls within the range of 0.7 to 0.9, 33 the system operates effectively. In the solar system scenario, the floating solar system and the solar farm system are scheduled for installation in 2024 and 2027, respectively. As a result, GHG emissions have significantly decreased from 1051.70 tCO2eq in the base year to 483.71 tCO2eq in 2030.
Although alternative energy sources, such as solar power, are proposed as measures to reduce GHG emissions and significantly decrease emissions at the University, attention should also be given to energy consumption related to electricity production. The energy sector is moving closer to a substantial dependence on renewable energy sources, which involves actions like gradually eliminating lignite and expanding the utilization of low-carbon fuels like biofuels, among other measures.40 -42 In addition, there is a growing momentum toward embracing low-carbon fuel options, notably biofuels, which are considered carbon-neutral regarding the CO2 emissions generated directly from their combustion. This is because they do not contribute additional CO2 to the atmosphere, taking into account the CO2 absorbed during the plants’ photosynthesis process.
Combined scenario
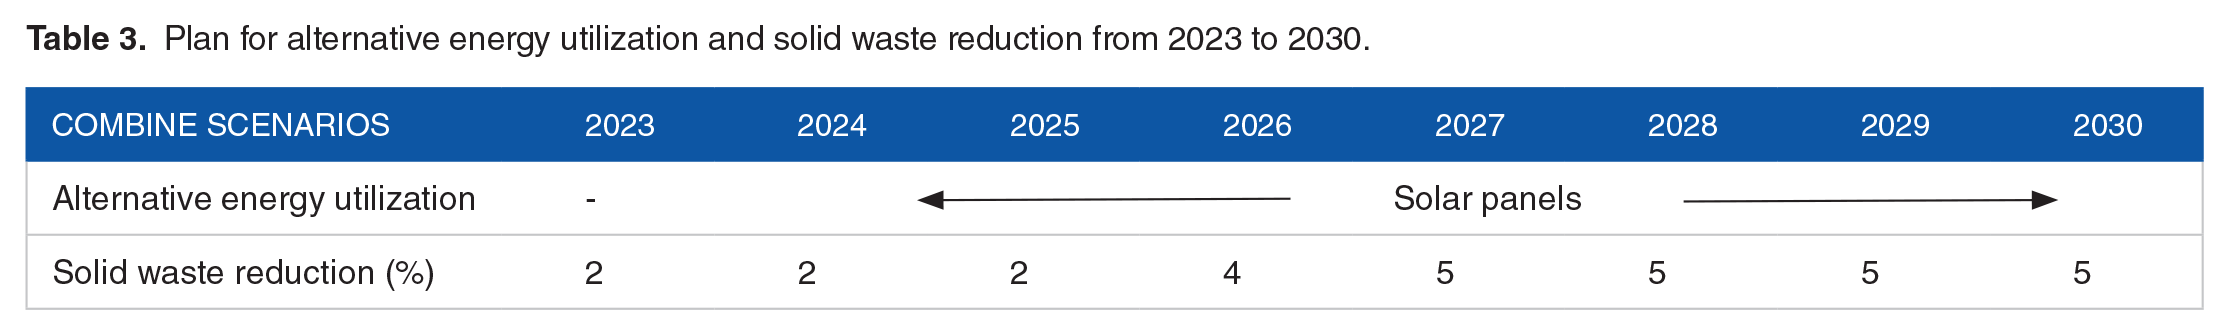
The evaluation in 2030 considered a combination of alternative energy under specific conditions, along with the first scenario, and a solid waste reduction of approximately 30%. While the university promotes waste minimization among staff and students, a specific target has not yet been established. Hence, a solid waste reduction plan is proposed, entailing approximately 2% reduction from 2023 to 2025, 3% in 2026, and 5% from 2027 to 2030. The combined scenario data is presented in Table 3. The results indicated a notable reduction in GHG emissions, decreasing from 1051.70 tCO2eq to 483.71 tCO2eq in 2030 compared to the baseline year. Moreover, this underscores the continued significance of university initiatives, such as energy conservation and efficient resource utilization, in fostering further enhancements.
Plan for alternative energy utilization and solid waste reduction from 2023 to 2030.
Furthermore, gaining insight into stakeholders’ perspectives on the effects of climate change and adaptation is vital for launching customized awareness initiatives directed at individuals accountable for adaptation efforts. It is imperative to ensure that they possess the necessary understanding and knowledge for proficient task completion. Additionally, resolving communication gaps and understanding stakeholders’ perspectives are vital elements for the success of climate change adaptation policies. This approach enables a deeper understanding of the consequences of climate change and enhances the efficiency of adaptation efforts.43,44
Additionally, examining energy communities within the nation, including those affiliated with universities, as well as those spanning international borders, holds significant importance for the development of renewable energy legislation and its effective management. Enhanced access to comprehensive information and knowledge regarding the operations and evolution of these entities must be extended to citizens, institutions, policymakers, and all stakeholders within the energy sector. This measure aims to decentralize control from experts and advisors to these stakeholders, thereby ensuring that autonomy remains vested in their members and partners. 45 Consequently, this approach will foster improved management of the energy sector and a heightened capacity for generating electricity from renewable sources.
Lastly, it’s imperative to note that mitigation strategies go beyond merely curtailing greenhouse gas (GHG) emissions. They also encompass efforts to reduce emissions of air pollutants, including particulate matter and other harmful substances.46,47
Conclusions
The estimation of GHG emissions at Thammasat University (Lampang campus) adheres to the GHG Protocol Corporate Standard approach, following guidelines from WRI and WBCSD. Notably, in typical conditions, the predominant source of GHG emissions in the inventory was electricity procurement, categorized under Scope 2, constituting approximately 78.55%. This was followed by Scope 3 emissions at 12.92% and Scope 1 emissions at 8.53%, respectively.
Hence, the assessment of the alternative energy utilization scenario, including solar systems, is conducted based on the university’s strategies and probability. While alternative energy sources like solar power are suggested to mitigate GHG emissions and notably reduce emissions within the university, consideration should also be directed toward energy consumption associated with power plants. The alternative energy and solid waste management are being evaluated as a combined scenario. Solid waste management emerges as the primary contributor to GHG emissions, and individuals within the university are consistently encouraged to reduce solid waste. However, there is a need for enhanced awareness campaigns regarding waste collection and appropriate disposal techniques.
Furthermore, in assessing GHG emission reduction strategies, alternative energy and combined scenarios are considered as mitigation measures. The findings reveal significant reductions in GHG emissions, amounting to approximately 50.83% and 57.78%, respectively, compared to the baseline year. Consequently, the installation of solar panels, whether in the form of solar farms or floating solar panels, emerges as the most effective choice in mitigating GHG emissions contributing to climate change and aligning with Thammasat University’s sustainability policies. Additionally, the university can provide support and ongoing encouragement for energy-efficient technologies and the promotion of energy conservation practices. The study demonstrates the versatility of this methodology, which can be applied to assess GHG emissions for any organization in monitoring climate change impacts.
Further research into the rigorous lockdown measures enforced during the COVID-19 pandemic suggests their applicability to decarbonization policies, including those implemented within universities. Measures such as transitioning to remote work and conducting online classes on-site have notably contributed to reducing GHG emissions during the pandemic. Additionally, it is imperative to consider the co-benefits of decarbonization policies, particularly their impact on other parameters such as pollutants, in future studies. Embracing these approaches will facilitate the development of more relevant, effective, and successful climate change adaptation policies.
Footnotes
Acknowledgements
The authors would like to express their gratitude to the Centre Administration Division (Lampang Campus), the Property and Sports Management Office, and the Boonchoo Treethong Library for providing the data necessary for evaluating greenhouse gas emissions in this study. This work was supported by the Faculty of Public Health, Thammasat University, and the Thammasat University Research Unit in Environment, Health, and Epidemiology.
Funding:
The author(s) disclosed receipt of the following financial support for the research, authorship, and/or publication of this article: This research was supported by Thammasat University Research Unit in Environment, Health, and Epidemiology for publication purposes.
Declaration of conflicting interests:
The author(s) declared no potential conflicts of interest with respect to the research, authorship, and/or publication of this article.
Author Contributions
Conceptualization, P.T. and D.S.; methodology, P.T.; software, P.T.; validation, P.T.; formal analysis, P.T.; investigation, P.T.; resources, P.T.; data curation, P.T.; writing—original draft preparation, P.T. and D.S.; writing—review and editing, P.T. and D.S.; visualization, P.T.; su-pervision, P.T.; project administration, P.T. and D.S.; funding acquisition, P.T. All authors have read and agreed to the published version of the manuscript.