
Abstract
The study assessed 18 Polycyclic Aromatic Hydrocarbons (PAHs) in O. niloticus (Nile tilapia) sampled from an aquaculture cage (farm) and a wild catch. The PAHs in fish samples were analysed using Gas Chromatography-Mass Spectrometry. Four PAHs (in order of levels: Indeno [1,2,3-cd] pyrene > Anthracene > Perylene > Pyrene; 100-0.8 µg/kg) and only one PAH (Pyrene: 4 µg/kg) were detected in raw samples from the cage and wild catch respectively. Chargrilling significantly increased Pyrene levels after cooking (wild: 4-11 µg/kg; cage: 5-23 µg/kg, p < .05), and likewise Anthracene levels in cage samples (13-153 µg/kg) but decreased Indeno [1,2,3-cd] pyrene levels from 100 ± 20 to 1.2 ± 0.2 µg/kg in cage samples. Smoking significantly increased 13 to 15 PAH congeners’ levels (from < 1.0 up to 340 µg/kg) and total PAHs (wild: 4 to 840 µg/kg; cage: 110 to 560 µg/kg), and decreased Indeno [1,2,3-cd] pyrene (100 to 1.3 µg/kg) in cage samples but showed no effect on Benzo [g, h, i] perylene and Dibenzo [a, h] anthracene levels in all samples. For smoked samples, Benzo [a] pyrene and PAH4 (Benzo [a] anthracene, Chrysene, Benzo [b] fluoranthene, and Benzo [a] pyrene) exceeded the respective maximum permissible limits of 2 µg/kg and 12 µg/kg, and significantly influenced the levels of carcinogenic PAHs (CPAH, 135-170 µg/kg). Nevertheless, the Excess Cancer Risk (ECR) estimates, from a conservative approach, were far below the threshold (10−4), implying that consuming smoked or grilled tilapia from the study site is safe.
Introduction
Fish always receives an important place in human nutrition for its gastronomic benefits and high nutritional value. 1 It provides nutrients like essential long-chain polyunsaturated fatty acids (PUFA), retinol, minerals and vitamins.1 -3 Additionally, it is a source of economical and healthy protein for most people worldwide.4,5 Nile tilapia (O. niloticus) is one of the most consumed tilapia species and represents 84% of global tilapia production.6,7 The high demand for Nile tilapia is due to its high palatability and nutritive value. 8 Although the fish can be eaten raw, it is usually thermally processed with different culinary techniques before consumption.4,9
In Ghana, the fisheries sector plays a vital role in the country’s socio-economic development 10 by providing about 60% of the total protein needs of citizens. 11 Fish exports account for about 5% of the country’s total agricultural gross domestic product. 12 Again, smoking using dry heat from burning fuelwood is the most practised method of cooking fish.13,14 Recently, however, grilling has also gained popularity in the catering sector and many homes in the country for preparing tilapia cuisine. 12 Meanwhile, fishes, including tilapia, are found to be adulterated with several environmental contaminants, including Polycyclic Aromatic Hydrocarbons (PAHs) from their habitats 15 and through culinary methods like dry heat-based frying, drying, smoking and grilling.14,16
PAHs are a class of complex, semi-volatile and persistent hydrophobic organic pollutants which contain 2 or more fused aromatic rings in a linear, angular or clustered arrangement.17,18 Some of these compounds are well-known carcinogens, mutagens, and teratogens. 19 PAHs exist in different environmental media and are primarily introduced into the environment from natural sources such as forest fires, volcanic eruptions or anthropogenic activities like the combustion of organic matter, fossil fuels, and industrial processes. 20 Once released, all environmental compartments are affected PAHs, including contamination of aquatic and terrestrial species. 18 PAH contaminations in aquatic ecosystems may also emanate from the feed used in aquaculture farms, discharges from industries, and wastewater treatment plants. 21 Meanwhile, due to the top position occupied by fish in the aquatic food chain, there is a high risk of bioaccumulating contaminants from food sources, 22 apart from the risk of exposure to aquatic contaminants in the background water and sediments.23,24 Thus, aquatic contaminants are often estimated using the corresponding levels detected in fish organs.25 -27
It is also suspected that thermal processes produce toxic byproducts through PAHs precursors. 28 PAHs are unintentionally generated in cooked foods, and dietary ingestion of these PAHs is regarded as the dominant route of exposure to PAHs. 29 Although the exact mechanism of PAH formation during food grilling or smoking is not known, it is usually attributed to the pyrolysis of organic matter such as fat, protein, and carbohydrates, over an open flame especially at temperatures of at least 200°C. 19
However, in developing countries like Ghana, there is a dearth of comprehensive data on the level, nature and associated health risks of aquatic foodborne contaminants. 30 Though enough studies exist on PAHs in cooked fish, the dietary exposure levels vary among different countries 31 and there should be enough in-country studies for evidence-based decision making to improve public health safety. Yet, studies in Ghana on PAHs like other contaminants in cooked fish are limited 32 and very few focus on inland fish species like tilapia. As already indicated, fresh smoked and grilled tilapia has become a popular delicacy in recent times and there could be public health threat from unsafe levels of PAHs due to the fish sources and cooking processes – smoking and grilling.33,34 Also, most local studies have concentrated on smoked fish samples from the traditional markets mostly smoked for preservation and storage, and flavour,32,35 and not ready-to-eat wet hot smoked or grilled tilapia.
The potential health risk from eating contaminant-laden fish has necessitated the establishment of regulatory standards such as maximum permissible limits (MPL) for various contaminants, including polycyclic aromatic hydrocarbons (PAHs). However, due to weak regulatory enforcement in the food sector, public health safety concerns are alarming 36 , and therefore more studies are needed for informed decisions. This paper, therefore, assesses the effect of cooking methods (smoking and chargrilling) on the levels of 18 PAH congeners and the associated health risk from consuming Nile tilapia (O. niloticus) from wild and cage (farm) settings. It further serves as a complementary study to an earlier publication on toxic metal(loid) levels in fresh tilapia from the Afram Arm of the Volta Lake in Ghana. 37
Materials and Methods
Study area
The Afram Arm of the Volta Lake is one of the tributaries of the Lake in Ghana, which collects all the drainage of the Kwahu Plateau. 38 The river is about 100 km and stretches from latitude 6° 50′ 53.81″ N and Longitude 0° 43′ 25.49″ E. 37 The Volta Lake is part of the Volta Basin, covering approximately 400 000 km2 area within 6 West African countries, with 42% allocation in Ghana, 43% in Burkina Faso and 15% in Togo, Cote d’Ivoire, Mali and Benin. 39 Locally, the lake serves the purposes of inland transportation, irrigation and fish farming. 12 Meanwhile, the entire Volta Lake is estimated to host about 140 fish species and contributes at least 90% of Ghana’s total inland fishery production. 12
The selected fishing communities for the study, Adawso and Ekye Amanfrom, are almost directly opposite each other and are separated by about a 3 km stretch of watercourse. 37 The 2 communities are notable for fish sales, including raw fresh and smoked tilapia. The fish sources in these communities are mainly wild catch and cage (aquaculture farms mounted on the river). Adawso town had the cage farms at the time of the study. 37 The cage farms were similar to other aquaculture farms usually mounted on the Volta Lake – consisting of a frame made of welded galvanised pipes, floatation (plastic or metal barrels), and netting – nylon nets of various mesh sizes. 40
Fish sample collection
The sample collection was done in June 2020 and followed the approach published in an earlier paper on toxic metal(loids) associated with the fish samples. 37 Adequate fresh tilapia samples of comparable sizes (fork length 20.0-26.0 cm) were collected separately from the cage farm and wild catch sources and appropriately packaged and dispatched within 24 hours to a local griller and smoker for cooking, and also Ghana Standard Authority (GSA) laboratory for raw sample analysis.
Cooking tilapia samples
The two methods of cooking – chargrilling and smoking were used as described in Adherr et al. 37 A local griller and smoker were purposively chosen to cook wild catch and cage tilapia samples separately with no spicing after preparing the fish with brine of 10% w/v NaCl, under approximately 30 minutes at 120°C ± 10°C for the grilling, and 4 hr at about 180°C ± 20°C for smoking according to Adherr et al 37 as summarised in the flowchart (Figure 1) before packaging samples to the laboratory for analyses. Neem wood was purposively used for the smoking of fish because of its popularity as a fuel source for smoking in the study area.

Flowchart depicting the cooking conditions.
PAHs extraction and analyses
Fish samples from cold storage were thawed at room temperature for one (1) hour. Fillet (muscles) of samples (raw, grilled, smoked) were separated from the bones, head, and tail. 37 Each fillet sample was chopped into pieces with a clean stainless-steel knife and homogenised for about 5 minutes using a mixer grinder (Panasonic Mx Ac310 H) to produce homogenates. Samples for Gas Chromatography were prepared from homogenates using an extraction method based on Agilent Bond Elut QuEChERS dSPE Sample Preparation. 41 A 15 ml volume of acetonitrile was added to 3 (± 0.05) g of each homogenate in PTFE centrifuge tubes and thoroughly shaken with a multi-tube vortexer for 5 minutes at 2500 rpm (978x g). The sample was centrifuged (using Hermle Z 300) for 5 minutes at a speed of 3500 rpm (1917x g). A 6 ml volume of the supernatant was transferred in QuEChERS tubes containing absorbents (0.9 g MgSO4, 0.15 g PSA and 0.15 g C18). The mixtures were vortexed for 1 minute at 2500 rpm (978x g) and centrifuged at 3500 rpm (1917x g) for 5 minutes. Afterwards, 4 ml of the supernatant was rotary evaporated below 40°C to dryness, and 1 ml of ethyl acetate was added and sonicated (Clifton SW3H) for about 3 minutes. Final extracts were transferred into labelled standard open glass vials for quantitation by using the Gas Chromotagraphy Mass Spectrometry (GC-MS). 41
Eighteen (18) PAH congeners were analysed namely, Naphthalene (NaP), Acenaphthylene (AcPY), Acenaphthene (AcP), Fluorene (Flu), Phenanthrene (Phe), Anthracene (Ant), Fluoranthene (FL), Pyrene (Pyr), Benzo [a] anthracene (B[a]A), Chrysene (Chr), Benzo [b] fluoranthene (B[b]FL), Benzo [k] fluoranthene (B[k]FL), Benzo [a] pyrene (B[a]P), Benzo [e] pyrene (B[e]P), Perylene (Pyl), Indeno [1,2,3-cd] pyrene (Ind), Benzo [g, h, i] perylene (BP) and Dibenzo [a, h] anthracene (DBA). The PAHs were analysed using GC-MS (Agilent Technologies GC system 7890B/Agilent Technologies GC Sampler 80/GC-MS Triple Quad 7000C) with High-Efficiency DB-5ms Ultra Inert GC Column under standard chromatographic conditions defined in existing Agilent application notes. 42 Quality Control (QC) samples were spiked with 30 μL of 0.1 μg/ml of an internal standard containing a mixture of 18 PAH congeners (PAH-Mix 45 by Dr Ehrenstorfer GmBH) to yield QC similar to that in Tran-Lam et al 43 . These quality control samples were taken through the same processes of extraction and purification as the test samples. Extractions of water and acetonitrile aliquots were prepared in the same manner as the samples and served as reagent blanks. Calibration standards of different concentrations of 2, 10, 20, 50, 100, 200 and 500 ppb were used to generate calibration curves for the internal standard quantification method of GC-MS. 44 The Limit of Detection (LOD) was calculated as part of the method validation process. Replicates of the calibration standards solution close to the lowest concentration presenting a clear signal were prepared. The calibration standards were analysed on the instrument and the LOD as well as the limit of quantification (LOQ) were estimated from the results. The LOD was calculated based on the standard deviation of the instrument response or area (SD) of the curve and the calibration curve (S). The LOD was 3.3 (SD/D) while that of LOQ was 10 (SD/D). 45 The LOQ for the analyses was 1.0 µg/kg. All analyses were done in triplicates, and the recoveries made for the 18 PAH congeners were within the standard range of the European Union (50%-120%) 46 and 80% to 120% adopted by the Ghana Standard Authority (GSA) laboratory standard operating procedures (SOPs) (Table 1) (Also see Supplemental Sheet 1 for more details on the report of calibration cure, chromatogram and quantification of PAHs).
Recoveries (%) and RSD for the 18 PAHs in study samples (n = 3).

Abbreviation: RSD, relative standard deviation.
Data analyses
PAH congeners were descriptively presented as mean with standard deviation (SD) in terms of wet weight. Additionally, various PAH groups were reported as follows: PAH4 (sum of B[a]A, Chr, B[b]FL, and B[a]P), 47 PAH16 (sum of NaP, AcPY, AcP, Flu, Phe, Ant, FL, Pyr, B[a]A, Chr, B[b]FL, B[k]FL, B[a]P, Ind, BP, DBA), 48 total low molecular weight PAHs (LMWPAH, ie, sum of PAHs that contain less than 4 rings with a molecular weight ranging between 152-202 gmol−1 - NaP, AcPY, AcP, Flu, Phe, Ant, FL and Pyr), 48 total high molecular weight PAHs (HMWPAH, ie, sum of PAH that contain 5-7 rings with weights ranging from 228 to 278 gmol−1 - B[a]A, Chr, B[b]FL, B[k]FL, B[a]P, B[e]P, Pyl, Ind, BP and DBA), 48 total carcinogenic PAHs (CPAH, ie, the sum of B[a]A, B[b]FL, B [a]P, DBA, B[a]FL, B[k]FL, Ind and Chr),19,49 and total PAHs (PAH18, ie, the sum of PAH16, B[e]P, and Pyl). The data passed the Shapiro – Wilk and Levene tests for normality and homogeneity of variances. 50 The mean levels of PAHs in samples from the different environments (wild and cage) were performed by independent samples T-test, whiles One-way ANOVA was used to compare the mean levels of PAHs in the different samples (raw, chargrilled, and smoked) with the Tukey’s HSD post hoc test performed to establish any significant mean difference following the ANOVA test. 37 IBM SPSS Statistics 25 software (IBM Corp., Armonk, NY, USA) was used for the analyses, and where appropriate at a 5% (0.05) 2-tailed significance level.
Health risk assessments
The consumption of fish contaminated with PAHs could adversely affect the health of the human population. 23 Therefore, human intake and health risk assessment models have been used to estimate the health risk associated with PAH through fish consumption.23,51 PAHs usually occur as a complex mixture, and therefore it is uncommon to find only one PAH in food. 52 However, among the various PAHs in fish, B[a]P is separately monitored, and its presence and levels indicate the presence of other PAHs. 14 Thus, B[a]Peq is employed in the health risk assessment of other PAHs. The total B[a]Peq in any food is the overall toxicity of the PAH mixtures estimated using equation (1). 23

Where C is the concentration of PAH (mg/kg), and TEF is the Toxicity Equivalence Factor which expresses the potency of PAH relative to B[a]P. 53
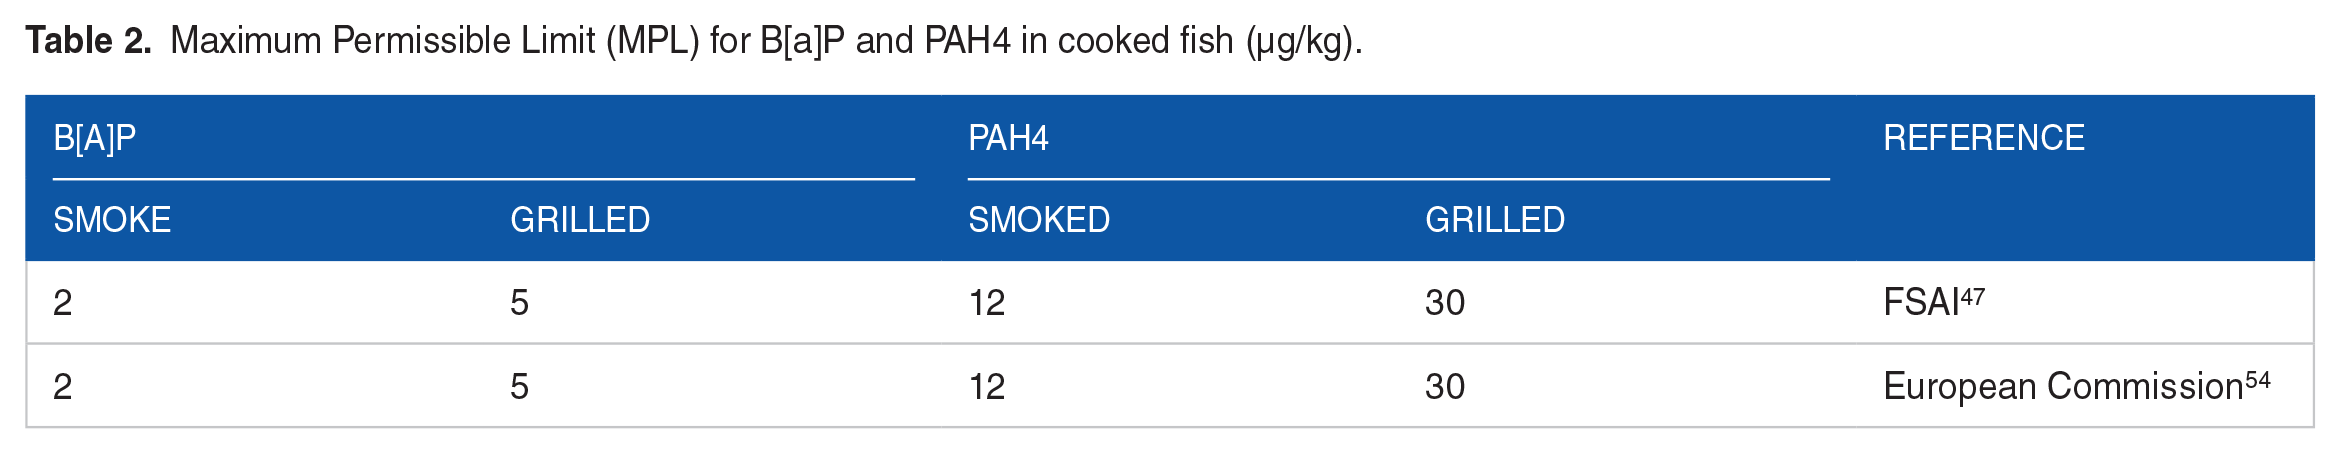
PAH4 is, however, the most suitable indicator for carcinogenic PAHs in food. 47 The PAH4 model ensures that in samples where B[a]P is not detectable, the presence of other PAHs could be used to indicate the occurrence and toxicity of PAHs in food. 54 The PAH4 in this study is estimated with equation (2). 47 Meanwhile, the maximum permissible limit (MPL) for B[a]P and PAH4 cooked fish (smoked and grilled) is shown in Table 2.

Maximum Permissible Limit (MPL) for B[a]P and PAH4 in cooked fish (µg/kg).
This study adopted the widely used Excess Cancer Risk (ECR) model equation (3) 23 for the carcinogenic health risk associated with PAH consumption through food.
Where Q is the carcinogenic potency of B[a]P = 7.3 mgkg−1day−1 55,56; EDtot is the total exposure duration = 70 years 57 ; ATn is the averaging time (365 d/y × 70 years ) =25 550 days; BWa is average adult body weight in Ghana = 60 kg 58 ; and FIR is the fish ingestion rate = 0.078 kg/capita/day. 59 Although the TEF approach is least accurate in determining cancer risk, 60 it could be used in studies61,62 because it is considered a reasonable alternative, 63 especially where PAH4, a more suitable carcinogenic PAH exposure index, is also estimated.
Condition factor for tilapia health status
Based on the condition factor model using fish weight and fork length, 64 the condition factor (K) showed that the fish samples were healthy (K > 1gcm−3,65), similar, and favourably comparable. 37
Limitations of the study
Apart from the limitations identified in the earlier published paper such as limited sample size, no consideration for seasonal variations, non-assessment of fish viscera and bones, and lack of analyses of contaminants in background water and sediment, 37 there were also lack of anlayses on moisture and fat content of the tilapia samples to inform potential influence including fish fat/oil pyrolysis on the levels of PAHs.14,66
Results and Discussion
PAHs levels in raw tilapia samples
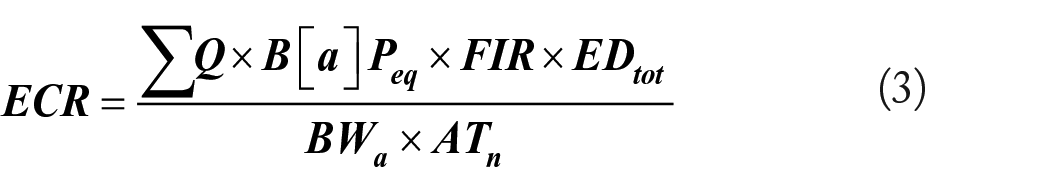
Pyr was the only PAH detected in raw wild samples, while Ant, Pyr, Pyl and Ind were detected in raw cage samples, and in a particular case at a higher level – 100 µg/kg for Ind (see Figure 2). The 3 more PAH congeners found in cage samples could be explained by the assertion that PAH levels in fish are strongly affected by feeding habits 67 especially where farmers rely on commercial fish feed formulated with agrochemicals and antibiotics which are potential sources of PAHs. 68 For Pyr detected across samples (both wild and cage settings), the levels were comparable without any statistically significant difference (4 vs 5 µg/kg, p > .05), although cage samples had a comparatively marginal increased level, likely due to similar reasons as explained earlier. Also, the cage settings could have more anthropogenic influence on PAH levels likely due to petroleum related activities like fuel combustion from engines used for commuting on the river. 69
Levels of PAH congeners and groups detected in raw samples [Lefthand graph: mean concentration of PAH congeners, and Righthand graph: mean concentration of PAH groups].
However, comparatively fewer PAH congeners and lower levels are reported in our current study than recorded in similar studies (156 – 13900 µg/kg) from Kuwait, 70 Nigeria, 71 and Egypt. 72 The difference could be attributed to different environmental settings, especially anthropogenic activities and prevailing conditions, including urban runoff, atmospheric deposition, spills and leaks of oil and petroleum-based products from transport systems. 73 Also, the different levels of uptake of terrigenous materials potentially through the aquatic food chain, including ingestion by fish, could contribute to the differences. 74 Although background water and sediments were not analysed for PAHs, the low levels of PAH congeners in raw fish suggest that the aquatic environment (water body) at the study site could be less polluted than the other studies cited from Kuwait, Nigeria, and Egypt. This is because fishes serve as bio-indicators of monitoring pollution in aquatic ecosystems due to their critical position in the trophic level of the food web, and therefore contaminants’ levels in tissues and visceral are proxy for pollution levels, among other factors. 73
Although PAH4 was not detected in any raw samples, other PAH groups – HMWPAH, LMWPAH, PAH18, PAH16 and CPAH generally showed high levels in raw cage samples in magnitude of about 28 to over 100 times more than detected in the wild catch (Figure 2). This was expected, because comparatively few more PAH congeners were detected in samples from the cage than in the wild. Yet, the total PAHs, PAH18 and PAH16, in this study were lower than reported in a similar study from the Arabian Gulf. 70 Meanwhile, the ratio of LMWPAH to HMWPAH, a measure of the possible source of PAH, was estimated as 0.18 ± 0.05 for the PAH congeners detected in raw cage samples. According to Rocher et al 75 , a ratio < 1 suggests a pyrolytic (pyrogenic) origin for the detected PAH congeners. From that perspective, it is possible that the outboard motors and pontoons operated on the Volta Lake, the primary means of transportation for the riverine communities, including the study sites, 76 could be the primary sources of the detected PAHs. This may be so because the fuel, motor/engine oil and other petroleum products associated with engines serve as sources of pyrogenic PAH contamination in water bodies. 77 Yet, lower levels and very few PAH congeners are found in raw tilapia samples in our present study. Although fishes may naturally contain low levels of PAH congeners, as asserted by Stołyhwo and Sikorski 78 , the findings also suggest that the study site, Afram Arm of the Volta Lake, is less polluted with no known (heavy) industrial activities such as petroleum exploitation (including offshore production and transportation), and effluent from wastewater plants which constitute significant sources of PAHs contaminations in water bodies.79,80
The effect of chargrilling and smoking on PAH levels
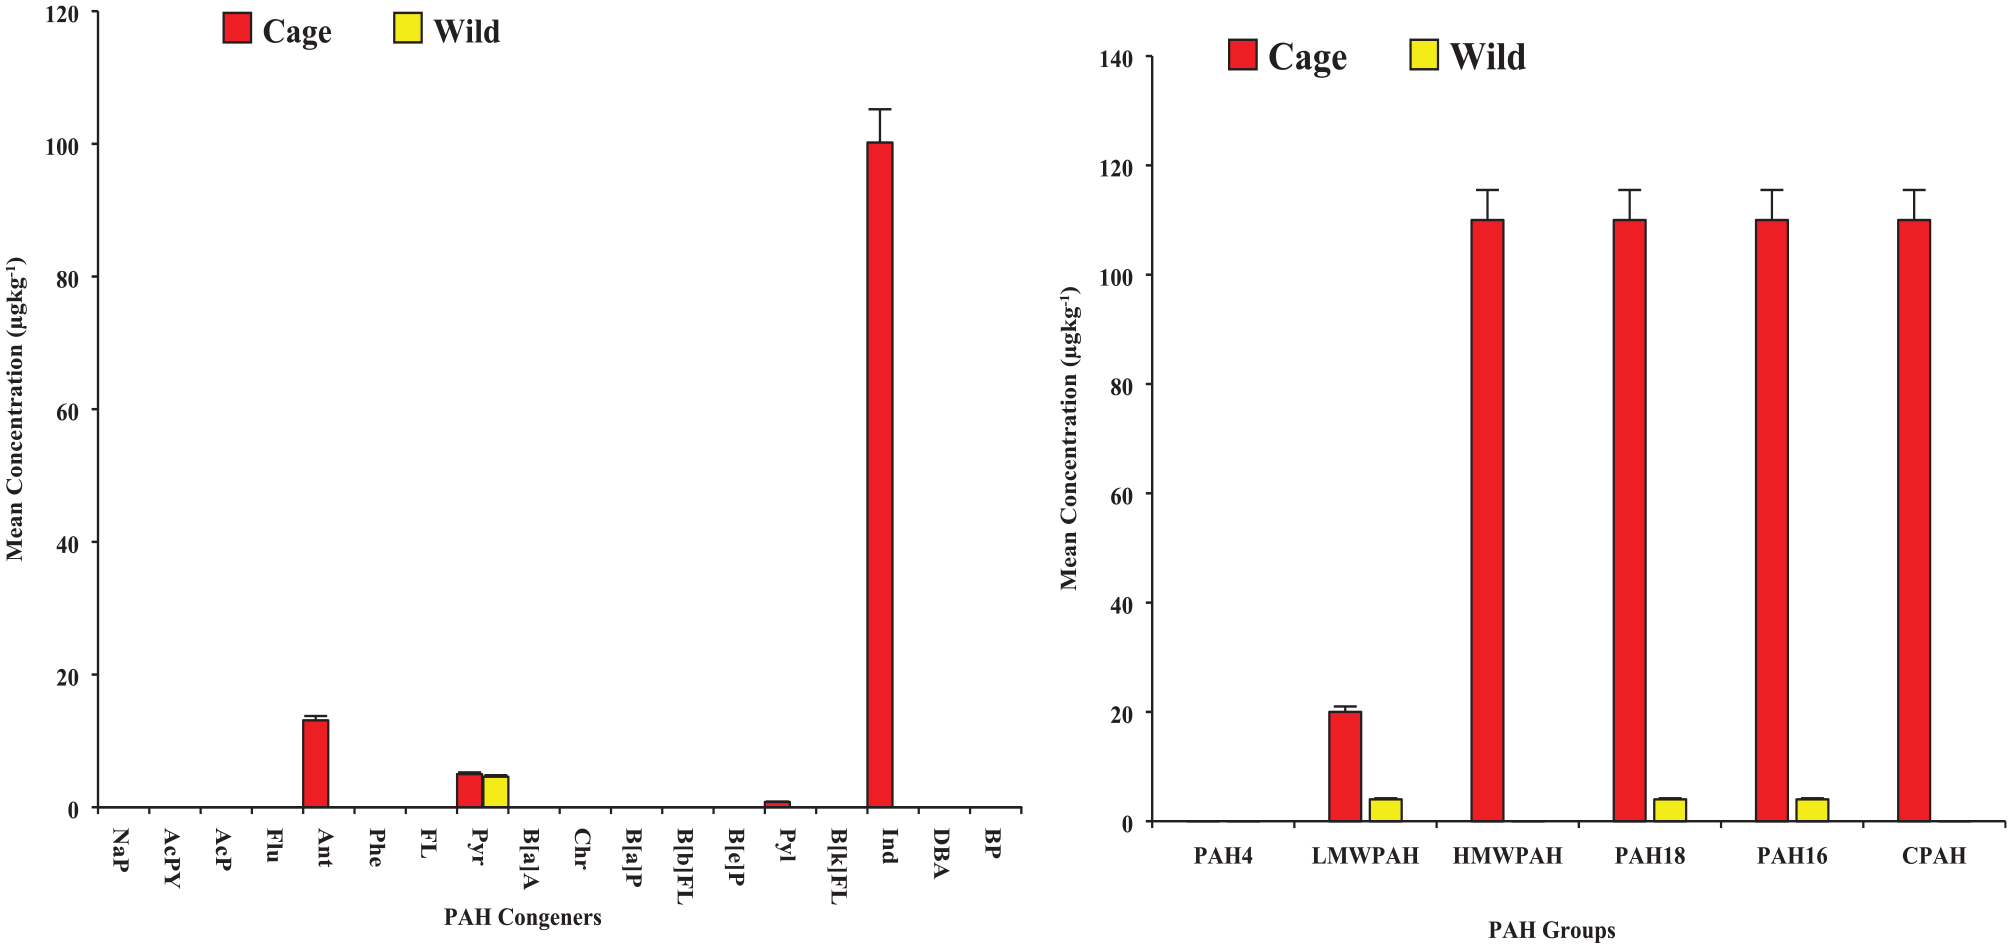
Six (6) PAH congeners (Ant > Pyr > FL > B[a]A > Pyl = Ind), and five (5) PAH congeners (Ant > Pyr > FL = B[a]A > Ind) were detected in chargrilled wild and cage samples respectively (Figure 3). It was realised that chargrilling introduced into wild tilapia 5 PAH congeners (Ant > FL > B[a]A > Pyl = Ind in order of levels around 1-106 µg/kg), and into cage tilapia 4 PAH congeners (Ant > Pyr > FL = B[a]A) after cooking. In wild samples, chargrilling did not significantly increase the levels of Pyr after cooking (mean difference, md: 7 µg/kg, p > .05). However, it significantly increased the levels of Ant (md: 140 µg/kg, p < .05), and Pyr (md: 18 µg/kg, p < .05) and decreased Ind levels (md: 98.8 µg/kg, p < .05) in cage samples after cooking (see Table 3). The general increase in PAH levels may be because the grilling was done over open flames, which could have caused fat to drip onto the flames, producing more smoke and PAHs, which could get deposited onto the fish. 81
Mean Levels of PAHs congeners in tilapia samples [Lefthand graph: results for samples from cage environment; and Righthand graph: results for samples from wild environment].
Comparison of levels of PAHs (µg/kg) and ECR in samples.
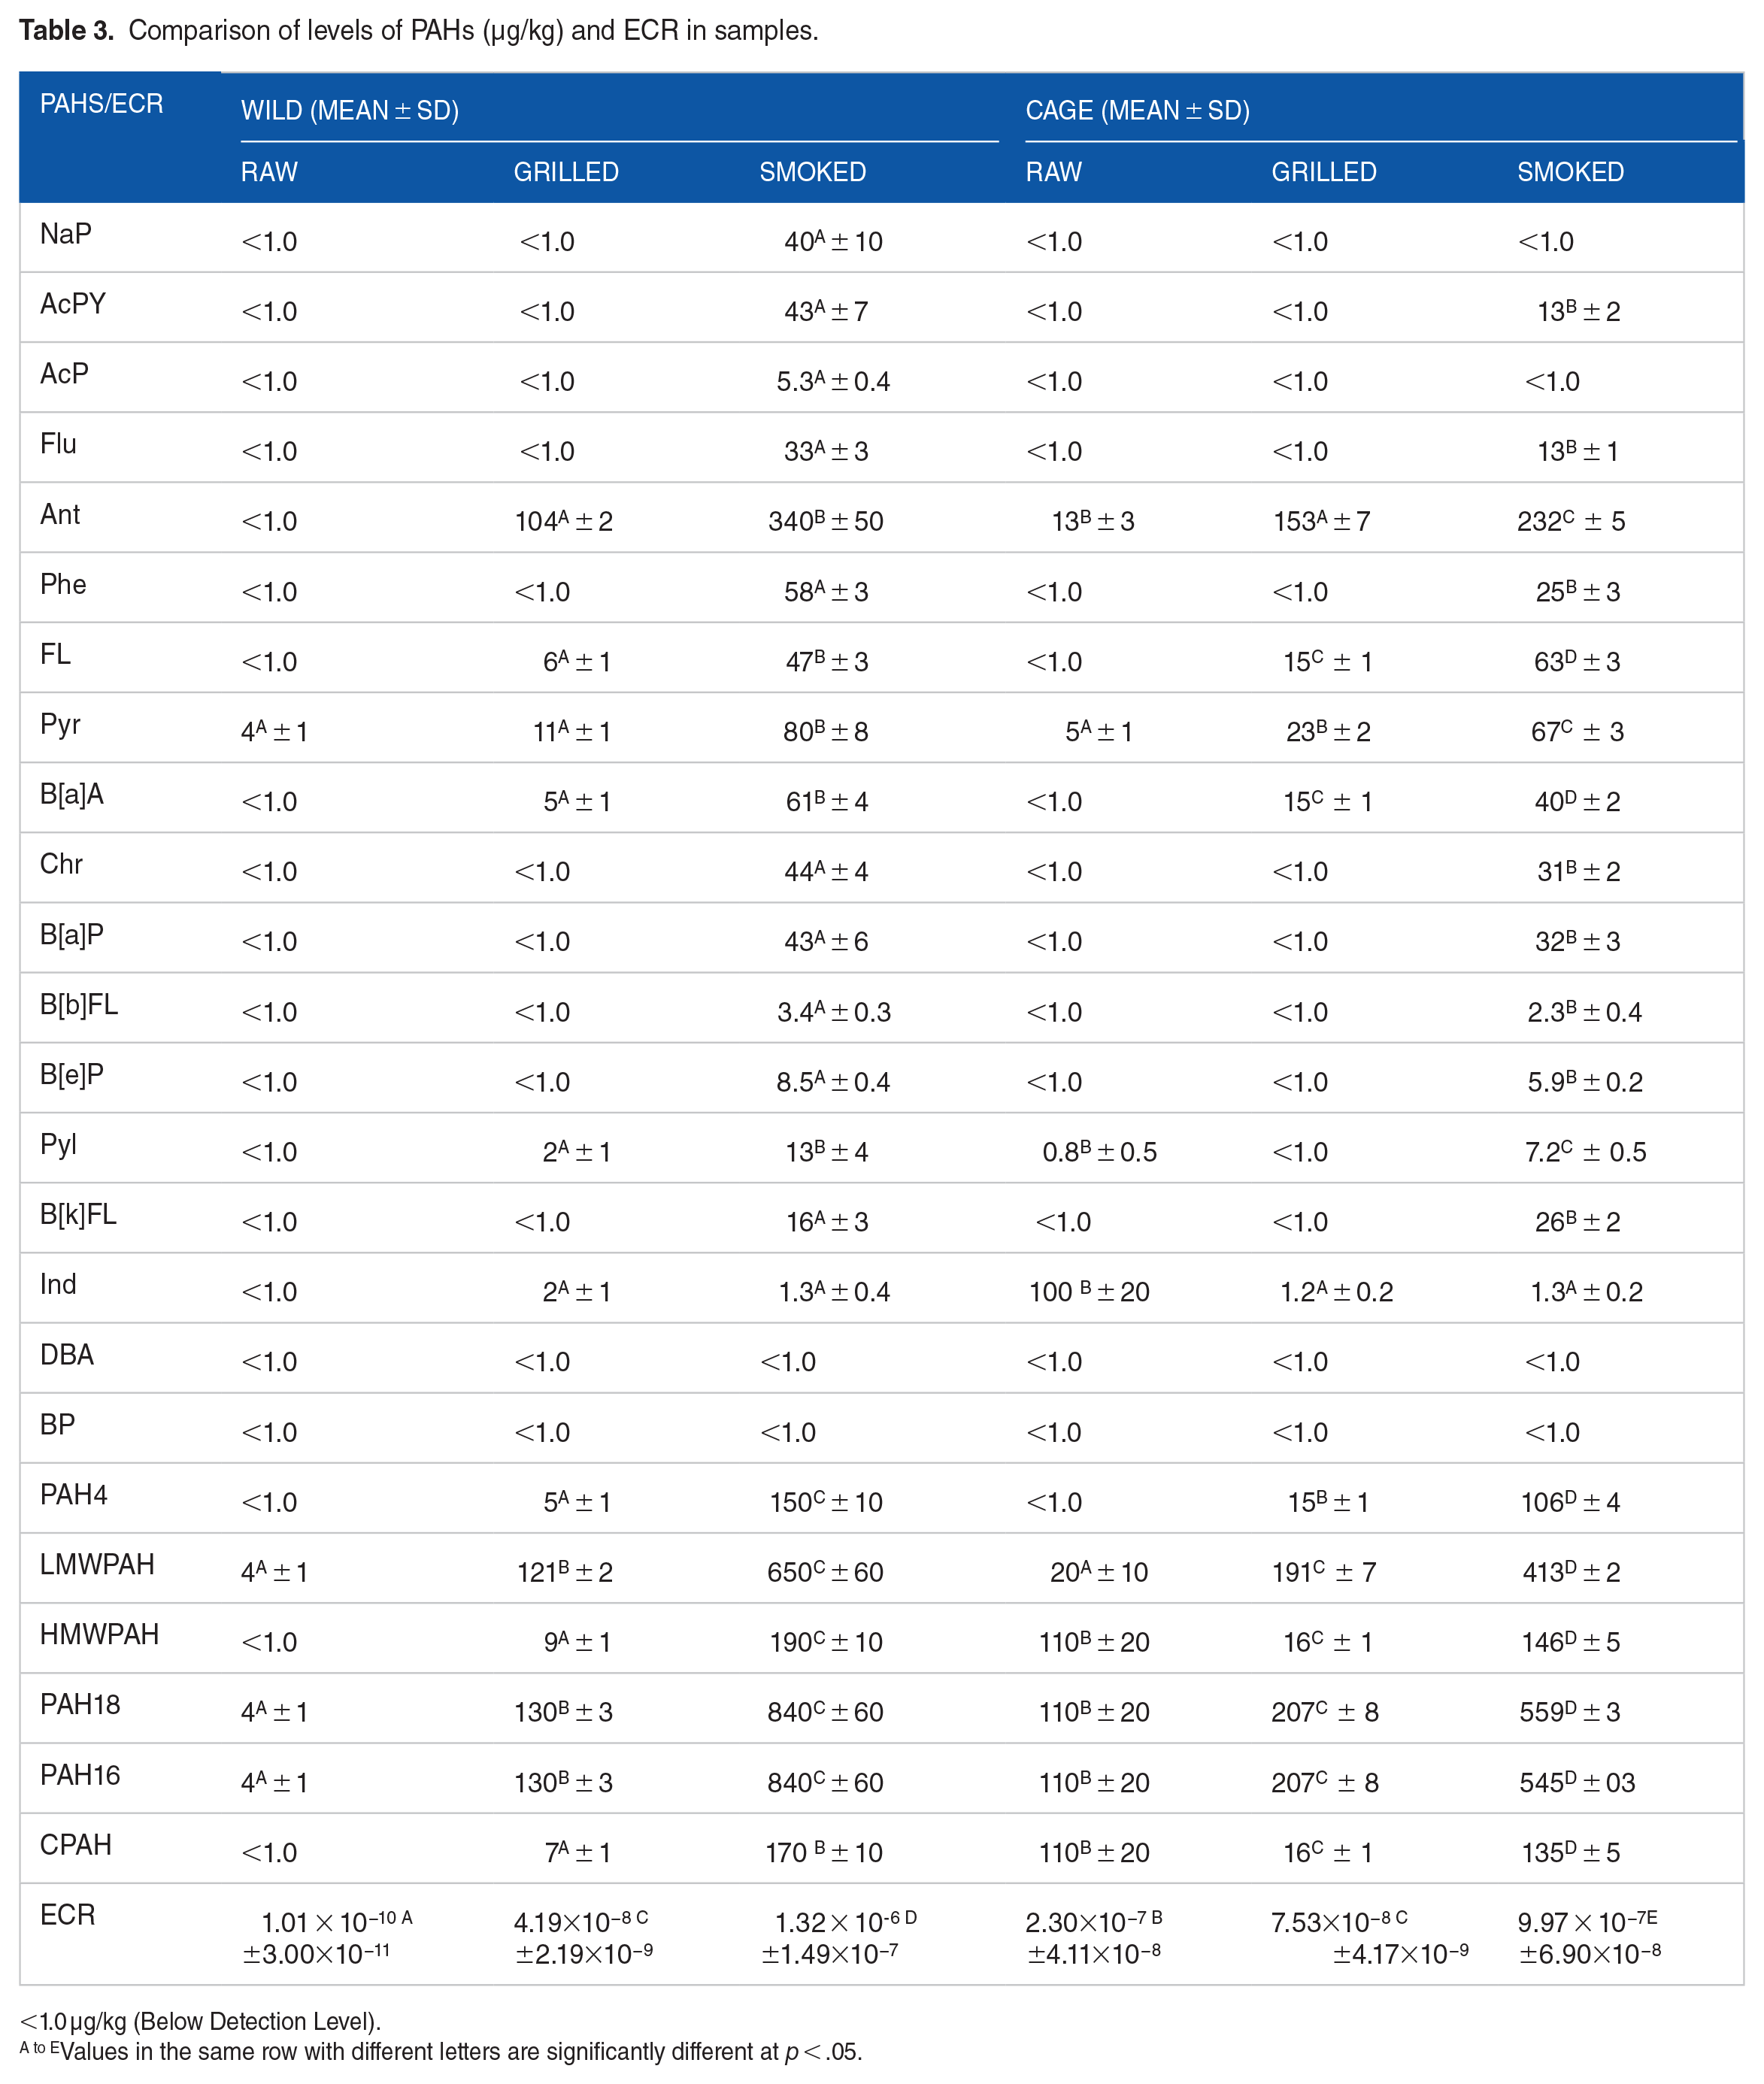
<1.0 µg/kg (Below Detection Level).
Values in the same row with different letters are significantly different at p < .05.
Although chargrilling decreased Ind levels in cage samples (1.2 µg/kg), the corresponding mean increase in wild tilapia (2 µg/kg) was not significantly different (p > .05), suggesting a similar effect of chargrilling and smoking on Ind levels. However, the decreased Ind levels in cage samples could be linked to its decomposition into other fume products in the heating process. 82
However, for Ant, FL, Pyr and B[a]A levels, the differences between the chargrilled cage and wild tilapia were significant, with high levels coming from the cage samples. The difference observed in the effect of chargrilling on Ind in the cage and wild samples was a surprise since both samples were cooked similarly and were of comparable health status, size, and length. This could however be attributable to several factors. Firstly, by speculation, the difference could be linked to more net fat loss during cooking in cage samples likely because of more fat tissues in cage than wild. 83 High fat solubility of PAH 33 and dripping off during cooking without a corresponding high fat pyrolysis to increase PAH 84 in cooked fish could partly explain the observation. It is suspected in our current study that the cage samples could be comparatively richer in fat tissues than the wild. Additionally, at high temperatures grilling and smoking result in a variety of chemical processes including the degradation of polycyclic aromatic hydrocarbons (PAHs) and the formation of new compounds from high molecular weight PAHs (such as Ind) 85 (Tersagh et al., 2018). Also, high molecular weight PAHs including Ind can be degraded by certain bacteria. 86 Even though this is usually in the environmental context, likely a related mechanism could help reduce PAH levels during food preparation including the case of Ind in this study as intimated earlier.
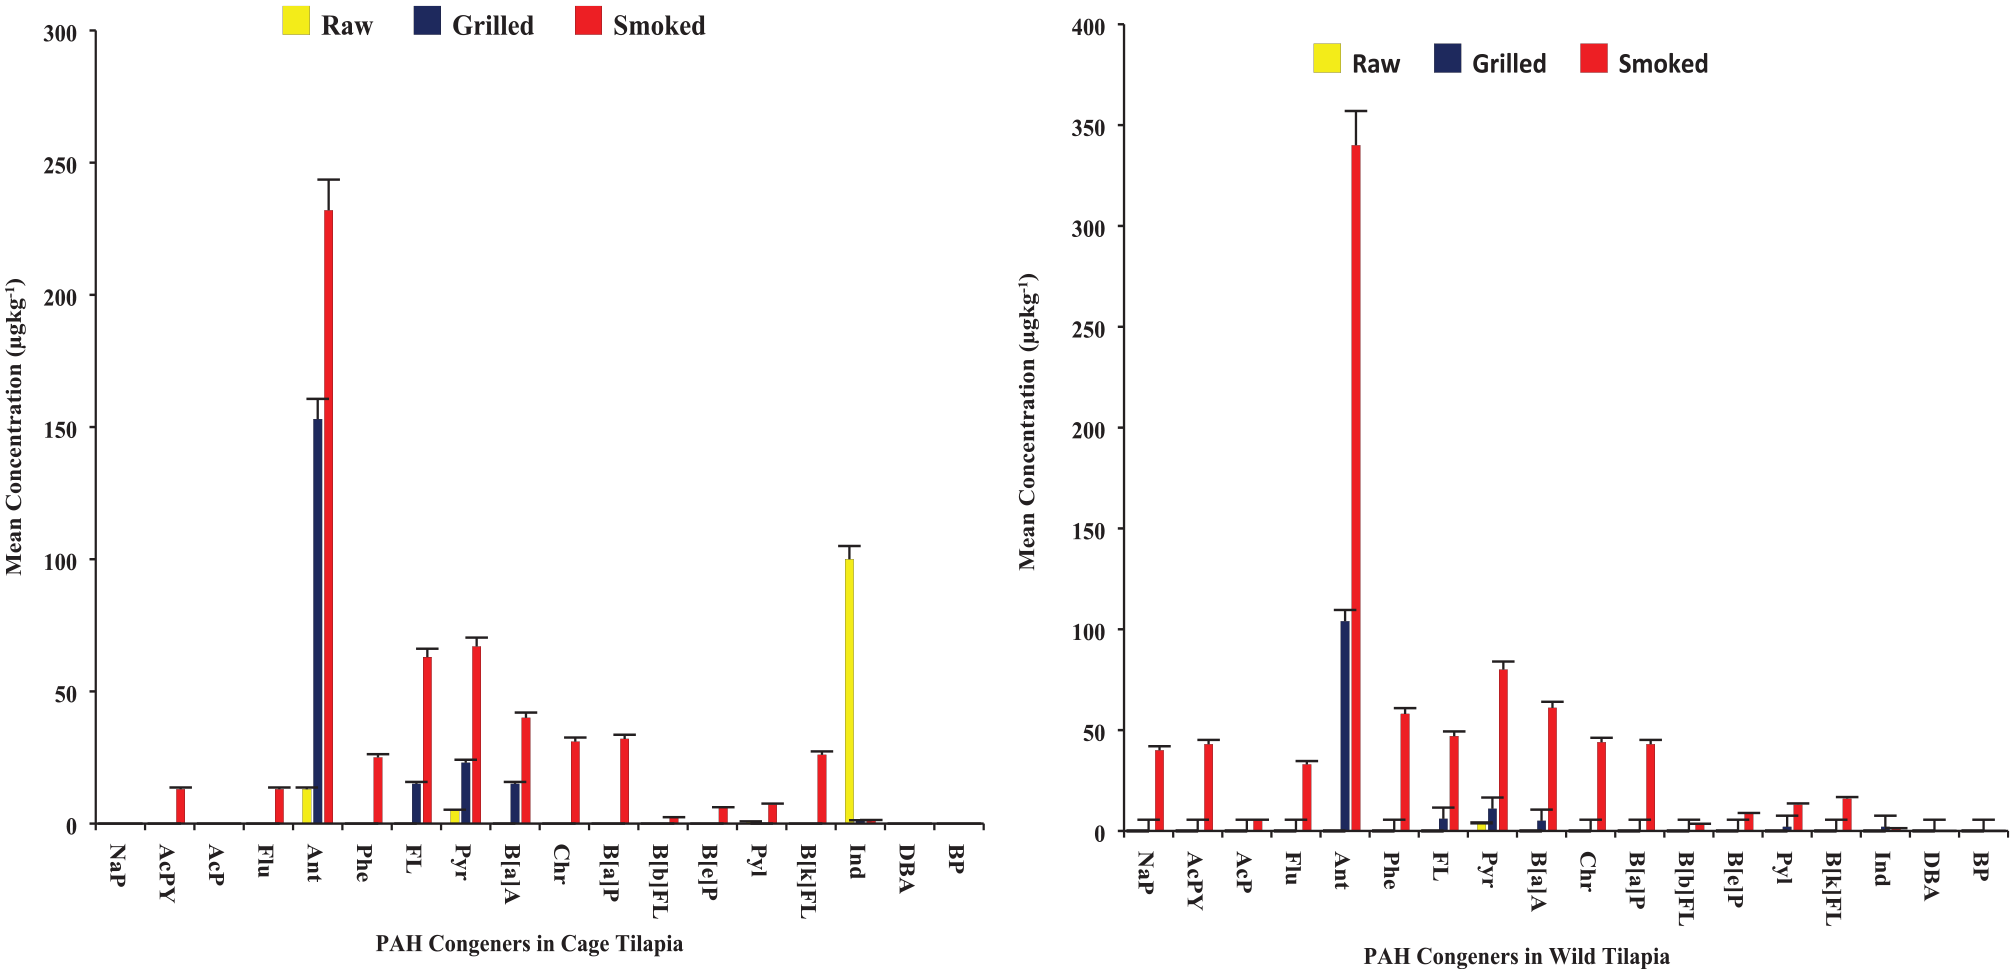
Also, fat-rich food products are more susceptible to PAH formation,33,81 hence higher Ant, FL, Pyr and B[a]A levels observed in cage samples could be partly due to suspected high fat leached into the fuel during the cooking than wild counterparts. Indeed, chargrilling did not affect levels of the PAH congeners; Phe, Chr, AcPY, B[a]P, NaP, Flu, B[k]FL, B[e]P, AcP and B[b]FL in all samples probably due to the lower temperature (120°C) and cooking times (30 minutes) employed in the grilling method. The order of PAH group levels in chargrilled tilapia was however similar for both wild and cage samples – PAH18 = PAH16 > LMWPAH >HMWPAH >CPAH >PAH4 (see Figure 4). Except for CPAH levels in cage samples which decreased, chargrilling increased all other PAH groups for wild and cage samples (see Figure 4 and Table 3). After chargrilling, the CPAH levels decreased by almost 85% (from a mean of 110 to 16 µg/kg, Table 3). This significant reduction was expected due to the decrease in Ind levels which constituted a greater proportion (over 80%) of the CPAH detected in raw cage samples before chargrilling.
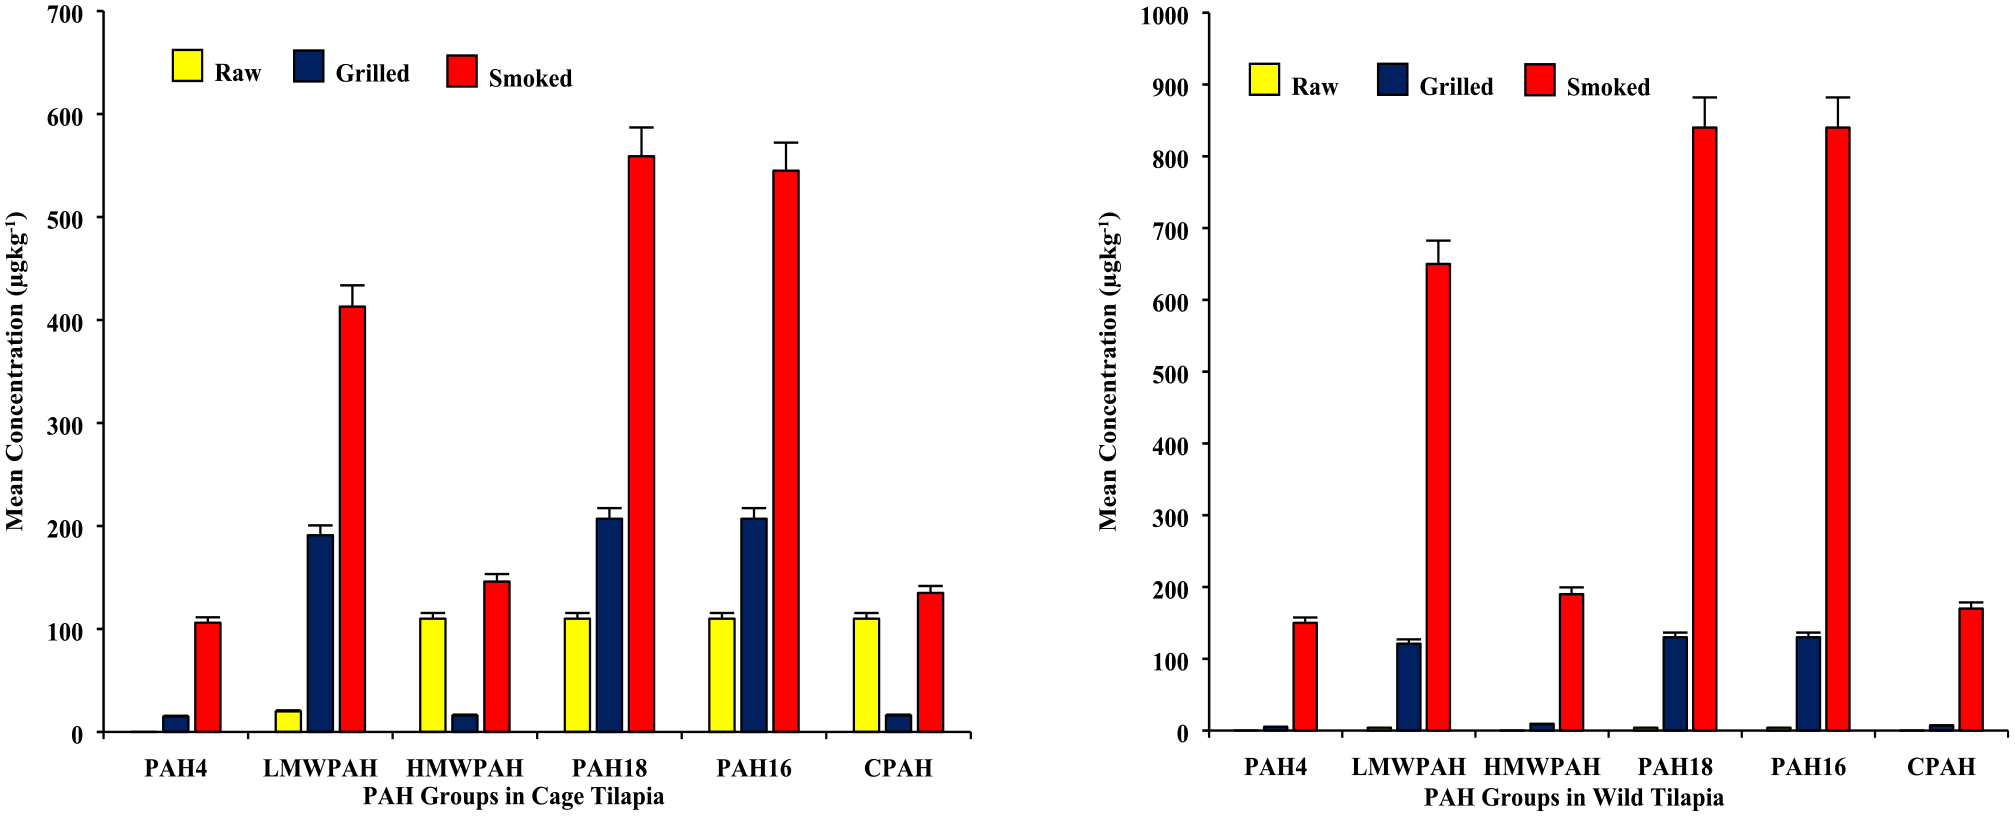
Mean levels of PAH groups in tilapia samples [Lefthand graph: results for samples from cage environment; and Righthand graph: results for samples from wild environment].
After smoking the tilapia, 16 and 14 PAH congeners were detected in wild and cage samples, respectively (Figure 3). This shows an increase in the numbers of PAH congeners after cooking raw samples: from 1 PAH to 16 PAH, and 4 PAH to 14 PAH, in wild and cage tilapia samples, respectively (see Table 3). Smoking introduced 15 PAH congeners (excluding DBA and BP) at levels within 3.1 to 65 µg/kg in wild samples, and likewise 10 PAH congeners within 1.9 to 35 µg/kg (excluding NAP, AcP, DBA and BP) in the cage samples after cooking. The PAH congeners which significantly increased their levels after smoking included Ant, Pyr and Pyl for cage samples, and Ant and Pyr for wild samples (Table 3). The significant effect of smoking on the 3 PAH congeners (Ant, Pyr and Pyl) in cage samples could be due to the suspected high-fat content of tilapia samples 83 since PAH is suspected to increase during smoking and such increase is considered a positive correlation function of the available fat/lipid content of the fish87,88 and also combustion smoke from the firewood containing lignin. 34 However, smoking significantly decreased Ind levels in the cage tilapia by about 98.7% (md: 98.7 µg/kg, p < .05), unlike the increase in wild smoked samples. Nevertheless, the final Ind level in the smoked fish from both cage and wild was similar and not significantly different (md: 0.000 µg/kg, p > .05).
Smoking significantly increased the levels of B[a]P and B[a]A (P < .05, Table 3), 2 of the most carcinogenic PAHs. 89 Although B[a]P was (undetected) below detection levels in chargrilled samples (in Table 3), its level in smoked samples was above the MPL of 2 µg/kg (Table 2).47,90 In contrast, Nnaji and Ekwe 91 from Nigeria reported B[a]P and B[a]A but in comparatively lower levels in addition to the detection of DBA and BP in a similar study (using O. niloticus) after smoking. Thus, culinary smoking may serve as a source of carcinogenic PAHs but more likely to contribute lower levels depending on other factors. For instance, CPAH levels in our smoked samples, are lower compared to a similar study in Nigerian. 61 The difference in the levels of the carcinogenic PAH congeners and CPAH between ours and the Nigerian studies may be partly due to the variance in smoking methods (drum type kiln vs chorkor kiln), firewood types, and the cooking time durations (6 vs 4 hours). 92 For PAH4, our results from smoked tilapia samples showed higher levels than reported in a similar study in Ghana (7 µg/kg). 32
The order of PAH groups for smoked tilapia was almost similar for both cage and wild samples, but the levels were comparatively higher for wild than cage (see Figure 4 and Table 3). For wild smoked samples, PAH group levels were PAH18 = PAH16 > LMWPAH >HMWPAH >CPAH >PAH4. For cage counterparts, the order was PAH18 > PAH16 > LMWPAH >HMWPAH >CPAH >PAH4. It is not clear what could be accounting for the higher levels of PAH groups in the wild than in cage samples, besides that was not anticipated. The observation could be linked to increased fat pyrolysis from smoking 93 leading to high PAH levels 60 given that caged fish could have more fat tissues than wild counterparts. 83 Also, a tar layer from fat smoke could formed on the cooked fished to about 3% of its weight and further contribute about 20 to 40 times more PAHs. 78
Generally, smoked samples showed higher PAH levels than chargrilled counterparts. For this study, the cooking temperature and intensity of the heat source (120°C vs 180°C), and cooking times (30 minutes vs 4 hours) for chargrilling versus smoking, respectively could contribute to differences in the levels of fumes produced under the two cooking approaches. Hence the more significant influence of smoking on PAH levels could be due to the higher temperature and/or heat intensity, which could have caused more pyrolysis of fats. 93 In addition, the incomplete combustion of fuelwood associated with the smoking and subsequent smoke deposits on the fish surface may have contributed more PAH congeners in the smoked fish samples. 94 Although PAH groups were detected in both chargrilled and smoked samples from the wild, and cage settings (Figure 4 and Table 3), smoked samples contained significantly higher levels of PAH groups in all cases, which was also observed in the case of total PAHs. Also, the mean levels of PAH4 detected in smoked samples were above the MPL of 12 µg/kg, unlike the levels in grilled samples which were far lower than the MPL of 30 µg/kg (Table 2).47,54
Due to the widespread and diffused nature of PAHs in ambient air,92,95,96 the exposure of our samples to air during packaging, and cooking may have contributed some minimal or almost non-negligible PAH to samples as well. Nevertheless, with smoking being one of the leading techniques of fish processing (cooking, treatment and preservation) in Ghana, like in other countries,47,54 the higher levels of PAH4 and B[a]P in smoked tilapia samples from our study failing the maximum permissible limit (MPL) are instructive. The findings indicate that smoking may be associated with high PAH levels and especially for PAH4 and B[a]P; this could pose harm or health risk to consumers and therefore requires human health risk assessments.
Human health risk assessment
The Excess Cancer Risk (ECR), a conservative estimate (based on TEF) for a lifetime consumption of raw, grilled, and smoked fish samples from the two environments (cage and wild) was determined at an exposure frequency of 365 days (for people who eat fish every day or 7 times a week) (see ECR in Table 3). The mean ECR ranged between 1.01 × 10⁻¹⁰ and 1.32 × 10⁻⁶. Already, the carcinogenic exposure index PAH4 (Table 3) showed that smoked fish samples far exceeded the maximum permissible limit (MPL, 12 µg/kg) for consumption by 8 and 12 times respectively for cage (106 ± 4 µg/kg) and wild (150 ± 4 µg/kg) sources. However, the grilled fish samples gave PAH4 levels (cage = 3 times of wild, 5 µg/kg) well below the MPL of 30 µg/kg for all sources. Thus, suggesting that smoking the fish could expose consumers to potentially high health risk levels than grilling, and that could even be higher in the wild than the cage fish samples.
The raw fish samples from the wild gave the lowest ECR level (1 × 10⁻¹⁰), quite significantly lower (p < .05) than raw cage samples (2.3 × 10⁻⁷) (Table 3). Like the pattern observed for the carcinogenic exposure index PAH4, smoking and grilling significantly increased the ECR of the wild catch fish samples after cooking the raw, and this was higher for smoking, likely due to similar reasons presented earlier. In the case of the cage tilapia samples, smoking and grilling significantly reduced the ECR instead, and a significant difference was recorded between the two cooking methods as well. Yet, all ECR levels were tolerable although smoking showed the highest and most significant mean ECR levels for cage (1.32 ×10⁻⁶) and wild (9.97 ×10⁻⁷) sources, respectively. Meanwhile, tolerable lifetime cancer risk is one in a million (ECR = 10−6) or less, while a lifetime cancer risk of one in ten thousand or greater (ECR ⩾ 10−4) is considered serious or unacceptable. 97 From our findings, the risk of developing cancers from consuming tilapia (raw, smoked, and grilled) from our study site, the Afram arm of the Volta Lake, is low and tolerable because the estimated ECR levels are far below the critical threshold (10−4). Thus, grilled and smoked wild and cage tilapia under the prevailing conditions in the study would pose low cancer risk to people who consume the tilapia based on this conservative cancer risk estimation approach. This could be a limitation in this study since other scientific and more sensitive approaches like Margin of Exposure (MOE) may give otherwise likely based on the PAH4 estimates. 60
Conclusion and Recommendations for Practice
The study established that raw cage and wild tilapia samples, respectively contained 4 PAH congeners (Ind > Ant > Pyl > Pyr) and 1 PAH congener (Pyr). Chargrilling introduced into wild tilapia 5 PAH congeners (Ant > FL > B[a]A > Pyl = Ind) and into cage tilapia 4 PAH congeners (Ant > Pyr > FL = B[a]A) after cooking. The culinary methods of grilling (chargrilling) and smoking could influence the levels of some PAH congeners. For instance, smoking increased the levels of 13 PAH congeners and decreased Ind in cage samples. Smoking and chargrilling increased the total PAHs in all samples; however, the effect of smoking was more significant than chargrilling. The B[a]P and PAH4 detected in smoked samples were respectively far above the maximum permissible limits (MPL) of 2 µg/kg and 12 µg/kg and therefore contributed to significant levels of carcinogenic PAHs (CPAH, 135-170 µg/kg). Nevertheless, using the conservative ECR estimates for all samples – raw, smoked, grilled, cage and wild, show tolerable values, which are far below the recommended threshold (10−4), implying that consuming smoked or grilled tilapia from the sampled sources (cage and wild catch) could be safe. It is recommended that further in-depth studies be considered to include analysing fish samples from the river tributaries, other freshwater bodies, increasing sample sizes, incorporating seasonal variations (dry and wet weather seasons), and adopting other sensitive cancer risk modelling approaches like Margin of Exposure (MOE).
Supplemental Material
sj-docx-1-ehi-10.1177_11786302231213546 – Supplemental material for Effect of Smoking and Grilling on Polycyclic Aromatic Hydrocarbons in Ghanaian Tilapia
Supplemental material, sj-docx-1-ehi-10.1177_11786302231213546 for Effect of Smoking and Grilling on Polycyclic Aromatic Hydrocarbons in Ghanaian Tilapia by Bismark Dwumfour-Asare, Emmanuel Dartey, Nomolox Solomon Kofi Adherr, Kofi Sarpong and Emmanuel Agyapong Asare in Environmental Health Insights
Footnotes
Acknowledgements
The authors acknowledge the sincere cooperation of all participants and experts especially the fisherfolk, fish processors (women who grilled and smoked the fishes), and laboratory staff of Ghana Standard Authority for making the studies successful.
Funding:
The author(s) received no financial support for the research, authorship, and/or publication of this article.
Declaration of conflicting interests:
The author(s) declared no potential conflicts of interest with respect to the research, authorship, and/or publication of this article.
Data Availability Statement
All relevant data underlying our study are shared as results and included in the paper. Also, any other reasonable request for additional data if available could be shared.
Supplemental Material
Supplemental material for this article is available online.
References
Supplementary Material
Please find the following supplemental material available below.
For Open Access articles published under a Creative Commons License, all supplemental material carries the same license as the article it is associated with.
For non-Open Access articles published, all supplemental material carries a non-exclusive license, and permission requests for re-use of supplemental material or any part of supplemental material shall be sent directly to the copyright owner as specified in the copyright notice associated with the article.