
Abstract
Introduction:
Household air pollution (HAP) from solid fuel combustion is a major global public health issue with a particularly high burden in sub-Saharan Africa. In Somalia, the extent and predictors of household smoke exposure risk (SER) remain underexplored due to data scarcity and analytical limitations. This study applies machine learning (ML) models to identify and predict SER in Somali households using the first Somalia Demographic and Health Survey (SDHS) and interpretable artificial intelligence (AI) techniques.
Methods:
A nationally representative sample of 15 838 households from the 2020 SDHS was analyzed using multivariate logistic regression. The SER was defined based on the cooking fuel type and location. Six supervised ML models (Logistic Regression, K-Nearest Neighbors, Decision Tree, Support Vector Machine, Random Forest, Gradient Boosting) were trained using an 80/20 train-test split. The performance was evaluated using accuracy, precision, recall, F1-score, and AUROC. Feature importance was assessed using Gini, permutation, and SHAP (SHapley Additive explanation) values.
Results:
The prevalence of household smoking exposure was 70.0%. Place of residence, region, and wealth were the dominant predictors. Gradient Boosting outperformed other models (AUC = 81% [95% CI: 79.11%-82.17%], F1 = 81%), followed by Random Forest. SHAP analysis confirmed that geographic and socioeconomic factors were the most impactful features. Notably, higher exposure was paradoxically associated with urban residence and higher wealth, diverging from the traditional patterns observed in similar settings.
Conclusion:
This is the first national study to apply machine learning to predict SER in Somalia, revealing urban and wealth-linked vulnerabilities that challenge conventional assumptions about poverty. These findings highlight the need for targeted clean cooking interventions in urban and peri-urban communities, alongside data innovations for real-time monitoring. ML-informed risk stratification may support more effective and equitable health policies in fragile states.
Introduction
Household air pollution (HAP) from the domestic combustion of solid fuels is a critical global public health challenge, responsible for an estimated 3.8 million premature deaths annually. 1 The health burden is immense, contributing significantly to non-communicable diseases such as stroke, heart disease, chronic obstructive pulmonary disease (COPD), and lung cancer, as well as acute respiratory infections like pneumonia. 2 The toxic constituents of kitchen smoke, including particulate matter, carbon monoxide, and various volatile hydrocarbons, are directly linked to a range of respiratory symptoms and chronic illnesses.2,3 Beyond serving as an environmental exposure, household air pollution represents a major pathway through which indoor environmental conditions shape population health, particularly among women and children who spend longer periods in cooking environments. 1
The burden of HAP is disproportionately borne by low- and middle-income countries, particularly in sub-Saharan Africa, where there is a heavy reliance on solid biomass fuels for cooking. 4 Studies across the region have consistently linked HAP to adverse health outcomes, including increased under-five mortality, adverse pregnancy outcomes, and a significant share of the overall disease burden.5 -7 In East Africa, HAP remains a primary driver of mortality and disability, underscoring the urgent need for effective interventions and targeted public health strategies.7,8 To better quantify and analyze this multifaceted risk, recent research has utilized Demographic and Health Survey (DHS) data to develop a composite indicator known as Household Smoke Exposure Risk (SER). This metric integrates information on both the type of cooking fuel used (smoke-producing vs non-smoke-producing) and the primary cooking location (indoor vs outdoor) to create a more nuanced risk profile. 9 This approach has been successfully applied to analyze risk factors in countries like Tanzania and Bangladesh, revealing the profound impact of cooking practices on health outcomes such as adverse birth events and respiratory infections.9,10 A recent regional analysis from Nigeria further highlights the utility of the SER metric in understanding regional disparities and identifying vulnerable populations. 11
Although descriptive and regression-based analyses of SER have proven valuable, recent advancements in computational methods offer a powerful new frontier for risk prediction. Machine learning (ML) algorithms, such as the random forest model, have demonstrated significant promise in predicting complex health behaviors and outcomes from large datasets.12,13 These approaches excel in identifying nonlinear relationships and complex interactions between various determinants, offering predictive power beyond that of traditional statistical models. The application of ML to public health is growing, with recent studies successfully using these techniques to predict behaviors like tobacco use among pregnant women in sub-Saharan Africa, thereby identifying key determinants for targeted interventions. 14 The application of machine learning (ML) in public health is expanding rapidly, with recent studies demonstrating its ability to predict health-related behaviors and identify key determinants that can inform targeted interventions. 14 This growth is also reflected across multiple healthcare domains, where ML-based predictive modeling and evidence synthesis are increasingly used to support risk stratification, early detection, and outcome forecasting in diverse settings.15 -17 In addition, ML has shown strong potential in clinical decision support by improving pattern recognition and risk assessment to guide timely and personalized decision-making.18,19
Despite this progress, there remains a critical research and policy gap in Somalia. As a nation recovering from decades of conflict and instability, Somalia faces unique and severe public health challenges and has historically lacked comprehensive, population-level evidence to support evidence-based policymaking. The first Somalia Health and Demographic Survey (SHDS/SDHS) provide an unprecedented opportunity to examine key health and environmental determinants at the national level. In a recent study, we reported that 60.34% of Somali households experience high household smoke exposure risk and 36.32% experience medium risk, underscoring a substantial and widespread burden. 20 However, this prior work relied on conventional analytical approaches and did not apply advanced computational or predictive modeling techniques. Accordingly, the present study addresses this gap by being the first to employ machine learning methods to predict household smoke exposure risk using data from the 2020 SHDS/SDHS. The specific objectives are: (1) to determine the prevalence and key sociodemographic determinants of household smoke exposure risk in Somalia; (2) to develop and evaluate the performance of machine learning models for predicting household SER; and (3) to identify the most influential predictors of high smoke exposure risk to inform targeted public health interventions and policy in Somalia.
Methods
Study Design and Data Source
This study employed a population-based cross-sectional design to analyze the determinants of household smoking exposure. The primary data source was the 2020 Somalia Health and Demographic Survey (SDHS), a nationally representative survey conducted by the Somalia National Bureau of Statistics in collaboration with international partners. The SDHS provides strong and comprehensive data on a wide range of demographic, socioeconomic, and health indicators, making it a suitable dataset for this study.
Sampling Method and Sample Size Justification
The SDHS used a stratified, 2-stage cluster sampling methodology to ensure a representative sample of the Somali population. In the first stage, enumeration areas (EAs) were selected with a probability proportional to their size. In the second stage, a fixed number of households were systematically selected from each chosen EAs. This robust sampling strategy minimized selection bias and enhanced the generalizability of the findings. For this study, a final weighted sample of 15 838 households was included in the analysis. This large sample size, derived from a rigorous national survey, provided sufficient statistical power for developing and validating complex machine learning models, ensuring the reliability of the study’s conclusions.
Study Variables
The primary outcome variable for this study was the Household Smoke Exposure Risk (SER). This was constructed as a binary variable, where households were classified as “Exposed” (coded as 1) if their primary cooking methods involved solid fuels in enclosed or semi-enclosed spaces, and “Not Exposed” (coded as 0) otherwise. In this study, SER was treated as a proxy indicator of household air pollution exposure, enabling stratification of households likely to experience environmentally driven adverse health outcomes associated with chronic smoke exposure. Based on a review of the existing literature on the determinants of household air pollution and data availability in the SDHS, the following predictor variables were selected: Geographic Factors: Place of Residence (categorized as urban, rural, or nomadic), and Administrative Region. Socioeconomic Factors: Wealth Quintile (poor, middle, rich) and Media Exposure (yes/no). Household Head Characteristics: School Attendance of the Household Head (yes/no), Sex of the Household Head, and Age of the Household Head. Household Demographics: Household Size.
Data Pre-processing
The dataset was prepared for machine learning implementation using Python (version 3.13.5). The pre-processing pipeline included data cleaning to rectify any inconsistencies, handling missing values through mode imputation for categorical variables, and the final formatting of variables to ensure model compatibility. A final sample of 15 838 household data points was retained for analysis.
Feature Selection
A comprehensive multi-stage feature selection process was conducted to identify the most relevant predictors of household smoke exposure risk (SER). The process began with exploratory data analysis (EDA), in which descriptive statistics and visualizations were used to gain insights into the distribution of variables and their initial associations with the outcome. For a more formal assessment, a bivariate analysis using survey-adjusted chi-square tests was performed to evaluate the statistical significance of the association between each predictor and the household SER. To further refine the feature set and ensure the robustness of the final models, correlations between categorical predictors were assessed using Cramer’s V statistic. This step was crucial for minimizing multicollinearity by identifying and managing highly redundant variables in the dataset. This combination of statistical prescreening, correlation analysis, and literature-informed review yielded a comprehensive and relevant set of predictors for the model development phase.
Feature of Importance
To understand the contribution of each predictor to the model’s decisions, feature importance was systematically evaluated after model training. For tree-based models (Decision Tree, Random Forest, Gradient Boosting), Gini importance was used. For Logistic Regression, the absolute values of the coefficients were assessed. For K-Nearest Neighbors and SVM, permutation importance was calculated. Furthermore, for the best-performing model, a more advanced explainable AI (XAI) technique, SHapley Additive exPlanations (SHAP), was employed to provide granular insights into both global and local feature contributions, enhancing the interpretability of the model predictions.
Model Development
Six supervised machine learning algorithms were developed to predict the household SER, representing a range of complexities and methodologies. Logistic Regression (LR) served as a linear baseline model, offering straightforward statistical foundations. K-Nearest Neighbors (KNN) was employed as a non-parametric, instance-based algorithm. Decision Tree (DT) provided a simple, non-linear tree-based model. The Support Vector Machine (SVM) aimed to identify an optimal separating hyperplane between classes. Random Forest (RF) is an ensemble method based on multiple decision trees. Gradient Boosting, a powerful ensemble technique that builds models sequentially to correct prior errors.
Model Training and Evaluation
The dataset was randomly partitioned into a training subset comprising 80% of the observations and a strict hold-out testing subset containing the remaining 20% to generate the performance metrics. All models were fitted exclusively on the training data, and their hyperparameters were tuned via k-fold cross-validation to curb overfitting and enhance generalizability. The performance was subsequently assessed on the unseen test set using a comprehensive suite of classification metrics, namely accuracy, precision, recall, F1-score, confusion matrix, and area under the receiver-operating characteristic curve (AUROC). To ensure the statistical reliability of the model performance, 95% Confidence Intervals (CIs) were calculated for the AUROC values. Accuracy provides an overall measure of correct predictions, whereas precision and recall quantify the positive predictive values and sensitivity, respectively. The F1-score, as the harmonic mean of precision and recall, gauges the balance between these two dimensions. The confusion matrix offered a granular comparison of true versus false classifications for both exposed and unexposed households, and the AUROC summarized each model’s capacity to discriminate between the 2 classes across all probability thresholds.
Model Selection
The selection of the optimal predictive model was based on a rigorous and holistic comparison of the evaluation metrics generated from an unseen test set. The primary quantitative criteria for model selection were the Area Under the Receiver Operating Characteristic curve (AUROC) and the F1-Score. The AUROC was chosen as a key indicator of the model’s overall ability to discriminate between “Exposed” and “Not Exposed” households, independent of a specific classification threshold. The F1-Score, which represents the harmonic mean of precision and recall, was prioritized to ensure that the selected model demonstrated a robust balance in correctly identifying positive cases (recall) while minimizing false alarms (precision). This balanced approach is particularly critical in the public health context, where both identifying at-risk households and efficiently allocating resources are important. In addition to quantitative performance, qualitative aspects, such as model interpretability and computational efficiency, were considered secondary criteria. The algorithm that demonstrated the most superior and well-rounded performance across these combined criteria was selected for in-depth features, importance analysis and final interpretation.
Statistical Analysis
All conventional statistical analyses were performed using STATA version 17. Descriptive statistics, including weighted frequencies and percentages, were generated to summarize household sociodemographic characteristics and the prevalence of smoke exposure. To account for the complex sampling design of the SDHS (stratification, clustering, and weighting). For inferential analysis, survey-adjusted chi-square tests were employed to assess the bivariate associations between each predictor variable and the binary outcome of the risk of smoke exposure. A P-value of <.05 was considered indicative of a statistically significant association. This initial statistical analysis provided a foundational understanding of the data and informed the preliminary feature selection for machine learning models.
Results
Prevalence and Household Characteristics
The overall weighted prevalence of household smoke exposure was 70.0% (Figure 1). This study included a weighted sample of 15 838 households from the 2020 Somalia Health and Demographic Survey (SDHS), the characteristics of which are presented in Table 1. Regarding household characteristics, most households resided in urban (59.8%), rural (27.5%), and nomadic (12.7%) settings. A significant proportion of households were classified in the poor wealth quintile (43.5%), with 36.5% being rich and 20.1% being middle-class. Most households were male headed (67.9%). Most household heads (58.8%) had never attended school. More than two-thirds of the households (67.5%) reported no media exposure. In terms of household size, 70.6% of households had more than 4 members. The age of the household head was distributed across various groups, with the largest proportion being 30 to 40 years old (35.0%). The sample was distributed across all 16 regions of Somalia, with Banadir having the largest proportion of households (24.7%).

Weighted SER distribution among households in Somalia.
Sociodemographic Characteristics and Smoke Exposure Risk Among Households in Somalia.

Statistical significance was set at P < .05.
P < .001.
Determinants of Smoke Exposure Risk
Bivariate analyses using survey-adjusted chi-square tests identified several significant determinants of household smoke exposure risk (Table 1). Place of residence and wealth quintile were the most significant predictors (P < .0001). Urban households had the highest exposure rate (79.1%), whereas nomadic households had the lowest (23.9%). Smoke exposure risk demonstrated a clear positive gradient with wealth, increasing from 55.6% in poor households to 82.9% in rich ones. Additionally, the household head’s school attendance, media exposure, household size, and region were all significantly associated with higher smoke exposure (P < .0001). For instance, exposure was significantly higher in households where the head had attended school (74.5%) than in those without formal education (66.9%). In contrast, the sex and age of the household head were not significantly associated with the risk of smoke exposure.
Predictive Performance of Machine Learning Models
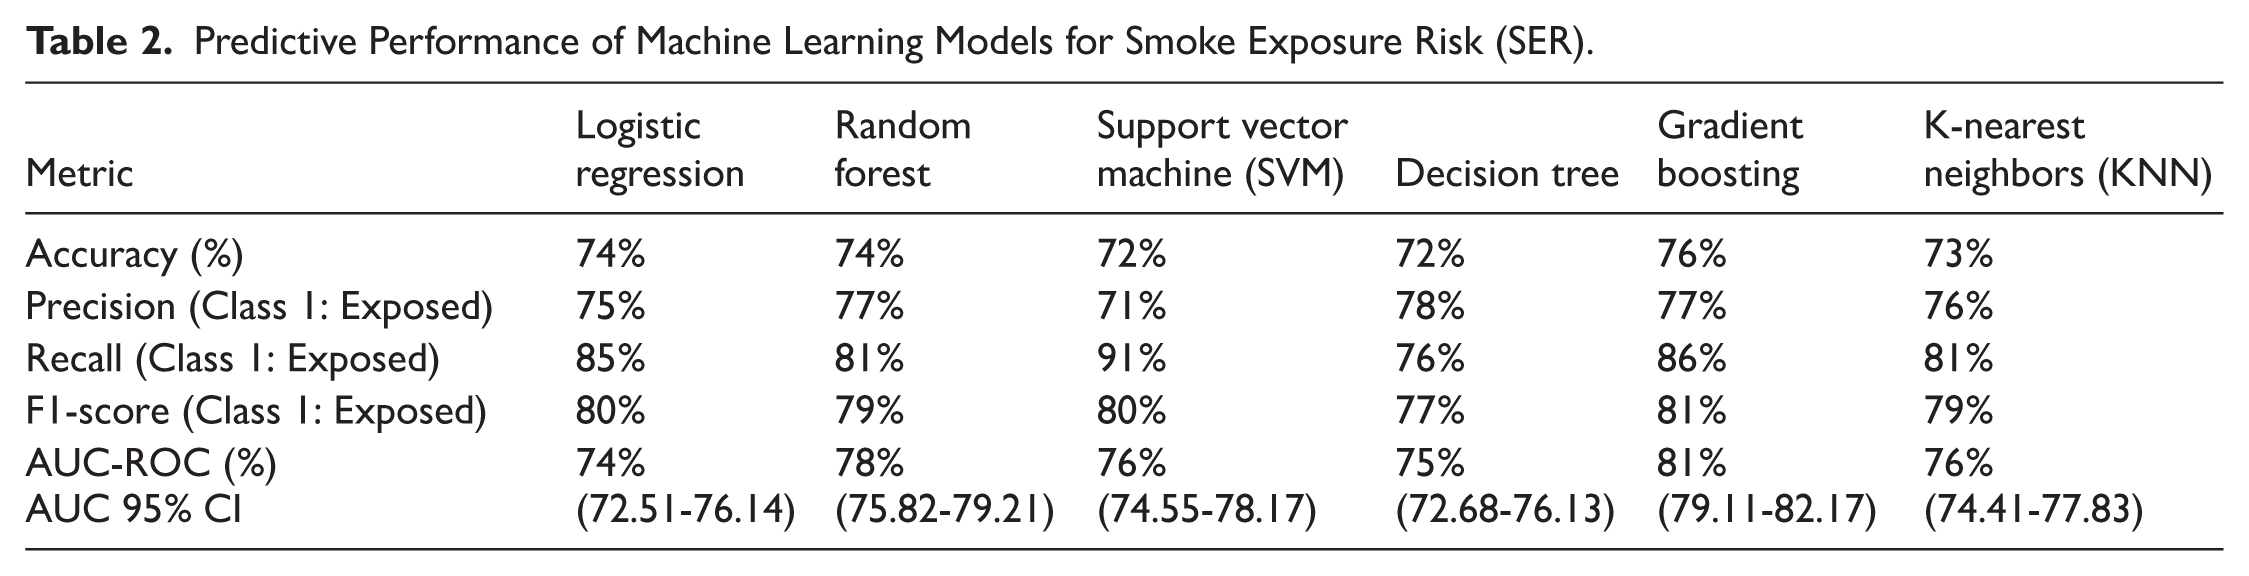
Six machine learning models were trained and evaluated to predict the risk of household smoke exposure. The comparative performance across the 5 key metrics is presented in Table 2 and Figure 2. Gradient Boosting emerged as the top-performing model, achieving the highest accuracy (76%) and Area Under the ROC Curve (AUC) of 81% (95% CI: 79.11%-82.17%). It also demonstrated a robust F1-Score (81%), indicating a strong and well-balanced ability to correctly classify households. The other ensemble model, Random Forest, also showed strong predictive capability, with an accuracy of 74% and an AUC of 78% (95% CI: 75.82%-79.21%). Notably, the Support Vector Machine (SVM) model achieved the highest recall (91%), suggesting that it was the most effective at identifying all “Exposed” households. However, this superior sensitivity came at the cost of the lowest precision (71%), indicating a higher rate of false-positive results. The Decision Tree and K-Nearest Neighbors (KNN) models yielded moderate performance, whereas Logistic Regression showed the most limited discriminatory ability, as reflected in their respective AUC scores (Figure 2).
Predictive Performance of Machine Learning Models for Smoke Exposure Risk (SER).
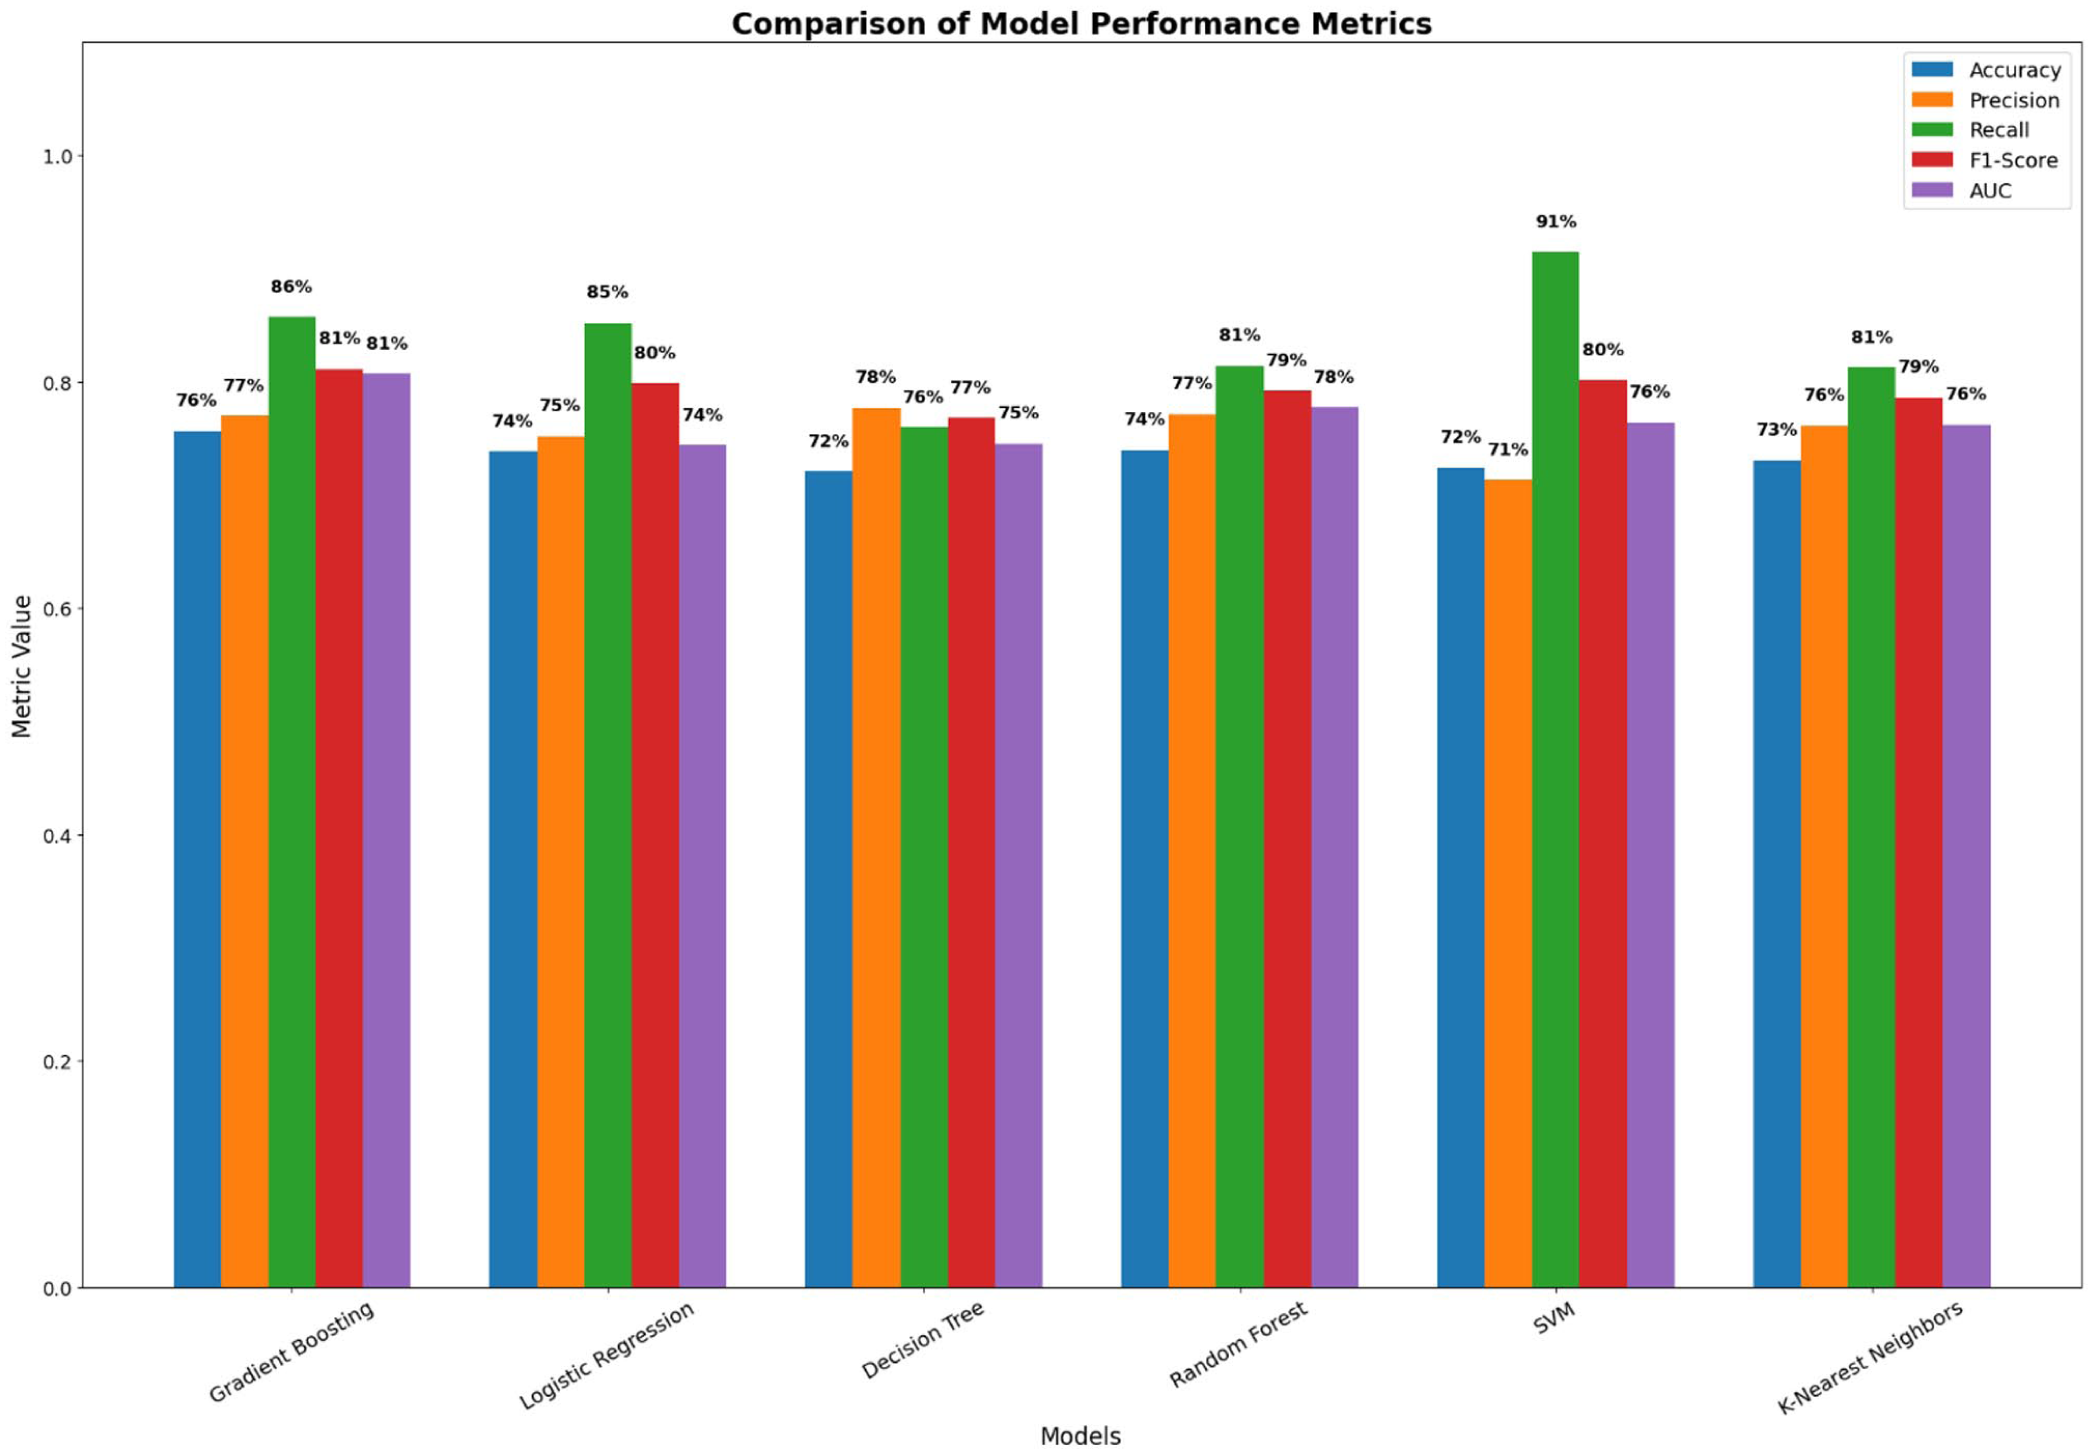
Comparison of model performance metrics.
Confusion Matrix
The confusion matrices in provide a detailed breakdown of the classification performance for each of the 6 models (Figure 3). The Gradient Boosting model demonstrates a strong balance, correctly identifying 1653 “Exposed” households (True Positives) while minimizing False Negatives (276). This indicates high sensitivity for the at-risk group. In contrast, the Support Vector Machine (SVM) model, while achieving the highest recall by correctly classifying 1764 “Exposed” households (the lowest False Negative count), also produced the highest number of False Positives (710), suggesting a tendency to misclassify “Not Exposed” households. Random Forest also showed strong efficacy with 1570 True Positives. The remaining models, including Logistic Regression, KNN, and Decision Tree, showed more moderate performance with higher rates of misclassification for 1 or both classes (Figure 3).

Confusion matrices for: (A) gradient boosting, (B) random forest, (C) logistic regression, (D) K-nearest neighbors, (E) decision tree, and (F) support vector machine.
AUROC Curve
The Receiver Operating Characteristic (ROC) curves presented in Figure 4 visually compare the ability of the 6 models to distinguish between “Exposed” and “Not exposed” households. The Area Under the Curve (AUC) serves as a key metric for this discriminatory power. The Gradient Boosting model is the clear top performer, with an AUC of 0.81 (95% CI: 0.79-0.82), indicating its superior capability to correctly classify households across all thresholds. Random Forest follows with a strong AUC of 0.78 (95% CI: 0.76-0.79), positioning it as the second-best model. The SVM and K-Nearest Neighbors (KNN) models showed comparable moderate performance AUC of 0.76 (95% CI: 0.74-0.78), while Decision Tree (0.74, 95% CI: 0.73-0.76) and Logistic Regression (0.74, 95% CI: 0.73-0.76) displayed the most limited discriminatory power in this context.
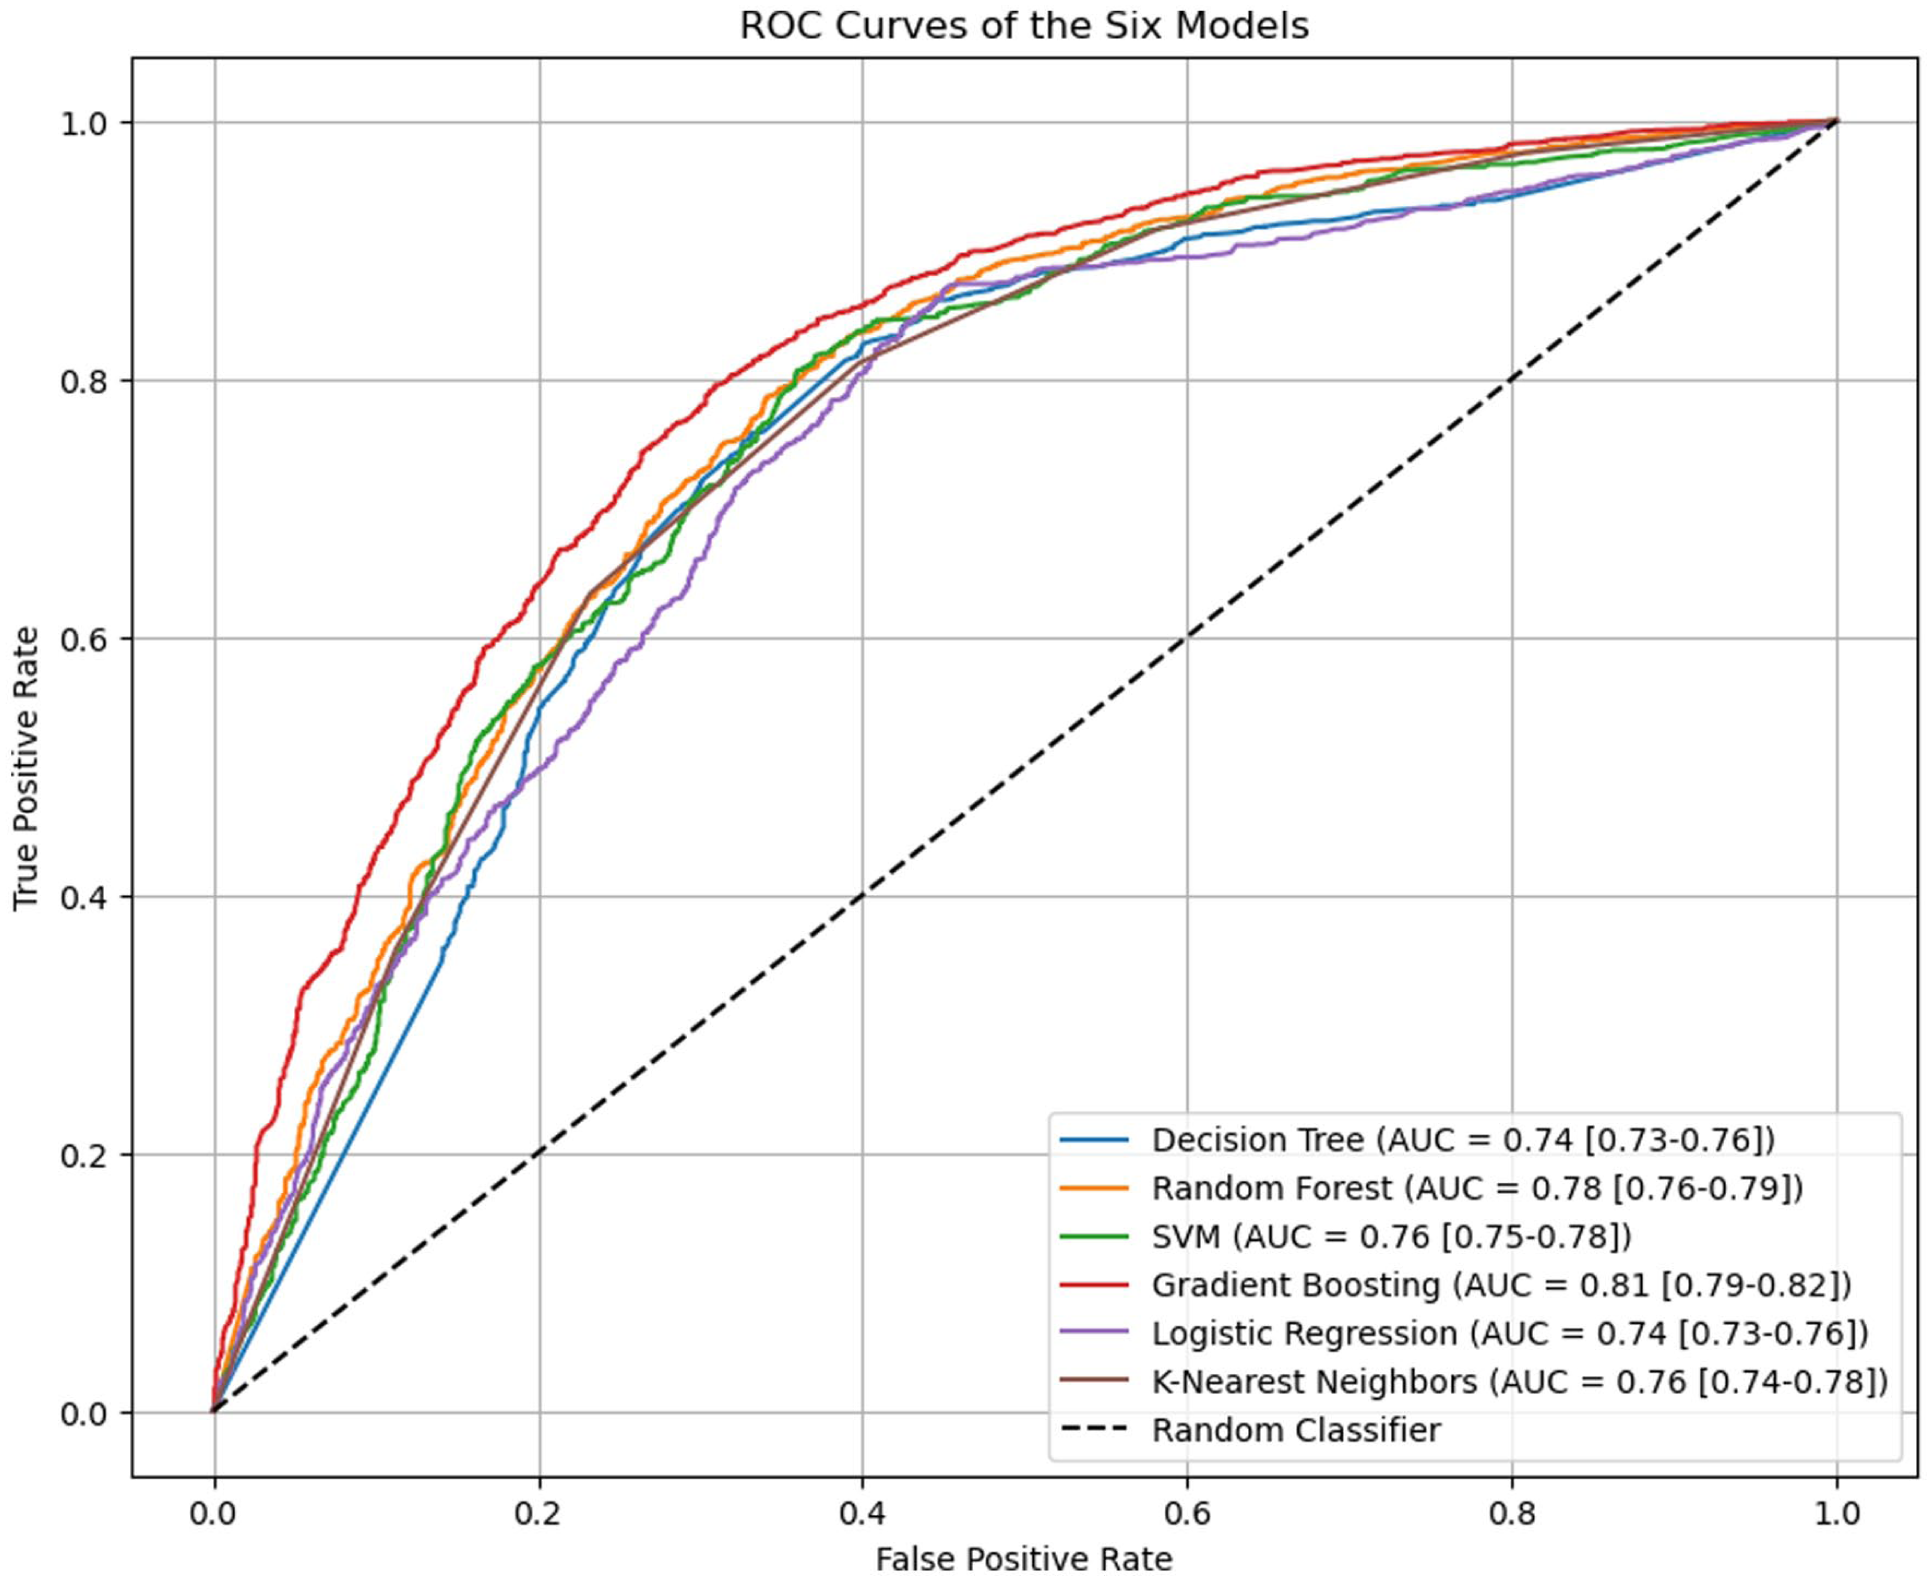
Receiver operating characteristic (ROC) curves of the 6 models.
Feature Importance Analysis
The relative importance and directional impact of various predictors on smoke exposure risk were evaluated using different techniques across the 6 models, with the results for the top features presented in Figure 5. Gini importance was used for tree-based models, absolute coefficients for Logistic Regression, and permutation importance for K-Nearest Neighbors (KNN) and SVM. The analysis revealed that geographic and location-based variables were the most influential. Residence emerged as the single most dominant feature in 5 of the 6 models, demonstrating exceptionally high importance scores in Gradient Boosting (Figure 5(A); Importance = 0.55) and Logistic Regression (Figure 5(C); Importance = 0.78). Region was also consistently identified as a primary determinant, ranking as the most important feature for the Random Forest model (Figure 5(B); Importance = 0.40) and the second most important for both the Gradient Boosting (Importance = 0.31) and Decision Tree (Figure 5(E); Importance = 0.22) models. Socioeconomic and demographic factors had a moderate to low influence. Wealth Quantile consistently ranked among the top predictors, particularly for Gradient Boosting (Importance = 0.08) and KNN (Figure 5(D); Importance = 0.04). Household characteristics such as Household Age, Household size, and Household Sex displayed varying levels of moderate influence depending on the model used. For instance, HH_Age was the third most important feature for Random Forest (Importance = 0.11), while HH_size was the third for Logistic Regression (Importance = 0.18). In contrast, Media Exposure and School attendance consistently demonstrated the lowest predictive power across all models, suggesting that they have a minimal direct impact on determining household smoke exposure risk in this analysis.

Top feature importances for predicting smoke exposure risk: (A) gradient boosting, (B) random forest, (C) logistic regression, (D) K-nearest neighbors, (E) decision tree, and (F) support vector machine.
Feature Importance Analysis Using SHAP
SHAP analysis was employed to reveal the relative importance and directional impact of various predictors on the model output. The analysis utilized 4 complementary visualizations: a SHAP Summary Plot, a SHAP Waterfall Plot, a SHAP Beeswarm Plot, and a Feature Importance ranking plot, to provide a comprehensive interpretation of the model’s predictions. The feature importance of the plot clearly identifies residence as the most influential predictor, with the highest mean absolute SHAP value. This is followed by Region and Wealth Quantile, which also demonstrate significant predictive power. Features such as HH_size, MediaExposure, and School_attendance showed a moderate influence, while HH_Age and HH_Sex had the least impact on the model’s predictions (Figure 6).

Gradient boosting model feature importance based on mean absolute SHAP values.
The SHAP Summary (Figure 7) and Beeswarm plots (Figure 8) illustrate the distribution and direction of these impacts. For Residence, higher feature values (shown as red dots in the beeswarm plot) consistently pushed the model output higher, as indicated by the cluster of points on the positive side of the SHAP value axis (Figure 8). Similarly, higher Wealth Quantile values were associated with positive SHAP values, increasing the likelihood of a positive prediction. Conversely, the plots reveal that higher Media Exposure and School attendance values are associated with negative SHAP values, suggesting that they decreasethe model’s output in this context.

SHAP summary plot.

SHAP beeswarm plot.
The SHAP Waterfall Plot provides a transparent view of how an individual prediction is formulated, starting from the base value (E[f(X)]) of 0.697 (Figure 9). For the specific instance shown, residence (+0.61), region (+0.56), and Wealth Quantile (+0.31) were the primary drivers pushing the prediction higher. In contrast, Media Exposure (−0.13) and School attendance (−0.06) exerted a negative influence. The cumulative effect of all features resulted in a final model output (f(x)) of 2.044 for this observation (Figure 9). Collectively, these visualizations confirm that geographic and socioeconomic factors, specifically Residence, Region, and Wealth Quantile, are the most critical determinants in the model’s predictions.

SHAP waterfall plot.
Discussion
The study revealed a striking 70% prevalence of household smoke exposure risk (SER) among Somali households and demonstrated that a gradient-boosting ensemble achieved the best discriminatory performance (AUC = 0.81; F1 = 0.81), driven chiefly by geographic features, particularly place of residence and region, while socioeconomic markers such as wealth quintile exerted a more modest yet consistent influence. In contextualizing these findings, it is noteworthy that Somalia remains 1 of the most heavily affected countries in East Africa, with 78% of households relying on solid cooking fuels in 2019, the highest proportion in the region. 21 Our estimate aligns with this data and with a recent Somaliland survey reporting an even higher reliance (97%) on biomass and charcoal. 22 Regionally, nearly four-fifths of sub-Saharan Africans still depend on polluting fuels as of 2021, underscoring the persistent magnitude of the exposure gap despite global decline. 23
Although the literature typically implicates rural poverty as the principal driver of household air pollution (HAP) exposure, 24 our models identified urban residence and higher relative wealth as the strongest positive predictors. This apparent paradox is plausibly explained by Somalia’s rapid, conflict-driven urbanization, which has concentrated internally displaced populations and low-income renters in dense peri-urban settlements, where charcoal is the de facto affordable cooking fuel and ventilation is poor.25,26 Similar urban slum vulnerabilities have been documented in Nigeria and Kenya, where solid fuel use persists despite ostensibly higher household assets.27,28 The modest protective influence of media exposure observed here resonates with Indian and Ethiopian studies showing that information access modestly accelerates the adoption of clean energy technologies but is rarely sufficient in the absence of subsidies and supply chain improvements.29,30
From a methodological perspective, the gradient-boosting model’s superiority mirrors broader evidence that ensemble learners outperform single classifiers in air-quality prediction tasks across diverse settings, 31 while our Support Vector Machine’s high recall but low precision reflects the classic sensitivity–specificity trade-off encountered in ML-based exposure screening. 32 Importantly, SHAP decomposition reaffirmed that residence and region wielded supra-additive contributions to SER, corroborating a recent interpretable-ML synthesis that flagged spatial determinants as dominant in both high- and low-income environments. 33 The positive wealth gradient we observed contrasts with multi-country DHS analyses, where lower quintiles typically exhibit higher solid-fuel dependence, 24 suggesting that Somalia’s wealth index, heavily weighted toward livestock and remittance-linked durable goods–may not accurately proxy liquidity for clean-energy purchases. Our findings therefore extend the environmental-justice discourse: contrary to global patterns where poverty predicts pollution exposure, Somali urban households with nominally higher wealth may paradoxically face the greatest smoke burden, a phenomenon echoed in recent machine learning work linking complex poverty metrics, urban siting, and ambient emissions in other fragile settings. 34 Importantly, these results provide direct environmental health insight because SER captures household-level exposure conditions that are strongly associated with environmentally mediated health burdens, including acute respiratory infections, chronic respiratory disease, cardiovascular outcomes, and premature mortality.23,35 In this context, our predictive models help identify where exposure reduction strategies can deliver the greatest health gains, supporting practical translation from environmental exposure mapping to human health protection and prevention-oriented policy.
Internal validity was supported by the large nationally representative sample (n = 15 838), use of a strict 80/20 hold-out test set with cross-validated tuning, and consistent identification of key predictors (residence and region) across multiple models and SHAP explanations, reducing the likelihood that the findings reflect model-specific artifacts. However, SER remains a proxy exposure indicator derived from cooking fuel type and location rather than direct PM25 measurements or clinical outcomes; therefore, some exposure misclassification is possible. External validity is strengthened by the SDHS sampling design, supporting national generalizability; nonetheless, the partial under-representation of nomadic households due to missing covariates may limit the applicability to fully pastoralist communities.
Notwithstanding these insights, several limitations must be considered. First, the cross-sectional SDHS cannot infer causality, and the SER outcome relies on proxy definitions of cooking practice rather than direct PM2.5 measurement, raising potential misclassification; ventilation characteristics, fuel stacking, and seasonality were unmeasured. Second, nomadic households (12.7% of the sample) may have been under-represented in model training because of missing covariate data, limiting generalizability to fully pastoral communities. Third, we confined modeling to 6 conventional algorithms: deep neural architectures and geospatial covariates (eg, satellite aerosol optical depth or land-use regression layers) were not incorporated, potentially capping the predictive ceiling. 36 Fourth, although survey weights were applied in descriptive statistics, they were not integrated into ML loss functions; future work should test survey-weighted learners to better respect complex sampling designs. Finally, all covariates were self-reported or census-derived, and residual confounding by unobservable socioeconomic or behavioral factors (eg, cooking duration, child presence, or ambient dust storms) cannot be excluded.
Considering these constraints, 3 actionable recommendations were identified. First, Somalia’s clean cooking policies should focus on densely populated urban areas, particularly those accommodating internally displaced persons, by expanding subsidized liquefied petroleum gas (LPG) or ethanol programs and utilizing humanitarian channels that have previously distributed efficient stoves on a small scale.25,27 Second, future population surveys should incorporate low-cost sensor modules or hybrid questionnaire–sensor approaches to directly measure particulate concentrations and ventilation metrics, thereby enabling the validation of proxy-based machine learning risk scores. 37 Third, the predictive workflow should be developed into a dynamic geospatial early warning system that integrates DHS microdata, routine media-penetration indicators, and remotely sensed environmental layers using interpretable ensemble methods to guide micro-targeted interventions and monitor progress toward Sustainable Development Goals. Collectively, these measures could expedite equitable access to clean household energy in Somalia and provide a transferable model for other fragile, low-resource contexts facing the persistent challenge of household air pollution.
Conclusion
Household smoke exposure risk remains highly prevalent in Somalia, indicating widespread vulnerability to harmful household air pollution. By applying supervised machine learning models alongside explainable AI methods, this study demonstrated that smoke exposure risk can be predicted with good discriminatory performance, with Gradient Boosting providing the strongest overall balance across evaluation metrics. Geographic context, particularly residence and region, emerged as the most influential drivers of exposure risk, whereas socioeconomic factors such as household wealth also contributed meaningfully. The unexpected clustering of higher exposure risk among urban and relatively wealthier households highlights the need to reconsider conventional assumptions and prioritize clean cooking strategies in dense urban and peri-urban settings, including communities affected by displacement and those living in informal housing. Overall, interpretable ML-based risk stratification offers a practical and scalable approach for identifying high-risk households and supporting targeted, prevention-oriented environmental health policies in fragile and data-constrained settings.
Footnotes
Ethical Considerations
This study used secondary data from the 2020 Somali Demographic and Health Survey (SDHS), conducted in accordance with established ethical guidelines. The research complied with ethical principles by obtaining the necessary approvals from the Somalia National Health Research Ethics Committee and the ICF Institutional Review Board.
Consent to Participate
Informed consent was secured from all participants prior to data collection, ensuring that their rights and confidentiality were upheld throughout the research process.
Author Contributions
MMA Conceptualized this idea. The study design was developed collaboratively by ASA, MMA, MAO and YSAH. Material preparation and data collection were performed by YSAH and MMA. MAO analyzed and interpreted the data. The initial draft was composed by ASA, MMA and YSAH. All authors contributed to the writing, reviewing, and editing of the subsequent versions of the manuscript.
Funding
The authors received no financial support for the research, authorship, and/or publication of this article.
Declaration of Conflicting Interests
The authors declared no potential conflicts of interest with respect to the research, authorship, and/or publication of this article.