
Abstract
Hakaluki Haor, the largest freshwater wetland in Bangladesh, plays a crucial ecological and socio-economic role by supporting inland capture fisheries and sustaining local livelihoods; however, its morphology and hydrological dynamics have undergone significant transformations over recent decades. This study integrated remote sensing and geographic information systems techniques with time-series statistical analyses to quantify water area changes from 1990 to 2020 and examine their implications for fish production and community livelihoods. Landsat imagery and the Modified Normalized Difference Water Index were applied to assess waterbody dynamics, while Mann–Kendall trend tests, Sen’s slope estimator, Pettitt’s change-point detection, and Spearman correlation were used to quantify long-term trends and structural shifts. Results revealed significant water area changes in Hakaluki Haor between 1990 and 2020, mainly due to erratic rainfall and discharge from transboundary rivers. Fish catch showed a statistically significant decreasing trend (Sen’s slope = −83.68 MT/year, p < .001), while water area exhibited a significant increasing trend (Sen’s slope = 19.55 ha/year, p = .001). Fish catch and abundance in the haor were influenced by a combination of climatic factors and anthropogenic pressure, with a notable decline between 1990 and 2015 associated with erratic rainfall, temperature fluctuation, beel siltation, and excessive use of destructive fishing gears. Change-point analysis indicated significant breaks in the fish production around 2004 to 2005 and near 2015, coinciding with extreme rainfall events (z-score = 1.25 in 2015), which adversely affected fisher livelihoods, reducing fishing participation, prompting occupational diversification, seasonal migration, and gradual socio-economic transitions. Post-2015, fish catch improved following government-led re-excavation of beels and canals, undertaken in collaboration with non-governmental organizations. Sustainable management of haor wetlands requires restoring hydrological connectivity, mitigating destructive fishing, and strengthening climate-resilient fisheries governance.
Introduction
Wetlands are among the most productive ecosystems worldwide, serving as critical hotspots of aquatic biodiversity (Intergovernmental Panel on Climate Change [IPCC], 2000; Sun et al., 2017). They are a unique ecosystem and have played a significant role in the world’s economic, industrial, ecological, social, and cultural benefits (S. N. Islam, 2010). The wetland ecosystems provide livelihood support to many local communities through fishing, agriculture, seasonal livestock grazing, wood collection, irrigation, navigation, communication, and eco-tourism (I. Ahmed et al., 2008; Newaz & Rahman, 2019; Rana et al., 2009). Wetlands serve as foodstuff making, water refinement and management, groundwater replenishment, flood mitigation, carbon storage, mediating of climate, nutrient cycling, pest management, and biodiversity conservation (Knight et al., 2017; Talukdar & Pal, 2020). Bangladesh’s total wetlands are estimated to be 70,000 to 80,000 km2, which constitute nearly 50% of the total land area (I. Ahmed et al., 2008; S. N. Islam, 2010; Bhattacharjee et al., 2021). Fluvial wetlands such as haors, 1 baors, 2 beels, 3 and jheels 4 are commonly identified as freshwater wetlands (M. N. Islam et al., 2018), which exist naturally in Bangladesh (Mia et al., 2017). Among them, haor has the richest biodiversity of flora and fauna, physically appears bowl or saucer-shaped, and contributes around 9% of total inland capture fisheries production in Bangladesh (Alam et al., 2025a; DoF, 2021; Haroon & Kibria, 2017; S. N. Islam, 2010; Rana et al., 2009).
There are about 373 haors located in northeast Bangladesh, covering about 859,000 ha of land. Hakaluki Haor is the largest wetland in Bangladesh and South Asia (I. Ahmed et al., 2008; Alam et al., 2025a; Aziz et al., 2021; CNRS, 2002), which comprises 238 interconnected beels, with a surface area of 181.15 km2 covering Sylhet and Moulvibazar districts (Iqbal et al., 2015; Rana et al., 2009; A. B. Siddique et al., 2024). This haor is rich in fisheries biodiversity and other terrestrial animals, such as reptiles, birds, and mammals (IUCN, 2004). Hakaluki Haor serves as a breeding, nursing, feeding, and overwintering habitat for residents and migratory fish species (Sultana et al., 2022). It also provides a winter shelter for the brood fish, and in the early monsoon, these brood fish produce millions of fries for the entire downstream fishing communities. A previous study by Rana et al. (2009) reported that over 100 fish species are available in Hakaluki Haor, one-third of which are listed as endangered. Hakaluki Haor has been proposed as a Ramsar Site 5 of global importance for the protection and sustainable use of wetlands (Z. Ahmed et al., 2015) and has also been declared as an Ecologically Critical Area (ECA) 6 due to the ecosystem reaching a critical state (DoF, 2015). Recent sustainability assessments using the RAPFISH tool have further highlighted the need for integrated management approaches in this wetland (Aziz et al., 2024).
Hakaluki Haor provides significant benefits to the livelihoods of people through a wide range of ecosystem functions, services and resources. Earlier studies reported that approximately 200,000 people in the surrounding areas rely on the haor ecosystem year-round, either directly and indirectly, for essential services, such as food, nutrition, fuel, fodder, transportation, and irrigation (Aziz et al., 2024; A. B. Siddique et al., 2024). However, the livelihoods of haor fishing communities have become increasingly vulnerable and marginalized compared to those living in the plain land of Bangladesh. Several factors contribute to the current challenges, including fish scarcity, illegal fishing, limited knowledge of sustainable fishing practices, restricted access to open water bodies, inadequate fishing equipment, lack of boat ownership, seasonal unemployment, temporary migration, landlessness, exploitation by middlemen, and political interference in water bodies (Oakkas & Islam, 2020).
Aquatic resources and wildlife in Hakaluki Haor have been reported to decline rapidly in recent decades (Aziz et al., 2021; Aziz et al., 2024). The possible causes of the decline in fish species diversity in Hakaluki Haor include overexploitation, siltation, pollution, and other climatic factors, such as erratic rainfall, temperature fluctuations, drought, flood, and river erosion (Tikadar et al., 2022; M. M. Islam et al., 2021a). Aziz et al. (2021) noted that climate change and anthropogenic impacts are posing serious threats to haor fisheries; therefore, the number of fish species has declined drastically in the last three decades. The water areas in Hakaluki Haor continue to narrow down, and several beels have already lost their ability to harbor brood fish. Out of the 238 beels in Hakaluki Haor, 21 have silted up, while the rest will soon be filling. Moreover, 281 out of the 300 canals have disappeared, and 8 of the 10 surrounding rivers have become canals (The Business Standard, 2020).
The physical appearance, hydrological patterns, and ecosystem of Hakaluki Haor have undergone significant changes over the past few decades. The successful conservation and management of this haor ecosystems and fish species require updated and accurate information on the location, size, and pattern of the haor, as well as the pace of any changes (Murphy et al., 2007). Moreover, reliable data is crucial for understanding the impacts of various factors on the wetland ecosystem and achieving sustainable development. This study aims to: (i) quantify long-term changes in water areas and fish catch using satellite remote sensing and time-series statistical models; (ii) identify key drivers of change, including climatic and anthropogenic factors; (iii) assess the socio-economic impacts on fishing communities; and (iv) provide evidence-based management recommendations. While previous studies have focused on resource management, gear impacts, or biodiversity decline, this research is the first to integrate remote sensing, long-term hydrological data, and advanced time-series analysis with socio-economic surveys to holistically assess changes and impacts in Hakaluki Haor over three decades (1990–2020). Satellite remote sensing data were used to identify and characterize changes in land surface conditions over time because they provide reliable and repeatable assessments of landscape features. Reis (2008) suggested that satellite based remote sensing is a powerful tool to identify waterbodies and guage changes in overlarge areas because it provides continuous snapshots of the earth’s surface over long periods. This approach was used because previous studies have primarily focused on resource management, the impact of fishing gear on fish abundance, and the decline of fish biodiversity in Hakaluki Haor (Aziz et al., 2021); however, comprehensive studies investigating changes in the water area and associated fish catch trends using time series analysis, as well as impacts on the socio-economic status of fishers and shift in their profession, are lacking.
Materials and Methods
This study employed a mixed-methods approach, integrating both primary and secondary data sources. Secondary data were gathered from available satellite image archives to analyze the water area dynamics of Hakaluki Haor over a 30-year period. Additional secondary information, including climatic data (i.e. rainfall and water discharge), and year-wise fish catch statistics, was retrieved from different government organizations [e.g. Bangladesh Meteorological Department (BMD), Bangladesh Water Development Board (BWDB), and Department of Fisheries (DoF)], as well as from published journal articles, reports, etc. In contrast, primary data was gathered by Participatory Rural Appraisal (PRA) tools, including key informant interviews (KII), focus group discussions (FGDs), and field surveys, to assess the fish production, catch trends, and the socio-economic impacts of fishers in Hakaluki Haor (M. M. Alam et al., 2019; Chambers, 1992, 1994).
Study Site
The study areas were selected from five Upazilas (sub-districts) encompassing Hakaluki Haor, located between 24° 34′–24° 47′ N latitudes and 92°–92° 10′ E longitudes: Kulaura, Juri, Barlekha, Fenchuganj, and Golapganj Upazilas, under the Sylhet division of Bangladesh (Figure 1). Hakaluki Haor lies in the northeastern part of Bangladesh, adjacent to the Assam-Bangladesh boundary, and bordered by the Patharia and Madhab hills to the east and the Bhatera hills to the west, with surrounding hillocks, reserve forests, planted forests, tea estates, and rubber plantations (A. B. Siddique et al., 2024). These sites possess an extensive water network, including rivers, floodplains, canals, beels, swamps, and low-lying regions. Hakaluki Haor plays a significant hydrological, biological, and ecological role in the natural functioning of a major river basin, including the Kushiyara River, Sonai-Bardal River, Juri River, and Phanai River. In the dry season, the total beel area in Hakaluki Haor is approximately 4,600 ha; however, the entire area is flooded during the monsoon season, and all the beels merge into a wetland of about 18,000 ha, and it remains underwater for 5 to 6 months depending on seasonal weather. The study sites serve as sanctuaries for many fish species, including several rare species such as threatened, vulnerable, endangered, and critically endangered. The rationale for selecting these sites stems from the uneven topography of Hakaluki Haor and the significant temporal changes in its water areas over time, influenced by human activities, such as resource over-extraction, agricultural intensification, and human settlement, as well as natural processes, including siltation, droughts, and ecosystem dynamics. Hakaluki Haor is recognized as a fast-degrading landscape under increased pressure and threats (M. S. Islam et al., 2021b). Consequently, fish species diversity has been affected by the destruction of natural habitats and obstruction of water flowing into the rivers and canals within the haor. These hydrological and ecological changes adversely affect the socio-economic condition of local communities, destabilize traditional livelihoods, and alter income-generating activities depending on the haor’s resources.

Map of Bangladesh and location of the study site, Hakaluki Haor.
Gathering Data Related to Changes in Water Areas from Satellite Images
Wetland characteristics data were gathered from Landsat images from the Earth Explorer platform (http://earthexplorer.usgs.gov/). The 136/43 path/row satellite images with a 30 m spatial resolution were acquired for February 1990, 2000, and 2010 using the Thematic Mapper™ sensor, and for February 2020 using the Operational Land Imager (OLI) sensor (Table 1).
Satellite Imagery and Reference Data Sources Used for Land Cover Classification in Hakaluki Haor (1990–2020).

All the satellite images were preprocessed following well-known remote sensing Landsat data procedures (Jensen, 2015), which include radiometric and atmospheric rectifications, co-enrollment, and resampling. The images were changed to top-of-atmosphere reflectance (TOC) from digital number (DN) values for ease of comparison. Co-enrollment of each satellite image was completed using 61 ground control points (GCPs), which were collected from prominent landmarks and geomorphologic features. Acceptable root mean square error (RMSE; <0.002011 pixels) was achieved during the image-to-image rectification process for all the images. A combination of the Modified Normalized Difference Water Index (MNDWI) algorithm and Boolean approach has been used by several researchers (Ghosh et al., 2015; Sunder et al., 2017; Langat et al., 2020) in discriminating land and water for the reason of its robustness. This particular approach was also applied in the present research to extract geocoded wetland polygon layers of the respective dates. Subsequently, polygon layers were overlaid to determine the wetland boundary position for each date. Wetland boundary positions were highlighted to infer the changes along the wetland boundary, and the extent of changes was calculated.
To assess the accuracy of the MNDWI method and land/water classification, ground truth data were collected in February 2020. A high-resolution Google Earth™ image of 2020 was used for the image of 2020, and a high-resolution Google Earth™ image of 2010 was used for the image of 2010. The Local Government Engineering Department (LGED) maps of 1989 (published in 1994) and 2000 (published in 2002) were used for the images of 1990 and 2000, respectively as reference data (Table 1). The ‘true’ extent of the Hakaluki Haor was extracted through an on-screen digitization process from all the reference data to check the accuracy of the MNDWI method. The total area of the wetland was estimated from each newly generated reference data and compared with MNDWI-produced polygon layers of the wetland. In addition, the validation of land/water classification for all classified images was done following the methods proposed by Congalton (1991), Congalton and Green (2019), and Congalton et al. (1983). ENVI (5.3, Esri, Colorado, CO, USA) and ArcGIS (10.4, Esri, Colorado, CO, USA) software were used to process and analyze the images in this research. The flowchart in this work is presented in Figure 2.

Flowchart showing the satellite image analysis.
Data Collection
Secondary Data Collection
In Bangladesh, BMD and BWDB are the key agencies responsible for documenting climatic data, including rainfall and river water discharge. In this study, rainfall and river discharge data from the past three decades (1989–2020) were gathered from their published reports to examine water area dynamics in Hakaluki Haor. These data were statistically analyzed, as both rainfall patterns and transboundary river discharge significantly influence water availability in this wetland. Fish catch data for Hakaluki Haor over the past 30 years were obtained from the DoF, which annually publishes fisheries statistical reports.
Primary Data Collection
The primary data were collected through KIIs, FGDs, and a questionnaire survey with relevant stakeholders and fishermen living in the Hakaluki Haor basin. A total of 15 key informants were purposively interviewed, including Upazila Fisheries Officers (UFOs, the primary authorities of Bangladesh in the fisheries and aquaculture sector under the DoF), local fish traders, community elders with traditional ecological knowledge, and representatives of fishers’ cooperatives. Semi-structured interviews conducted in Bangla were audio-recorded with consent, transcribed, and thematically analyzed to assess morphological changes of haor, fishing volume, livelihood patterns, and management interventions. Five FGDs, each with 15 fishers (N = 75; one FGD per Upazila), were conducted in each Upazila to obtain the past and present fish catch trends. Participants were selected to represent variation in age, education, experience, socio-economic status, with a minimum fishing experience of 10 years, and each session lasted between 60 and 90 min. To gather adequate and reliable information on fishing activities and haor-dependent fishers, transect walks were conducted across beels, fishing grounds, and adjacent villages, enabling field validation of fishing practices, habitat conditions, and river–beel–canal connectivity. A structured questionnaire was designed to collect data on fish availability, catch trends, climatic impacts on fish production, socio-economic status, and occupational transitions. A sample size of 100 fishermen (20 from each of the five sites) was determined using a simple random sampling technique, providing a 95% confidence level and ±10% margin of error for the fisher population. The draft questionnaire was pretested with 10 respondents; two fishers in each site, and revised twice prior to finalization. The questionnaire survey was carried out through face-to-face interview from September to December 2020 by five enumerators, all holding Master’s (MS) Degrees in Fisheries and Aquaculture science.
Data Analysis
Temporal satellite data (1990–2020) were analyzed to assess water area dynamics in Hakaluki Haor. The results from each satellite dataset were compared to evaluate changes over time, and a detailed change detection analysis was conducted using pre- and post-change detection techniques. Qualitative data from KIIs and FGDs were thematically analyzed, while survey data were entered into an MS Excel database for management and statistical analysis. Mean (± standard error) values were used to summarize the socio-economic data of the fishers. Descriptive statistical analyses were carried out using the statistical software SPSS (Statistical Package for Social Science) version 23 (IBM SPSS, Armonk, NY, USA).
Statistical Time-Series Analysis
To objectively quantify trends, detect significant changes, and evaluate relationships between variables, a suite of non-parametric statistical tests was applied to the time-series data (1990–2020). All statistical analyses were conducted in R (version 4.3.1; R Core Team, 2023). Missing annual values for fish production and water area were linearly interpolated to create continuous annual series for trend analysis. The Mann–Kendall test was used to assess the significance of monotonic trends, and Sen’s slope estimator was applied to quantify the magnitude of change. Pettitt’s test was employed to detect significant change-points in the fish production series. Spearman rank correlation was calculated to evaluate relationships between fish production, water area, rainfall, and temperature. The significance level (α) was set at .05 for all tests.
Results
Changes in Water Area
Table 2 shows the water area changed every 5 years in Hakaluki Haor from 1990 to 2020. The result reveals that the most shrunken water area was observed in 1995, decreasing 20.52% (1,871 ha) from the base map (2,354 ha) of 1990 (Table 2). In 2000, the water area increased by 17.54% (413 ha) in 1990; however, there was a decrease of 15.38% and 5.18% in 2005 and 2010, respectively. In contrast, the water area increased in 2015 and 2020, accounting for 5.48% and 22.85%, respectively (Table 2). Overall, the water area in Hakaluki Haor increased by 538 ha from 1990 to 2020 (Table 2).
Area of Water Bodies in Hakaluki Haor and Its Rate of Change in Different Years (1990–2020).
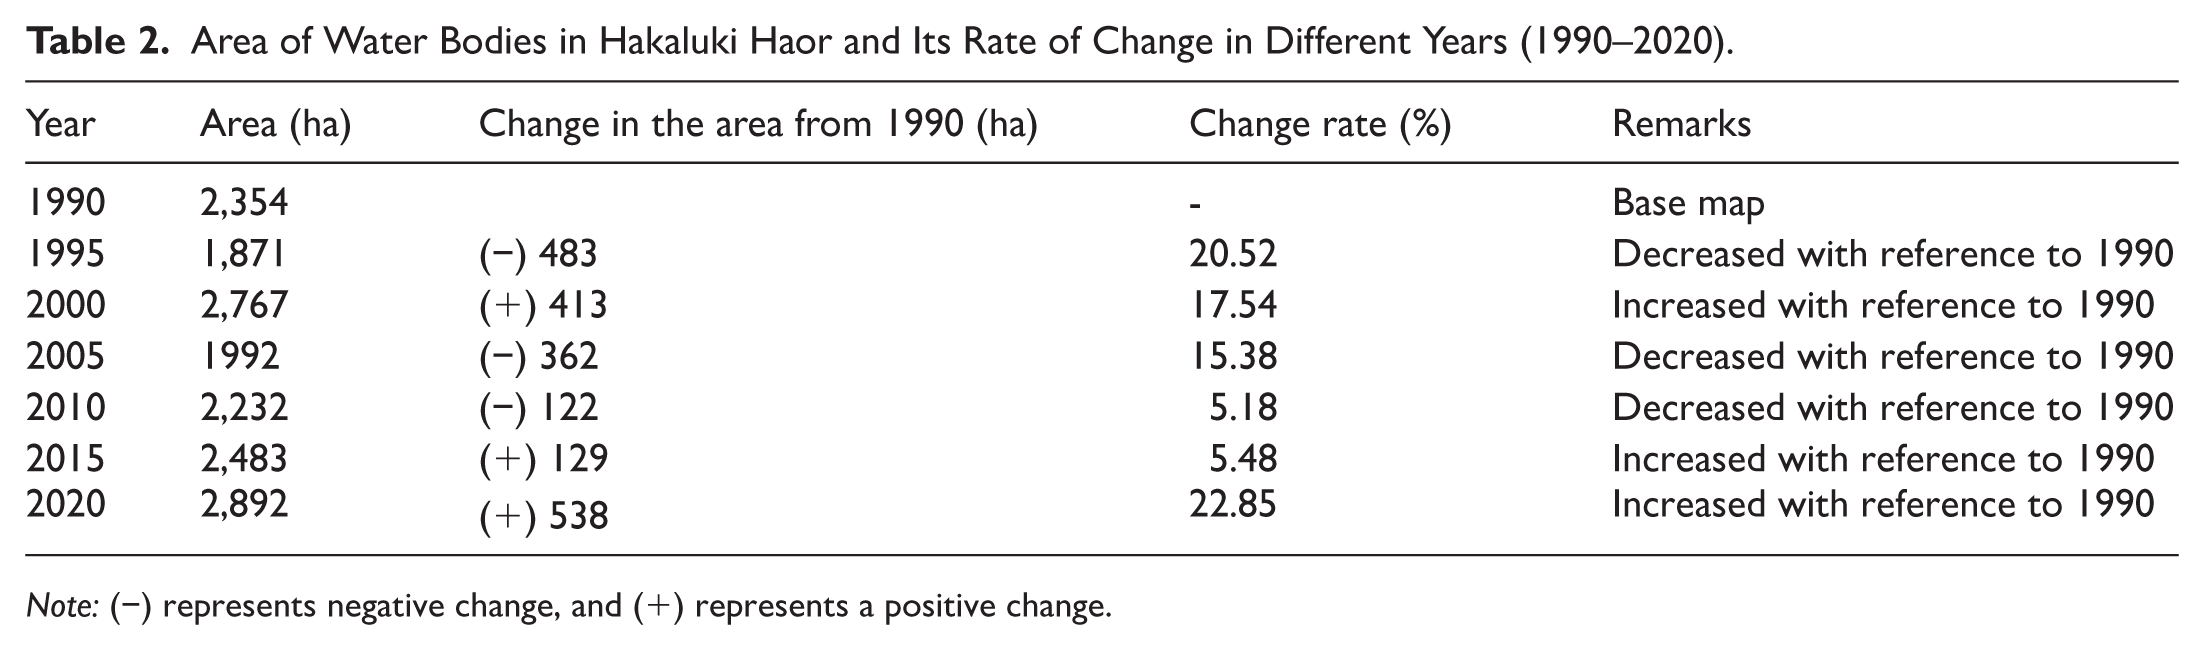
Note: (−) represents negative change, and (+) represents a positive change.
The Mann–Kendall trend test indicates a statistically significant increasing trend in water area over the 1990 to 2020 period (τ = 0.415, p = .001). Sen’s slope estimator showed an average increase of 19.55 ha per year (95% CI: [8.58, 35.26 ha/year]; Table 4 and Figure 4a).
The MNDWI and classified images for 1990, 2000, 2010, and 2020 are displayed in Figure 3a to c. The four MNDWI images of Figure 3a show the changes in the water area in Hakaluki Haor from 1990 and 2020. Furthermore, the classified images of Figure 3b demonstrate that the water area of the study sites increased over 30 years (adapted from Table 2). Finally, Figure 3c illustrates that the water area changed between 1990 and 2020 by color coding; while light blue indicates that the waterbody in Hakaluki Haor was not changed, the maroon and dark blue reflect the increased and decreased water areas.

(a) The Modified Normalized Difference Water Index (MNDWI) in Hakaluki Haor, 1990–2020, (b) water bodies in Hakaluki Haor, 1990–2020, and (c) water area changes in Hakaluki Haor, 1990–2020.
Causes of Changes in Water Areas
The fluctuation in the water area of Hakaluki Haor over every 5 years is shown in Table 3. The highest water area of the beel observed during the study period was 2,892 ha in 2020, while the lowest was estimated at 1,871 ha in 1995 (Table 3). Table 3 also shows the maximum and lowest rainfall amounts observed in the Haor, as well as the water levels of the transboundary rivers that pass through it. In study areas, the highest and lowest rainfall was recorded at 4,428.89 and 1,190.21 mm in 2020 and 1989, respectively. Similarly, the highest water discharge through Hakaluki Haor was observed in 2019 (356,344.3 m3/s), and the lowest was recorded in 2009 (205,750.3 m3/s). Table 3 presents that the change in the water area of the beel depends on rainfall and the water discharge of transboundary rivers flowing through the haor.
Changes in the Water Area, Rainfall, and Water Discharge from the Transboundary River in the Hakaluki Haor (BMD, 1989–1990 to 2019–2020).

Temporal Trends in Fish Production and Water Area
The divergent temporal trends between fish production and water area in Hakaluki Haor are presented in Figure 4a. Fish production showed a continuous decline from 1990 to 2015, with the highest catch recorded at 9,627 MT in 1990 and the lowest at 6,190 MT in 2015, followed by a marginal recovery to 8,047 MT in 2020. In contrast, the water area exhibited a significant increasing trend with fluctuations, ranging from 1,871 ha in 1995 to 2,892 ha in 2020. Statistical trend analysis revealed a significant decreasing trend in fish catch over the 30-year period (Mann–Kendall τ = −0.763, p < .001; Sen’s slope = −83.68 MT/year, 95% CI: [−111.93, −67.95 MT/year; Table 4 and Figure 4a and b). Conversely, water area showed a significant increasing trend (Sen’s slope = 19.55 ha/year, p = .001; Table 4 and Figure 4a). The divergent nature of these trends is further illustrated by the declining productivity ratio (fish production per unit water area) shown in Figure 4d.

Comprehensive statistical analysis of Hakaluki Haor fisheries dynamics (1990–2020): (a) temporal trends in fish production (blue circles, solid line; left axis) and water area (orange triangles, dashed line; right axis) showing significant divergent trends: fish production decreased at −83.68 MT/year (p < .001) while water area increased at 19.55 ha/year (p = .001), (b) fish production time series with significant change-points identified by Pettitt’s test (2004–2005, red rectangle) and binary segmentation (2003, 2006, 2010, 2012, 2017; green diamonds), highlighting a 26.7% decline in 2015 compared to 2010 levels, (c) relationship between fish production and annual rainfall showing non-significant negative correlation (Spearman ρ = −0.486, p = .329), with 2015 marked as an extreme rainfall event (z-score = +1.25), (d) productivity ratio (fish production per unit water area) showing declining efficiency over time, with bars colored by deviation from mean efficiency, and (e) relationship between fish production and area of beel.
Trend, Correlation, and Change-point Statistics for Fish Production and Water Area in Hakaluki Haor (1990–2020).

Change-Point and Correlation Analysis
Pettitt’s test detected a significant single change-point in the fish production time series at 2004 to 2005 (U* = 240, p < .001). Binary segmentation identified multiple change-points at 2003, 2006, 2010, 2012, and 2017 (Figure 4b), indicating dynamic shifts in the production trend, with a notable structural break near 2015. Spearman correlation analysis (n = 6 observation points) showed no statistically significant linear relationship between fish production and water area (ρ = .086, p = .872) or between fish production and rainfall (ρ = −0.486, p = .329; Table 4 and Figure 4c). Water area and rainfall were positively correlated (ρ = 0.714), but this correlation was not statistically significant (p = .111). In 2015, total extreme rainfall (3,893 mm; z = 1.25), exceeded the long-term mean (2,584 ± 1,045 mm), coinciding with a marked 26.7% decrease in fish catch relative to 2010 (Figure 4b and c). The productivity ratio (fish production per unit water area) exhibited a declining trend over the study period (Figure 4d), indicating reduced ecosystem efficiency despite increasing water area.
Socio-Economic Impacts
Table 5 details how climate change and declining fish species diversity have altered the socioeconomic status trends from 1990 to 2020 in Hakaluki Haor. Over this period, the population of the study region increased from 2.0 to 3.5 million, while the number of fishers gradually declined by approximately 50%, from 8,500 to 4,500. The average age of fishers was observed to show minimal differences, ranging between 42.4 (±11.9) and 44.3 (±16.4) years (Table 5). The mean years of schooling among fishers increased from 5.3 to 8.1, and literacy rates rose significantly from 29.8 to 55.1 during this period. Extended households have been dissolving and becoming nuclear families (Table 5). The average household members of the fisher’s community and members engaged in fishing reduced during the period. The study observed that agriculture was once the common secondary occupation of fishers; however, over time, many shifted to alternative livelihoods, such as aquaculture (11%), rickshaw pulling (14%), and small business (35%). The number of secondary occupations in fishers decreased eightfold between 1990 and 2020. The percentage of the majority of fishers shifting their occupation increased rapidly over time. Fishermen have had the right to fish on the beel for the past 19 years; however, currently, influential people keep fishing by leasing the beel from the government. The average annual income of the fishers in the study areas of Hakaluki Haor increased over five times from 1990 to 2020 (Table 5). The fishers of Hakaluki Haor increased seasonal and permanent migration to the divisional city, mostly in Sylhet, Dhaka, and Chattogram, between 1990 and 2020 (Table 5).
Pattern of Change in Socio-economic Characteristics of the Fishers in Hakaluki Haor.

Note: Extended = ⩾5 family members; Nuclear = ⩽4 family members.
Discussions
Changes in the Water Area and Its Causes
The outcomes of this study evidenced significant changes in water-covered areas in Hakaluki Haor over the previous three decades, as confirmed by remote sensing data and MNDWI imagery. Statistical synthesis from BMD and BWDB records showed strong positive correlations between transboundary river discharge, rainfall, and beel water extent. Our time-series analysis confirmed a significant increasing trend in water area (19.55 ha/year, p = .001), driven primarily by climatic variability. The lowest water area (1,871 ha) in 1995 coincided with the lowest rainfall (1190.21 mm) and water discharge (175750.32 m3/s), while the maximum water area (2,892 ha) in 2020 corresponded with peak rainfall (4428.89 mm) and water discharge (356344.33 m3/s). These analyses distinctly demonstrated that variations in the hydrology are primarily driven by regional rainfall and transboundary river discharge. M. N. Islam et al. (2018) made similar observations, noting that heavy rainfall during the previous year was the cause of the increase in waterbodies in the haor areas. Similarly, according to BWDV, excessive water discharge from the transboundary river in the monsoon season covered extensive areas and deeply flooded the downstream part of the haor region, indicating a direct increase in water areas of Hakaluki Haor. Suman and Bhattacharya (2015) stated that intense rainfall in the neighboring hilly regions of India accelerates the water discharge into the Kushiyara River until the water level of the Hakaluki Haor reaches almost the same level as the Kushiyara River.
In addition to hydrological drivers, extensive sediment deposition has led to siltation in most beels and canals, progressively reducing their depth and altering their natural geomorphology. As a result of this diminished capacity to retain water vertically, inflowing water tends to disperse laterally across the flattened surfaces. This lateral expansion contributes to an apparent increase in the areal extent of water coverage within the haor ecosystem. Ramachandra and Ahalya (2001) reported that wetland water supply is influenced by the combined influence of rainfall, river outflow, surface overland flow, groundwater discharge, and seepage from streams, lakes, ponds, and irrigation systems.
Reduction of Fish Catch
The fish availability depends on the water areas of wetlands because they harbor fish and other aquatic organisms required for habitat and reproduction. Khan (2011) reported that the degradation of the maximum interconnected beel in the haor leads to a steady decline in fisheries resources. Our analysis confirmed a significant long-term decline in fish catch (−83.68 MT/year, p < .001), which was not directly correlated with water area changes (ρ = 0.086, p = .872), indicating that other factors are driving the reduction. This decline in catch and the associated reduction in productivity ratios reflect reduced ecosystem efficiency, potentially linked to climate-induced hydrological changes and intensified anthropogenic pressures, especially destructive fishing practices that reduce biomass and disrupt population recruitment. Previous studies have reported that the fish abundance in Hakaluki Haor is strongly linked to climate change phenomena, such as excessive rainfall, erratic rainfall, floods, flash floods, and droughts (Bremer et al., 2019; M. M. Haque et al., 2017). Water pollution from heavy metals and microbial contaminants in nearby aquaculture systems may indirectly affect the haor water quality and fish production (Ahsan et al., 2022; S. R. Islam et al., 2025). Nationwide monitoring has documented antibiotic residues, arsenic, antibiotic resistance genes, and fecal coliforms in aquaculture systems (Ahsan et al., 2024; Lassen et al., 2022; S. R. Islam et al., 2021c). These chemical and microbial pollutants pose substantial risks to aquatic ecosystem health and facilitate the spread of antimicrobial resistance and broader environmental degradation (Ahsan et al., 2022; S. R. Islam et al., 2025; Mannan et al., 2020).
Climatic variability is a key driver of water area changes and fish production in Hakaluki Haor, influencing ecosystem structure and fisheries productivity. Previous studies indicate that climatic variability exerts both positive and negative effects on fish catch. Excessive heavy rainfall can enhance fish production in Hakaluki Haor by expanding the wetland extent, thereby increasing beel water coverage and associated ecosystem services, including aquatic resources availability, biodiversity support, flood control, groundwater replenishment, and climate change mitigation (M. N. Islam et al., 2018). In contrast, climate change has emerged as a major global challenge, substantially affecting capture fisheries production (M. M. Haque et al., 2015; M. M. Islam et al., 2020, 2021), aquaculture (Talukdar et al., 2025; Alam et al., 2024a; Bablee et al., 2024; M. A. B. Siddique et al., 2022a, 2022b; Thornber et al., 2022), as well as hatchery operations (Mahalder et al., 2023). The change-point analysis identified significant breaks in fish production around 2004 to 2005 and near 2015, aligning with periods of extreme hydrological events and management interventions. The sharp decline in 2015, quantified as a 26.7% drop relative to 2010 levels, highlights the sensitivity of fisheries to climatic extremes. Erratic rainfall has emerged as a major climatic factor contributing to a significant decline in fish catch in Hakaluki Haor. Although early monsoon rainfall can stimulate fish breeding, erratic rainfall and reduced hydrological connectivity between rivers, canals, and beels often restrict broodfish access to spawning grounds, thereby limiting larval development and recruitment (Aziz et al., 2021). Despite minor fluctuations in water area, long-term declines in fish catch between 1990 and 2015 were likely exacerbated by climate-induced reductions in water depth and habitat availability, which increase fish vulnerability during shallow or dry periods.
Anthropogenic pressures further exacerbate fish declines and threaten ecosystem resilience. The widespread use of destructive fishing gear, which indiscriminately captures fish and damages aquatic habitats, has been a major driver of fishery decline, compounding the effects of climatic variability (Alam et al., 2025b; Aziz et al., 2021). The depth of the beel has been decreasing over time due to the infrastructure development, including roads, highways, and buildings within the Hakaluki Haor, as well as deposition of water, sand, gravel, mud, and industrial waste from upstream. The majority of beels have silted up, with 10% to 90% of their areas losing aquatic resources (CWBMP-DOE-CNRS, 2005). Consequently, fish lateral migration routes have collapsed, and 43% of small beels that served as feeding sites have been destroyed, reducing fish species diversity and impairing larval migration and feeding grounds, particularly at river–haor intersections (Aziz et al., 2021, 2023, 2024; M. N. Islam et al., 2018; Tikadar et al., 2022). In addition, the lease system, which encourages maximum exploitation, represents a significant threat to long-term fish production and species diversity (M. I. Haque & Basak, 2017).
By 2020, water areas and fish catch in Hakaluki Haor had increased following beel re-excavation and the establishment of beel nurseries. Over the past decades, the Bangladesh government, in coordination with various non-governmental organizations such as the Centre for Natural Resource Studies, has implemented targeted interventions to enhance fish production in haor ecosystems, including the re-excavation of beels and canals, the establishment of fish sanctuaries, and swamp tree plantation. Re-excavation of the beel and canal increased the water-holding capacity of the haor (DoE, 2015), mitigating local extinction risks by maintaining water during dry periods, and enabling brood fish to reproduce, thereby sustaining population growth in subsequent years (Hassan et al., 2005). Building on these outcomes, systematic re-excavation of all beels, guided by scientifically informed planning and coordinated across the Ministry of Livestock and Fisheries, the Ministry of Water Resources, and the Ministry of Land, is essential to secure sustainable fisheries and long-term ecosystem resilience.
Socio-Economic Impacts of Fishers
The socioeconomic status of the fishers’ community in Hakaluki Haor has been impacted directly and indirectly by the decline in fish production and climate change (Aziz et al., 2021). Despite the growing population in study sites, a smaller number of people are engaged in fishing than in earlier decades, suggesting that fishing is losing popularity among the local population. It is documented by earlier literature that the fishing volume and species diversity is decreasing (Aziz et al., 2021, 2023); therefore, fishers are choosing other professions to quit fishing. The fishermen were observed to be a middle-aged group in each case; however, their education level and literacy rates increased, indicating that the new generations felt less interest in fishing and prioritized education to search the different job opportunities. According to BBS (2021), the literacy rate has increased approximately twofold in three decades between 1990 and 2020 in the Hakaluki Haor areas. The education system, hardship, and negative evaluations from the family can discourage intergenerational succession to choose the fishing career (M. M. Alam et al., 2016; Tati, 2013). The extended families of fishermen are splitting into nuclear families, and very few members of their families have continued fishing. Many fishermen have secondary occupations besides fishing, such as agriculture, rickshaw pulling, or small business, indicating that the decline in the fish catch cannot meet their household demand, and influences them to find other employment options. E. Alam and Mallick (2022) stated that fishermen on the southeast coast engaged in alternative livelihood strategies (i.e. agriculture) to cope with less fishing and adverse climatic effects, which is more or less consistent with the findings of this study. Additionally, fishermen have grown disinterested in choosing as a secondary occupation of fishing in Hakaluki Haor owing to the less abundant fish in the waterbody. As climate change has declined fishing; therefore, new generations have switched to fishing activities and migrated to other areas for another profession to a greater extent, seasonally and permanently. Extensive research has revealed that the decline of wild fisheries, driven by shrinking open waterbodies, has compelled fishermen to turn to aquaculture, leading to its rapid expansion in Bangladesh (M. M. Alam et al., 2022; Alam et al., 2024b; M. M. Alam & Haque, 2021; Bell et al., 2023; Bremer et al., 2016; M. M. Haque, 2007; M. M. Haque et al., 2014, 2021; S. R. Islam et al., 2021d; Little et al., 2007; Rumpa et al., 2017). Salim et al. (2019) reported that fishing is associated with many uncertainties and fishermen having to search for reliable alternative livelihoods in the off-season. The new generation has become disinterested in fishing owing to the seasonal nature of the occupation, disaster and other safety risks, and low social status associated with the job, making it an unattractive choice of livelihood option. M. S. Islam et al. (2019) observed similar findings to this study and noted the severe effects of the scarcity of fish due to climate change on fishers’ migration; therefore, many fishers have migrated temporarily or permanently to have a better life and livelihood on the south coast of Bangladesh.
Conclusions
Hakaluki Haor is one of the largest wetlands for freshwater in Bangladesh, having a wide range of ecological, economic, and social importance for the local inhabitants. The physical appearance, hydrology, and ecosystem of Hakaluki Haor have undergone massive changes over time; however, there is a minimum of updated and accurate information available about the pace of changes in the haor. Applying remote sensing methods and MNDWI images, this study reveals remarkable changes in water areas in the haor that occurred between 1990 and 2020. The synthesis of official data from the BMD and BWDB evidenced that rainfall and water discharge from the transboundary river were the main reasons for water area variability in the Hakaluki Haor. Advanced time-series analysis provided statistical evidence of divergent trends: a significant increase in water area alongside a significant decline in fish catch. Fish abundance is regulated by the combined effects of hydrological conditions, climate variability, and anthropogenic activities, such as fishing pressure and habitat degradation. The 2015 fish catch decline was statistically linked to extreme rainfall and siltation-induced habitat degradation, as supported by change-point analysis, while destructive fishing practices may have further contributed to the observed reduction. The fish catch decreased between 1990 and 2015; during that time, most beels in the haor had a minimum depth due to siltation; therefore, most fish species were easily caught due to shallow or dry water most of the time during the winter season. The socio-economic status of the fisher’s community has changed as fish production has declined. The number of fishermen has steadily declined in the study areas; however, their education level and literacy rate have increased, suggesting that they were becoming disinterested in fishing. Fishers in the Hakaluki Haor areas were not found motivated to take up fishing as a secondary career due to the scarcity of fish in the wetland. The new generation of fishers’ communities has switched to fishing activities and migrated to another occupation seasonally and permanently. However, the water areas and fish catch increased in 2020 because the Bangladesh government, in coordination with other NGOs, had started re-excavating the beel and canals earlier time. Prior to beel’s re-excavation in Hakaluki Haor, most beels were shallow or silt-filled, contained water for only a few months during the monsoon season, and dried up in winter. However, with re-excavation, these beels are filled with water all year round. Numerous canals have also been excavated connecting the beels to the river, which previously had no water in winter. Consequently, maximum fish species could not migrate from the river to beel or beel to the river in the appropriate period for spawning owing to the lack of connectivity between beel and the river. After the re-excavation of canals, during the pre-monsoon season, these canals help many species of fish to breed, feed, and move, which they could not do in the earlier period, positively increasing fish production (Hassan et al., 2005). In brief, these techniques worked very effectively; therefore, the government should re-excavate all the beel areas with proper design and planning for increased, sustainable fish production. Finally, it is required to take timely initiatives in coordination between various ministries, particularly the Ministry of Livestock and Fisheries, the Ministry of Water Resources, and the Ministry of Lands, to advance and sustain the fisheries sector of Hakaluki Haor.
Footnotes
ORCID iDs
Ethical Considerations
Not applicable.
Author Contributions
Md. Saifullah Bin Aziz: Conceptualization; Methodology; Data Curation; Formal analysis; Roles/Writing – original draft; Writing – review & editing. Seikh Razibul Islam: Methodology; Formal analysis; Roles/Writing – original draft; Writing – review & editing. Md. Mehedi Alam: Conceptualization; Methodology; Data Curation; Formal analysis; Roles/Writing – original draft; Writing – review & editing. Mohammad Mahfujul Haque: Conceptualization; Supervision; Roles/Writing – original draft; Writing – review & editing. Md. Mostafizur Rahman Mondol: Conceptualization; Supervision; Roles/Writing – original draft; Writing – review & editing. Manoj Kumer Ghosh: Methodology; Roles/Writing – original draft; Writing – review & editing. Md. Asadur Rahman: Roles/Writing – original draft; Writing – review & editing.
Funding
The authors received no financial support for the research, authorship, and/or publication of this article.
Declaration of Conflicting Interests
The authors declared no potential conflicts of interest with respect to the research, authorship, and/or publication of this article.
Data Availability Statement
The data presented in this study are available on request from the corresponding author.
Declaration of Generative AI and AI-Assisted Technologies in the Writing Process
During manuscript preparation, the authors utilized ChatGPT to enhance the clarity and readability of the text. The content was subsequently reviewed and edited by the authors, who take full responsibility for the published article.