
Abstract
For 2 years (2018 and 2021), we studied the presence of microplastics (g) in four sampling stations in intertidal mangroves in Buenaventura Bay, Colombian Pacific. The sediments were extracted using the flotation method and then counted and characterized according to their particle shape and size. We analyze these results using descriptive statistics and a hierarchical model. We found microplastic particles in all sediment samples, with an increase in the average amount of microplastic particles from year to other. Significant differences were found between years and sampling stations, and no significant differences in average microplastics were found in relation to plot location and depth. However, in terms of the spatial distribution of microplastics, a greater accumulation of microplastics was observed in the outer plots located at the edge of the tidal line (forward position). Regarding the vertical distribution of microplastics, a descending accumulation gradient was not observed, as expected. The most relevant particle shape among the microplastics was the fiber (95.75%) and the transparent color was predominant among the identified particles (64%). It is likely that the presence of microplastics is due to the poor management of wastewater and solid waste, resulting in the degradation of marine plastic waste accumulating in mangroves.
Introduction
In various sectors such as transportation, construction, household items, and packaging, plastics are increasingly overused instead of traditional materials. The cumulative global production of primary plastic between 1950 and 2017, was estimated at 9.2 billion tons, and is expected to reach 34 billion tons by 2050 (United Nations Environment Programme [UNEP], 2021). However, due to their durability, low recycling rates, poor waste management, and maritime use, more than 76% of plastics produced worldwide accumulate and persist in marine-coastal ecosystems (Cordova et al., 2021; Geyer, 2020; Lebreton et al., 2017). Plastics pollution is now affecting the environment at all stages of the plastics lifecycle. Plastics manufacturing involves thousands of chemicals that can pollute ecosystems. To reduce plastics’ impact on the environment, the underlying drivers of ecosystem degradation through the plastics life cycle must be addressed (Tessnow-von Wysocki et al., 2023).
In recent decades, it has been found that plastic particles smaller than 5 mm in diameter, defined as microplastics (Group of Experts on the Scientific Aspects of Marine Environmental Protection [GESAMP], 2015), are present in oceans around the world (Andrady, 2011). These particles originate from both primary sources (manufactured for applications such as cosmetic products) and secondary sources (they come from the fragmentation of larger plastics under ambient conditions) (Garcés-Ordóñez et al., 2020; GESAMP, 2015; Maghsodian et al., 2021; Mohamed Nor & Obbard, 2014; J. Wang et al., 2016). Recent studies have demonstrated that atmosphere plays a crucial role in moving microplastics over long distances and continuously engages in exchanges with land-ocean interactions, they simulated a net land-to-ocean transport by the atmosphere in approximately 25 Gg/year, highlighting the importance of controlling terrestrial sources (Fu et al., 2023).
Microplastics are easily confused with food and are ingested by a wide range of marine organisms, transferring through the food chain in some reduced cases (Deng et al., 2021), causing a series of adverse health effects for marine species, such as weight loss, reduced of feeding activity, and low fertility rate and slow reproduction (GESAMP, 2015; Lusher et al., 2017). Furthermore, these plastic particles act as adsorption vectors and carriers of various pollutants such as toxic organic compounds (PAHs and PCBs) and heavy metals (Maghsodian et al., 2022; J. Wang et al., 2016).
The presence of microplastics in the diet of marine beings represents a threat to human health, since these organisms can become contaminated with these tiny particles, which leads to their accumulation and increase in concentration along food chains, thus increasing the risk for those who consume marine products (Cordova et al., 2021). Recent studies have shown the presence of microplastics in fish (Bessa et al., 2018; Huang et al., 2020; Naidoo et al., 2020; Maghsodian et al., 2021) and in oysters (Vieira et al., 2021; D. Wang et al., 2021; Wu et al., 2020).
One of the marine-coastal ecosystems affected by plastics and microplastics are mangroves (Zhou et al., 2020). Mangroves are located in the intertidal zones of tropical and subtropical coasts, recognized as carbon dioxide capturers, and they provide food and habitat for marine and terrestrial organisms. In addition to providing coastal protection and important socioeconomic and cultural benefits for local communities (Luo et al., 2021; Zuo et al., 2020). However, the proximity of mangroves to urban areas and human activities means that they are constantly threatened (Zamprogno et al., 2021).
In recent years, the potential of mangroves as natural barriers against plastic waste in the sea has become evident. This is mainly due to their intricate root system, which functions as natural filters and hinders water movement, resulting in the capture of floating particles in these intertidal ecosystems. (Martin et al., 2019). Recent studies have shown the presence of microplastics in mangrove forest sediments, mostly in Asia (Chaisanguansuk et al., 2023; Cordova et al., 2021; Li et al., 2018, 2019; Mohamed Nor & Obbard, 2014; Zhou et al., 2020).
In Colombia, research on marine debris and microplastics has been limited, particularly focused on the Colombian Caribbean, in contrast to the Colombian Pacific (Garcés-Ordóñez, 2022; Garcés-Ordóñez et al., 2020; Garcés-Ordóñez, Mejía-Esquivia, et al., 2020; Garcés-Ordóñez et al., 2022; Rangel-Buitrago et al., 2021; Riascos et al., 2019; Vásquez et al., 2021).
It has been shown that the mechanisms governing MPs distribution in mangrove includes complex hydrodynamic, and topographical factors such as tidal current velocities, root systems development, and surrounding sediments (Zhou et al., 2023). Moreover, previous studies have demonstrated that MPs distribution in mangroves was closely associated with sediment physicochemical properties such as pH, ionic strength, organic matter, substrate properties, and salinity (Wu et al., 2020).
Coastal populations in Colombia improperly dispose of their solid waste in open dumps, burying, burning, or directly dumping the waste into natural bodies of water, to finally end up floating in the sea, or trapped in the roots of trees, sediment from mangroves and the beaches of the Colombian Caribbean and Pacific (Garcés-Ordóñez & Bayona-Arenas, 2019; Garcés-Ordoñez et al., 2020). Ouyang and Yang (2022) suggested that the density and accumulation of marine debris on seafloors were closely associated with those on sea surfaces and beaches. Thus, their results helped to estimate the transportation, deposition, and aggregation of marine debris from beaches and sea surfaces to seafloors. The beaches in Buenaventura Bay have high concentrations of plastics and microplastics, associated with high population levels, deficiency in basic sanitation, and poor management of tourist areas (Garcés-Ordóñez et al., 2020; INVEMAR, 2017; Riascos et al., 2019; Vásquez et al., 2021).
However, research on microplastics in beaches and mangrove sediments has mainly focused on surface sediments (<5 cm), leaving the study of the vertical distribution of these plastic particles little explored (Deng et al., 2021; Yu et al., 2023). Furthermore, the spatial accumulation of microplastics in intertidal zones has been the subject of study, considering hydrodynamic and ecological factors that influence the interception of microplastics by mangrove roots and their sediments (Ding et al., 2022; Paes et al., 2022; Y. Wang et al., 2022). The objective of this study is to characterize microplastics in mangrove sediments by considering the spatial and vertical distribution in prioritized points of Buenaventura Bay, Valle del Cauca, Colombia.
Methodology
Study Area
The study was carried out in Buenaventura Bay on the central coast of the Colombian Pacific. This region has river mouths with estuarine characteristics and muddy alluvial beaches, it is mainly due to the accumulation of materials from the sea or the contribution of the rivers that flow into the sea. (INVEMAR & CVC, 2007; Sandoval et al., 1995). Because of the contribution of sediment from the rivers and the bay, an estuary is formed that has relatively large sandy bars at its mouths, which makes them geomorphologically mixed estuaries of river valleys of tectonic origin with sandy bars in its largest area (Prahl et al., 1990).
We carried out the sampling in the mangrove forests of four locations: Agua Dulce (AD) (N 3°53.685′ W 77°05.675′), Islalba (IS) (N 3°53.072′ W 77°05.657′), Piangüita (P) (N 3°50.342′ W 77°12.278′), and Punta Soldado (PS) (N 3°48.565′ W 77°10.676′). AD and IS are located on the internal side of the bay, opposite the main port infrastructure and the main urban area of the municipality of Buenaventura, which receives and accumulates solid waste from the urban and rural areas through discharge of water from rivers. In contrast, Piangüita and Punta Soldado are located at the mouth of the bay and receive solid waste from small tourist and fishing places (Riascos et al., 2019) (Figure 1).

Study area and location of sampling stations: (1) Agua Dulce (AD), (2) Islalba (IS), (3) Piangüita (P), and (4) Punta Soldado (PS).
Field Sampling
Sampling in the locations in the months of May 2018 and September 2021, during low tides. In each location, we placed six plots in an area of 50 m2: three plots inside the mangrove (front position) and three outer plots on the edge of the tide line (back position). Each plot had a distance of 25 m between them (Kauffman et al., 2016). For sediment coring, the main mangrove tree in each plot was selected as a reference. The corer was dug to extract the sample, which was divided into three strata: superficial (0–30 cm), medium (31–60 cm), and inferior (61–90 cm). We carried out this process three times for each plot, each sample divided by strata, homogenized, and a composite sample per plot was obtained, in total 18 samples per sampling station.
The samples were stored in labeled aluminum bags, refrigerated at 18°C and transported to the Environmental Sciences laboratory of the Autónoma de Occidente University.
Sample Analysis
According to Hidalgo-Ruz et al. (2012), every sediment sample should undergo a 48-hr drying process in a 60°C oven, followed by filtration through a 500 µ metal sieve. The sieved sediment sample is homogenized and stored in properly labeled test tubes for subsequent analysis. According to Löder and Gerdts (2015), we proceeded to weigh 10 g of sediment from each sample and then added 30 mL of 30% H2O2 for organic matter digestion. Then we added 150 mL of a ZnCl2 solution (1.5 g/cm3) and placed it in a separating funnel to settle the sands and separate the microplastics particles.
Subsequently, we extracted the ZnCl2 solution by vacuum filtration using cellulose nitrate filters of pore size 1.2 µm to 0.47 mm. After washing the filter with distilled deionized water, we placed it in a Petri dish to air dry at room temperature.
Avoid contamination by external particles of microplastics in the laboratory, each sample was analyzed under a vertical flow cabinet, cotton gowns and nitrile gloves were used, metal and glass instruments and containers were used, and these were rinsed with distilled water before processing.
We carried out the visual identification of microplastics in the filtered material using a stereomicroscope (LEICA S6D), coupled to a microscope camera (LEICA MC170 HD). The plastic particles were photographed under the bright field of the stereomicroscope at 2× to 4× magnification using the Leica Application Suite (LAS) software (Hidalgo-Ruz et al., 2012; Liebezeit & Dubaish, 2012). Additionally, we consider the criteria established by Cole et al. (2011) to standardize the selection of microplastics and avoid erroneous visual identification of particles.
We classify the shapes of the particles as (fiber, fragment, spherical) and by color (transparent, blue, green, red, white, and black). Additionally, we recorded the number of microplastics particles per gram of dry sediment (MPs/g).
Experiment Design and Statistical Analysis
We propose a nested design, considering the environmental conditions or the limitations of the process for collecting data with a hierarchical structure. We apply this design, given that observation units at multiple hierarchical levels are organized.
As factors, we consider the year (2018 and 2021), sampling stations (Agua Dulce, Islalba, Punta Soldado, and Piangüita), position of the plot (front and back), and depth (upper, middle, and lower).
Following the experimentation, we measured the number MPs/g. This is a four-stage nested design, sampling stations nested within years, plot position within station, and depths within plot positions.
The following expression defines the hierarchical model at four levels,
where yijklm is the MPs/g response variable, µ is the overall mean, τi is the year effect, βj(i) is the sampling stations effect nested in the year, γk(i,j) is the effect of plot position nested in sampling stations and year, θl(ijk) is the effect of depth nested in plot position, sampling stations, and year, and εijklm the random error. In the analysis of the variable MPs/g, when the model was applied, the errors did not meet the assumptions of normality and homogeneity of variances, therefore, the Cox-Box transformation was applied, being effective (square root MPs/g). In the analysis of the variable MPs/g, when applying the model, the errors did not meet the assumptions of normality and homogeneity of variances, so the Cox-Box transformation was applied, being effective (square root of MPs/g), that is, with this transformation the assumptions of normality and homogeneity of variances were met at significance levels greater than 15%.
We carried out the corresponding calculations and graphs with the help of MiniTab 19 and Excel 2016 software.
Results
We analyzed 144 samples corresponding to three samples for each plot, six plots per station (N = 18), four sampling stations (72 samples) for 2 years.
Abundance of Microplastics in Mangrove Sediment
In all the sediment samples analyzed, we identified 5,073 microplastic particles with an average of 3.54 MPs/g (3,540 MPs/kg) during the 2 years of sampling in the four stations. In 2018, the average MPs/g in the four stations was 2.45 MPs/g in dry sediment (2,450 MPs/kg) for a total of 1,765 MPs. For 2021 we recorded an average of 4.63 MPs/g in dry sediment (4,630 MPs/kg), resulting in a total of 3,308 MPs.
In the analysis of variance (ANOVA) of the MPs/g variable, significant differences were evident between the years (2018–2021), with a level of significance (p ⩾ .000). Likewise, we observed significant differences between the stations nested in the years with a significance level of 13.2%. Given the significant difference between the stations nested in the years, we performed a Fisher Post ANOVA test (Table 1), which obtained the following results:
Clustering using Fisher’s LSD Method and 95% Confidence.

The Punta Soldado and Islalba stations in 2021 are not statistically different (p > .05) in terms of the average MPs/g. The highest average MPs/g was recorded in PS in 2021 with 5.97 MPs/g, followed by IS with 4.74 MPs/g, Agua Dulce with 4.13 MPs/g, and Piangüita with 3.67 MPs/g. In 2018, the highest average MPs/g was observed in the IS station with 2.84 MPs/g, followed by PS with 2.63 MPs/g, AD with 2.44 MPs/g, and P with 1.9 MPs/g, this being the lowest average in this study.
Spatial and Vertical Distribution of Microplastics
In the analysis of variance (ANOVA) of the MPs/g variable, no significant differences were found between the average MPs/g depending on the position of the plots (nested in years and sampling stations), nor in the depths (nested in the years, sampling stations, and position of the plot), at significance levels greater than 0.247.
However, in the spatial distribution of microplastics, we observed a significantly higher accumulation of MPs in the outer plots situated at the edge of the tide line (forward position). These areas showed an average concentration of 3.60 MPs/g, which is notably greater than in other sample station. This elevated presence of microplastics in the forward positions may be attributed to the tidal currents and wave action, which tend to deposit and concentrate debris along the shoreline. As tides fluctuate, they bring various pollutants, including microplastics, closer to the shore, where they become trapped in sediments or vegetation. The accumulation in these areas suggests that tidal forces and the geomorphology of the shore play a crucial role in the distribution patterns of microplastics, highlighting the importance of focusing cleanup and monitoring efforts in these regions. In 2018, the average MPs in the outer plots was 2.41 MPs/g, with the Punta Soldado station having the highest average with 2.86 MPs/g, followed by Islalba with 2.56 MPs/g, Piangüita with 2.48 MPs/g, and Fresh Water with 1.77 MPs/g. In contrast, in 2021, the average MPs/g in the outer plots was 4.79 MPs/g, highlighting the Punta Soldado station with a significant accumulation of 6.85 MPs/g, followed by Agua Dulce with 4.34 MPs/g, Islalba with 4.04 MPs/g, and Piangüita with 3.95 MPs/g.
High concentrations of microplastics in coastal areas can have serious consequences for the organisms that inhabit these ecosystems at the tidal limit, especially those found in the first layers of sediment or in intertidal zones, such as mollusks, crustaceans, and certain species of fish. These organisms can ingest the microplastics by mistaking them for food, which can lead to intestinal blockages, malnutrition, alterations in feeding behavior and, in some cases, death.
In contrast, the interior plots within the mangrove (back position) presented an average of 3.44 MPs/g throughout both years in the four sampling stations. In 2018, the average was 2.49 MPs/g, registering the highest accumulation at the Islalba station with 3.12 MPs/g, followed by Agua Dulce with 3.11 MPs/g, Punta Soldado with 2.40 MPs/g, and Piangüita with 1.32 MPs/g. While, in 2021, the average MPs/g was 4.40 MPs/g, Islalba being the station with the highest average of 5.43 MPs/g, followed by Punta Soldado with 4.83 MPs/g, Agua Dulce with 3.92 MPs/g, and Piangüita with 3.39 MPs/g.
However, a higher concentration of MPs was detected in the surface profile (0–30 cm), with an average of 3.84 MPs/g during both years in the four stations. In 2018, we found that the lower profile had the most significant accumulation with an average of 2.54 MPs/g. The Punta Soldado station is the most representative in this profile, with an average of 2.98 MPs/g; followed by the upper profile with an average of 2.49 MPs/g. The Punta Soldado station is again the most representative station with 3.60 MPs/g and the average profile with an average of 2.33 MPs/g, with Islalba being the most representative station with an average of 3.40 MPs/g. Those data suggest a pattern of MPs, they are generally higher in surface sediments. The higher concentrations of microplastics (MPs) in the surface layers, can be explained by environmental and sediment dynamic factors in mangroves, among which could be the recent input of pollutants, since the surface soil layer is more exposed to recent inputs of microplastics, either from terrestrial (garbage, urban waste) or marine (currents, tides) sources. MPs entering the environment through rainfall or storm surges tends to accumulate first on the soil surface before being transported to deeper layers.
In contrast, in 2021, the most representative accumulation occurred in the surface profile, with an average of 5.20 MPs/g. The Punta Soldado station was the most representative in this profile, with an average of 5.84 MPs/g. The medium profile followed, with an average of 4.25 MPs/g, with Islalba being the most representative station with 5.70 MPs/g, and the lower profile, with an average of 4.34 MPs/g, with Punta Soldado being the station with the highest accumulation with an average of 7 MPs/g.
Considering the spatial and vertical distribution of MPs in the mangrove sediment, we observed that in 2018, the greatest accumulation occurred at the Punta Soldado station, specifically in the forward position and in the surface profile (0–30 cm), with an average of 4.67 MPs/g. Meanwhile, in 2021, the highest accumulation occurred again at the Punta Soldado station, in the same forward position, but in the lower profile (61–90 cm), with an average of 8.47 MPs/g (Figure 2).

Average MPs/g in the four stations, by plot position (F) (Forward (B) and Back) and depth ((0–30 cm) surface profile, (31–60 cm) medium profile, (61–90 cm) lower profile), in mangrove sediments in Buenaventura Bay.
Shape and Color
The most relevant particle form among the MPs was the fiber, totaling 4,856 MPs and representing 95.75% of the MPs identified in this study, followed by the fragment with 3.71% and the spherical shape with 0.57%. In 2018, fibers represented 92.52% of PMs, followed by fragments with 6.06% and spherical ones with 1.42%. In contrast, in 2021, the concentration of fibers increased to 97.43%, whereas fragments and spheres decreased to 2.45% and 0.12% respectively (Figures 3 and 4).

Microplastics by color and shape identified in mangrove sediments in Buenaventura Bay: (A) Transparent fiber, (B) Green fiber, (C) Blue fiber, (D) Red fiber, (E) Black fragment, (F) White fragment, (G) Fragment blue, and (H) Transparent spherical.

Percentage of microplastics by shape identified in mangrove sediments in Buenaventura Bay.
This result agrees with the study by Huang et al. (2023) and Choong et al. (2021), who found fibers as the predominant form of aquatic PMs in the Yangtze River. Many studies have reported that fiber is the predominant form of PMs in river ecosystems, as a quantity of fiber PMs can enter the water body through various sources. Even facemasks used during the pandemic are considered one of the main sources of PM contamination (Fadare & Okoffo, 2020).
In 2018, the Islalba station led with 27.71% of the MPs identified. In 2021, station with 31.08% of the MPs identified the Punta Soldado. Regarding the fragments, the Agua Dulce station was more representative in 2018 with 2.21% of the MPs identified in that year, whereas the Islalba station was more representative in 2021 with 0.97% of the Identified MPs. We did not find spherical shapes at the Agua Dulce and Piangüita stations in 2021. In 2018, the Islalba station did not exhibit any spherical shapes (Figure 4).
In relation to color, transparent predominates among the identified particles, representing 64% of the total MPs in this study. The color blue followed in proportion, representing 30%, and red, with 2.9%. Among the least representative colors were green with 2%, white with 0.6% and black with 0.5% (Figure 5).
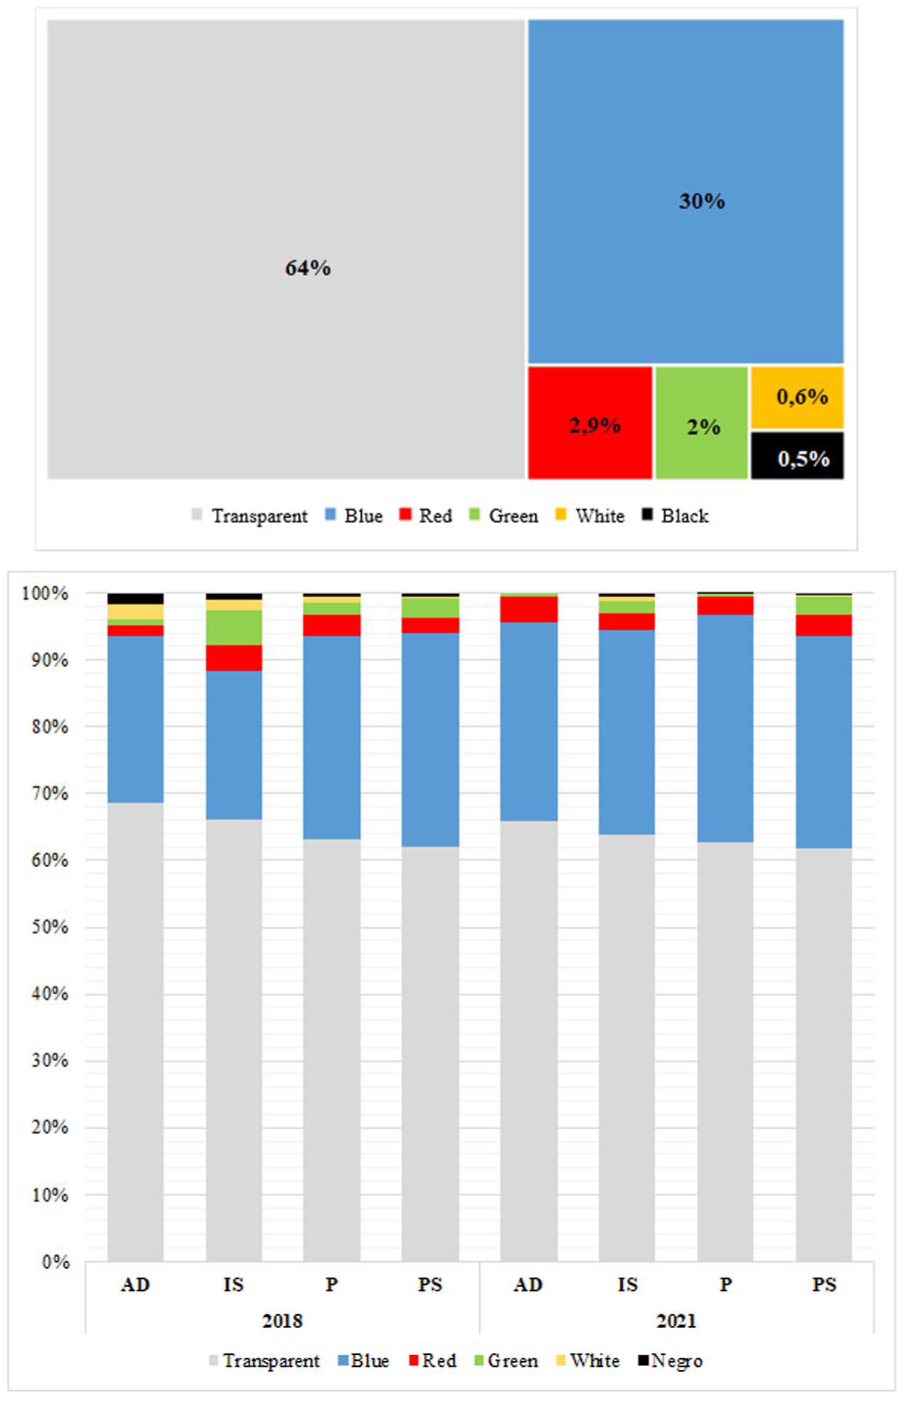
Percentage of microplastics by color identified in mangrove sediments in Buenaventura Bay.
In 2018, the Islalba and Agua Dulce stations were the most representative in terms of transparent color, with 19.15% and 17.05%, respectively, of the MPs identified in that year. Regarding the blue color, the Punta Soldado station was most representative with 8.61% of the MPs identified, followed by Islalba with 6.46%. Furthermore, Islalba demonstrated representativeness in the proportion of MPs in red color with 1.08%, and in green color, with 1.53% of the MPs identified that year (Figure 5).
Unlike 2018, in 2021, the station with the greatest representation in the abundance of MPs by color was Punta Soldado. At this station, the transparent color represented 19.65% of the identified MPs, followed by blue with 10.07%, red with 1% and green with 0.88%. In addition, the Islalba station was also representative, especially in the transparent color with 16.32% and the blue color with 7.89% of the PMs identified this year (Figure 5). In this study, the most outstanding microplastics particle was the transparent fiber, totaling 3,100 MPs and representing 61.1% of the total MPs identified, followed by the blue fiber with 29.8%, the red fiber with 2.7%, the translucent fragment with 2.3%, and the green fiber with 2%.
Discussion
Analysis of the Abundance of Microplastics
The presence of microplastics in mangrove sediments from the four stations in Buenaventura Bay showed a significant increase of 88.7% in the average MPs/g in 2021 compared to 2018. The average MPs/g in this study (3.54 MPs/g or 3,540 MPs/kg) exceeds the figures reported in Buenaventura Bay for the years 2015 and 2018 (277.3 MPs/kg) (Vásquez et al., 2021), these results are above the data observed in Vitória Bay in Brazil (679 MPs/kg) (Zamprogno et al., 2021). The beaches in Buenaventura Bay have high concentrations of plastics and microplastics, associated with high population levels, deficiency in basic sanitation, and poor management of tourist areas (Garcés-Ordóñez et al., 2020; INVEMAR, 2017; Riascos et al., 2019; Vásquez et al., 2021). This can be explained by a worldwide increase in the production of plastics from 359 million tons (MT) in 2018 to 390.7 MT in 2021, as well as its use (www.plasticseurope.org/es).
Furthermore, the results exceed those reported in mangroves off the coast of Singapore (36.8 ± 23.6 particles/kg) (Mohamed Nor & Obbard, 2014), as well as in the mangroves of the Maowei Sea in northeastern South China (520 ± 8 up to 940 ± 17 items/kg) (Li et al., 2019). They also exceed the levels found in the Muara Angke Reserve in Indonesia (10.28 ± 28.09 particles/kg) (Cordova et al., 2021), and in the mangroves of the Gulf of Thailand (1102.1 items/kg up to 426 .9 items/kg) (Chaisanguansuk et al., 2023) (Table 1).
In 2021, the Punta Soldado station recorded the highest average MPs/g, evidencing an increase of 127% compared to 2018. The town of Punta Soldado is located in a rural area at the mouth of Buenaventura Bay. “This area accumulates plastic waste, which comes from both fishing activities and domestic waste generated by small fishing communities” (Riascos et al., 2019). In rural areas, the management of domestic solid waste usually involves incineration or deposit in landfills, due to the absence of adequate collection points for the accumulation and disposal of this waste, which end up in coastal areas, because they are carried by water during the rainy sampling stations or by tidal currents (De et al., 2023).
However, the Islalba station presented an average of MPs statistically equal to the Punta Soldado station in 2021. The location of Islalba, like the Agua Dulce station, in front of the urban area of Buenaventura, implies the reception and accumulation of large discharges of solid waste and wastewater through the mouth of the rivers, especially the Dagua River (Garcés-Ordoñez et al., 2020; Riascos et al., 2019; Vásquez et al., 2021). Both locations are coastal areas most affected by marine litter pollution worldwide, with the presence of large waste such as household appliances, vehicle parts and large containers, possibly transported by river currents (Riascos et al., 2019).
The high presence of MPs in the Punta Soldado mangroves, considering its distant location from the urban area of Buenaventura and the Agua Dulce and Islalba stations, suggests the possible existence of a large-scale diffusion of MPs in the marine environment (Paes et al., 2022). We found similar results in mangroves with marine influence, such as in Ponta Grossa, in Todos os Santos Bay in Brazil, where they observed a high concentration of microplastics, with an average of 15,880 items/kg. Pollution in this area is due to the dumping of local solid waste near the mangroves, especially from low-income communities, as has also been recorded in Cacha Prego, with 10,921 items/kg, and in Ilha de Maré, with 5,108 items/kg (Paes et al., 2022).
Oceanographic and atmospheric processes, including tides, currents, waves, winds, longshore drift and coastal morph dynamics play a fundamental role in the transport, accumulation, and retention of marine debris (De et al., 2023). According to Garcés-Ordoñez et al. (2020), the tidal amplitude on the Pacific coast, ranging between 2.46 m and 3.08 m, influences the distribution of plastic pollution in coastal marine ecosystems. These tidal ranges facilitate the export of plastic waste from urban areas to rural areas, a phenomenon observed in Buenaventura, Tumaco, and Chocó where plastics tend to accumulate in the upper part of the beach.
In a similar context, they reported a significant concentration of MPs (1,227 ± 81 items/kg) in the Shankou Mangrove Nature Reserve in the Beibu Gulf (China), an area with little influence of anthropogenic activities and far from urban centers, but with a high microplastics concentration even higher than that reported in areas near the city. However, they demonstrated that current velocity during flood and ebb tides affected the distribution of PMs in mangrove sediments, underscoring the crucial role of tides as a determining hydrodynamic factor in the transport of suspended particles in mangrove forests mangrove (Zhang et al., 2020). Table 2 presents a summary of some research regarding PMs in mangroves.
Abundance of Microplastics in Mangrove Sediments Around the World.

Source. Own elaboration, 2024.
Analysis of the Spatial and Vertical Distribution of Microplastics
In relation to the spatial distribution of microplastics, the highest concentration of MPs/g we observed in the outer plots of the Punta Soldado station during both years, with an average of 4.85 MPs/g (4,850 MPs/kg). This result is similar to that reported in the mangroves in the Maowei Sea, located in the northeast of southern China, where the highest abundance of MPs in the outer plots was recorded. At these stations, specifically at Quisgier Jing, Longmen Harbor and Qinzhou Harbor, the values ranged between 2,200 ± 27 items/kg, 1,780 ± 18 items/kg, and 2,310 ± 29 items/kg respectively (Li et al., 2019).
Similarly, in the Muara Angke Reserve in Indonesia, outside the mangroves, they found the highest concentration of MPs with an average of 35.01 ± 8.13 items/kg (Cordova et al., 2021). Likewise, in Todos os Santos Bay in Brazil, they recorded averages higher than, those reported in this study, with values ranging between 5,108 items/kg in Ilha Maré, 10,921 items/kg in Cacha Prego, and 15,880 items/kg in Ponta Grossa, all areas with marine influence (Paes et al., 2022). Likewise, in Todos os Santos Bay in Brazil, they recorded higher averages than those reported in this study, with values ranging between 5,108 items/kg in Ilha Maré, 10,921 items/kg in Cacha Prego, and 15,880 items/kg in Ponta Grossa, all areas with marine influence (Paes et al., 2022).
According to Li et al. (2018), the dense vegetation of mangroves plays a crucial role in retaining MPs and plastics floating on the sea surface. The vegetation acts as a barrier, capturing and intercepting these particles in the trunks and roots of the mangroves. In the case of the mangroves of Qinzhou Bay, in southwest China, they observed that the highest concentration of MPs is outside the mangroves, with an average of 2,174.5 ± 2,206.8 elements/kg, where the adherence of MPs to the trunks and roots of mangroves was evident (Li et al., 2018). Mangroves function as sinks and barriers for plastic trash and other solid waste, preventing their dispersion into the marine environment. Observations show that pneumatophores act as filters, preventing large objects dragged towards the mangroves by tidal currents and waves from dispersing again into the sea (Martin et al., 2019).
In relation to the vertical distribution of microplastics, there are no statistically significant differences in the averages of microplastics per gram at the different depths of the four sampling stations during both years. However, the highest accumulation of MPs was recorded in the surface profile (0–30 cm) with an average of 3.84 MPs/g (3,840 MPs/kg) in all stations during both years. These results agree with the report on the mangroves of Todos os Santos Bay in Brazil, where they did not observe significant differences in the vertical accumulation of microplastics in the sediment profile. In this bay, the highest abundance of MPs was detected 30 to 33 cm with 8,417 specimens/kg. It is possible to attribute this finding to the mixing of materials during the deposition and accumulation of sediments, as well as to bioturbation processes (Paes et al., 2022).
However, in 2018, it was observed that the greatest accumulation of MPs in this study occurred in the lower profile (61–90 cm), registering an average of 2.54 MPs/g (2,540 MPs/kg), while that, in 2021, the greatest accumulation of MPs was reported in the surface profile (0–30 cm) with an average of 5.20 MPs/g (5,200 MPs/kg). These values exceed those reported in the mangroves of Queen Sirikit Park in the Gulf of Thailand, where the average MPs was 1102.1 items/kg in a profile of 0 to 142 cm (Chaisanguansuk et al., 2023). Likewise, they exceed the abundances found in the mangroves of Fujian Province, in southern China, where between 0 and 3,123.3 items/kg were found in a profile of 0 to 100 cm. In this province, the greatest accumulation of MPs is located between 4 and 8 cm deep, with an average of 1,006 ± 79 pieces/kg (Yu et al., 2023).
The accumulation of MPs in deep soil layers may be due to the infiltration of these particles, influenced by various factors such as geography, location, properties of microplastics, soil texture, stream flow, and alteration of biota (Chaisanguansuk et al., 2023; De et al., 2023; Paes et al., 2022). MPs can move in different soil layers, from the surfaces to deeper layers through processes such as leaching or bioturbation, the latter carried out by the roots of mangroves or by benthic organisms that inhabit the sediments (Li et al., 2020).
According to John et al. (2021), the polymeric composition of MPs is key in the accumulation in mangrove sediment profiles. This is because particles of polyethylene (LDPE and HPDE), ethylene vinyl acetate (EVA), polypropylene (PP), and polystyrene foam (EPS) are lighter than seawater and tend to remain on the surface. In contrast, denser microplastic particles, such as polystyrene (PS), acrylic, polyamide (Nylon), polyvinyl chloride (PVC), and polymethyl methacrylate (PMMA), have a greater propensity to settle quickly to the bottom, incorporating more probability to sedimentary profiles (Uddin et al., 2021).
Comparison Between the Shapes and Colors of Microplastics
In this study we identified three different forms of microplastics: fiber, fragment and spherical, with fiber being the most predominant form, representing 95.72% of the microplastics recorded in the four stations during both years of sampling in Buenaventura Bay. This percentage significantly exceeds that reported by Vásquez et al. (2021) on mangrove sediments in the same bay, where fibers constituted 63.7% and 56.03% of the total microplastics reported in the years 2015 and 2019, respectively. Likewise, it exceeds what was observed in mangroves on the coast of Singapore, where fibers represented 72% of the identified microplastics (Mohamed Nor & Obbard, 2014). Furthermore, in mangrove surface sediments in Vitória Bay in Brazil, fibers accounted for 88% of total microplastics (Zamprogno et al., 2021), and in Todos os Santos Bay in Brazil, 72% of microplastics. Totals were fibers (Paes et al., 2022).
Microplastic particles with fiber and fragment shapes have been identified as of secondary origin, linked to the degradation of plastic waste in the marine environment (Maghsodian et al., 2021; Mohamed Nor & Obbard, 2014; Zamprogno et al., 2021). The presence of PMs of secondary origin in the Colombian Pacific occurs mainly in rural areas influenced by rivers, such as in Chocó and Buenaventura (Garcés-Ordóñez et al., 2020). This is a result of inadequate management of solid waste and wastewater, as well as the impact of recreational tourism, industrial production of plastic materials and fishing activities, both recreational and industrial (INVEMAR, 2017; Lebreton et al., 2017).
On the beaches of the Colombian Pacific, microplastics find environmental conditions conducive to their rapid fragmentation in situ. This is due to the high temperatures, which range between 28°C to 34°C, the intense solar radiation that varies between 2.5 and 4.5 Wh/m2, and the prolonged exposure to sunlight during the day, which covers from 4 to 10 hr (Garcés-Ordóñez et al., 2020).
In this study, we observed that the Islalba and Punta Soldado stations stood out for the significant presence of microplastics in fiber form during both years. Specifically, the Punta Soldado station registered 28.96% of the total microplastics in fiber form, while the Islalba station presented 25.76% of the total microplastics in this same form. In the case of Punta Soldado, it is attributed that plastic waste pollution occurs mainly due to fishing activities and domestic waste generated by the local fishing community (Riascos et al., 2019). This finding is similar to results obtained in Brazil, in the mangroves of Vitória Bay and Todos os Santos, where high contamination by microplastic fibers was mainly associated with the degradation of fishing nets and ropes (Paes et al., 2022). (Zamprogno et al., 2021).
The presence of microplastics in the mangroves of Islalba is due to the accumulation of solid waste, both through its direct and indirect disposal. Rivers play a crucial role by transporting and depositing their waters with high loads of untreated or partially treated domestic and Agroindustrial waste discharges in the river estuaries of Buenaventura Bay (Riascos et al., 2019). Fiber has been reported as a common form of microplastics in river-influenced mangrove sediments, such as in the mangroves at the mouth of the Mae Klong River in Thailand, where 82% of the microplastics identified in that sediment were fibers (Chaisanguansuk et al., 2023). Furthermore, in the provinces of Guangdong and Fujian, located on the southeast coast of China, they mainly found fibers in sediments near river estuaries, bays, ports, or tourist areas in the studied region (Zhou et al., 2020).
Synthetic fibers, commonly used in clothing, carpets, and a variety of products made with polymeric materials (Chaisanguansuk et al., 2023), are usually found in mangrove sediments because of wastewater discharged into rivers from activities domestic such as laundry (Deng et al., 2021), and, eventually, the fishing industry (Paes et al., 2020). In the mangroves of Singapore, fiber-like microplastic particles were identified as polypropylene (PP) and Nylon, used in the manufacture of clothing, ropes, fishing nets, air filters, and diapers, as well as polyvinyl chloride (PVC), used in industrial applications as binding agents for fabrics (Mohamed Nor & Obbard, 2014).
Microplastics in fiber and fragment form tend to float and remain suspended in water, making them more accessible to aquatic organisms in different parts of the marine system, often mistakenly ingested as food (John et al., 2021; Maghdosian et al., 2022). In contrast, spherical-shaped microplastics have a greater tendency to settle or precipitate on the seabed (Jung et al., 2021).
In this study, we observed that the predominant colors in the identified microplastic particles were transparent and blue, with the Punta Soldado and Islalba stations being the ones that presented the highest proportion of microplastics of these colors. At the Punta Soldado station, the transparent color is 18.59% of the total microplastics identified in this study, while in Islalba it was 17.31%. On the other hand, the color blue constituted 9.56% of the total microplastics identified in this study, while in Islalba it was 7.39% of the total.
According to Li et al. (2019), the proportion and distribution of transparent and blue microplastics could be related to the extensive use of the marine aquaculture industry in the region. Could be related transparent microplastics to their degradation due to exposure to UV rays and other photochemical processes (Li et al., 2020; Maghsodian et al., 2022).
In the mangroves of the Maowei Sea, located in southern China, there was variation in the composition of microplastics was observed depending on the location of the sampling stations (Li et al., 2019). At the stations located in the river estuaries, white and transparent microplastics represented 64.6% and 20.3% respectively. However, in the stations located at the entrances to the sea, the proportion of transparent microplastics increased significantly, reaching 40.3% of the particles identified, with the presence of blue microplastics, with 29.6% of the particles identified in these stations. On the other hand, in the mangroves of the southeastern coast of China, the dominant colors of microplastics in the fibers were blue with 34.7% and transparent with 27.8%, while in the fragments transparent predominated with 38.5%, green with 23.1% and blue with 19.2%.
In this study, microplastics of colors such as green, red, black, and white represented the smallest proportion in the sampling stations, constituting only 6.01% of the total microplastics identified. The degradation of packaging from various industries that have entered the mangroves through rivers with residual discharge discharges to these colors is related.
The color of microplastics is a physical characteristic that influences the rate of ingestion by different trophic levels (John et al., 2021). Microplastics of dark colors, such as blue, black, and green, are more likely to be confused by various organisms with their food resources due to the similarity in color of their original prey be ingested (John et al., 2021; Li et al., 2016). This situation can trigger death from starvation and poisoning due to the side effects of the chemicals used to color polymeric substances, which contributes to the loss of biodiversity in the mangrove habitat (Lusher et al., 2017) affecting the ecosystem services provided by these important ecosystems (Palacios & Cantera, 2017).
Conclusions
From the characterization of the MPs, the following conclusions:
According to the results, we can conclude that: there was a variability in the accumulation of PMs within the mangrove environments, plots located on the edge of the tide line (forward position) have a greater accumulation of PMs compared to the back position. The average MPs in these plots was 4.79 MPs/g, significantly higher compare those with an average of 2.41 MPs/g. Punta Soldado (Buenaventura Bay) showed the highest accumulation of MPs with an average of 6.85 MPs/g among the study period, followed by Agua Dulce, Islalba, and Piangüita. Variability in MPs accumulation between depth profiles (surface, middle, and lower) were found: the most representative accumulation occurred in the upper of mangrove sediments.
The most common particle form among the microplastics identified in this study was fiber. This particle form represented a large majority of the identified MPs, with a percentage of 95.75% of the total. Spherical shapes were the most representative MPs types between the period of 2018 and 2021. The transparent color was the predominant color among the particles identified, representing 64% of the total MPs in the study. Those data suggests that transparent microplastics are the most common in the study area and may have a variety of sources. Finally, the amount of MPs registered in Buenaventura Bay suggest a significant increase of marine debris around the mangroves environments during the 2018 to 2021 period, a similar pattern of deposition and aggregation of marine debris from beaches and sea surfaces around the world.
Limitations of this Study
There were some limitations in developing the Research Project that were basically related to the following:
Access to the sampling and sampling sites in the mangrove ecosystem, due to the swampy conditions of the same it is difficult to bring the materials and equipment to the site. Training of personnel in the visual identification of the different types of microplastics under a stereoscope.
Footnotes
Acknowledgements
Thanks to the Vice-Rector for Research, Innovation and Entrepreneurship of the Autonomous University of the West for funding the project, that has allowed the development of this study.
Funding
The authors disclosed receipt of the following financial support for the research, authorship, and/or publication of this article: Autonomous University of the West-Colombia, Directorate of Research and Technological Development, internal call, with code 19INTER328 and the Universidad del Valle-Colombia, Internal Call 105 2017, Vice-Rector’s Office for Research
Declaration of Conflicting Interests
The authors declared no potential conflicts of interest with respect to the research, authorship, and/or publication of this article.