
Abstract
This study investigates the performance of an aerated treatment wetland (AET) treating dairy wastewater (DWW). Two AET were constructed, one with a uniform gravel substrate and the other with three gravel of different sizes, both AETs were continuously aerated and operated at loadings of 400 gCOD/m2 day. The AET show good performance in terms of chemical oxygen demand (COD > 80%). However, Total nitrogen (TN) removals were low (TN < 60%). Also, the oxygen transfer rate (OTR) was directly affected by the type of substrate used, AET with different substrates showing the highest OTR efficiency (355 gO2/m2 day) due to the better air-water interface. Finally, it is important to mention that the type of substrate used in the AET directly affects their nutrient removal efficiency due to the bed’s empty spaces and their OTR. AET are efficient systems for COD removal, which suggests their potential as secondary treatments for complex industrial waters.
Introduction
The dairy industry is one of the main agro-industrial sectors worldwide. In 2022, the industry processed 936 million tons of milk, with 80% of production being cow’s milk. Asia led the market with 258 million tons produced, followed by the EE.UU and the European Union (International Dairy Federation, 2022). According to Asociación Nacional de Empresarios de Colombia (ANDI), Colombia ranks 24th worldwide in milk production, resulting in 4.0% of the country’s total industrial production. About 7.4 billion liters of milk are processed each year. Antioquia, Cundinamarca, and Boyacá produced approximately 7.5 million L/day (Ministerio de Agricultura, 2020). The processing of dairy products such as milk and cheese generates a large production of wastewater with volumes close to 8 L of wastewater per liter of processed milk (Ekka et al., 2022).
Dairy wasted water (DWW) is characterized by a high variation of pollutant concentrations, with biochemical oxygen demands (BOD) between 40,000 and 48,000 mg/L and chemical oxygen demands (COD) in the range of 80,000 and 95,000 mg/L. Regarding nutrients, the total nitrogen (TN) is between 14 and 830 mg/L, total phosphorous (TP) is in the range of 9 and 280 mg/L and pH can be found between 4.7 and 11 (Gupta et al., 2024). In addition, there are milk residues, solids, fats, nutrients, detergents, and hygiene products that change wastewater concentrations due to the manufacturing processes, the final product, and even the cleaning methods (Chokshi et al., 2016)
Generally, the DWW produced by dairy industries is disposed into the environment without any treatment or even pretreatment, resulting in serious problems such as contamination of surface and groundwater bodies, eutrophication of receiving waters, increased risk to human health, and ecosystemic imbalance (Akansha et al., 2020). Kolev Slavov (2017) stated that the DWW can be treated by physicochemical processes such as coagulation, filtration and sedimentation, and biological processes. DWW treatment uses biological processes like Percolation filters, Lagoons, Activated sludge, and Up-flow anaerobic filters. These technologies are often expensive and demand extensive O&M, especially physico-chemical treatment.
Nature-based solutions (NbS) for water treatment represent a set of technologies inspired by the mechanisms observed in nature. These technologies are based on the interaction of a substrate, such as soil, vegetation, microorganisms, water, and atmosphere. Recently, this concept has gained attention by unifying techniques that were previously classified only as natural systems for the treatment of polluted waters. Among the NbS for water treatment, wetlands (TWs) are recognized not only for their tolerance to high organic loads, but also for their robustness to be combined with other processes, either pre- or post-treatment (Vymazal, 2018). Currently, there are different physical, chemical, and biological methods for the treatment of these wastes, but the high economic and energy costs mean that they cannot be applied in industrial or decentralized communities (Sossalla et al., 2021).
Treatment wetlands (TWs) are efficient in the treatment of domestic wastewater (Konnerup et al., 2009) industrial wastewater (Wu et al., 2015), and agricultural wastewater (Vymazal et al., 2023), as well as in the removal of pharmaceuticals and various pollutants present in wastewater (Zhang et al., 2017). Moreover, TWs have been implemented as an alternative to DWW treatment, with horizontal flow treatment wetlands (HFTWs) being the most widely used (Cai et al., 2012; O’Neill et al., 2011), as well as vertical flow treatment wetlands (VFTW) at pilot scales (Lee et al., 2010). In all these cases, wetlands have demonstrated their capacity to treat different origins of wastewater, achieving significant organic matter removal rates.
Regarding the treatment of DWW with TWs, Nocetti et al. (2024) studied a hybrid system of TWs. The results showed that COD, BOD, TN, and TP were removed by 91%, 94%, 76%, and 64%, respectively. Sharma et al. (2021) also monitored different systems like VFTW, HFTW, and VFTW. They observed that 92%, 95%, 84%, and 86% of TSS, BOD, TN, and TP were removed, respectively. In both cases, the authors suggested using TWs in phases. However, one reason for not using conventional TWs is that they have a low OTR (120–176 gO2/m2 day), and in some cases with high organic load present can be difficult to achieve the discharge requirements (Decezaro et al., 2019).
These limitations were studied by Nivala et al. (2007) and Tang et al. (2009) who found that supplying air with a compressor to a wetland produced the same effect on nitrogen removal as an activated sludge system with the advantage that the power required was reduced by more than half compared to this technology. Although aeration can be performed in both HFTW and VFTW, recent studies show that it has been more widely applied in VFTW (Miyazaki et al., 2023). This new system aims to be more efficient than conventional systems, especially in the removal of organic matter and nitrogen (Sossalla et al., 2022).
Despite the recognized advantages of the TWs, they have some limitations, mainly the requirement for large extensions to be implemented (Brix and Arias, 2005). Also, there are multiple configurations and, in most cases, there are no standardized systems or clear information to define design and operation parameters, for example, the type of substrate, and maximum organic load, particularly in the AET for DWW treatment (Nivala et al., 2020; Wu et al., 2015).
In this sense, this work evaluated the performance of AET, treating DWW from the primary treatment of an industry located in the Sabana of Bogotá, Colombia at 2,625 masl. For this, two laboratory-scale AET were implemented, one with a uniform bed of fine gravel (4 mm < Ø < 8 mm) and the other with a mixed bed of coarse gravel (Ø > 12 mm), medium gravel (8 mm < Ø < 12 mm) and fine gravel (4 mm < Ø < 8 mm). Both systems treated complex DWW with loads greater than 200 gCOD/m2 day. The novelty of this study is particularly relevant for addressing the practical insights such as support media and OTR of aerated wetlands treating dairy wastewater and highlighting areas for future research using TWs in complex wastewater.
Methodology
Characterization of the Dairy Wastewater
The DWW samples were collected after primary treatment in a dairy industry located in the Sabana of Bogotá, Colombia. Samples were, transported, refrigerated, and analyzed within 4 hr of collection following the sample collection and preservation procedure suggested by American Public Health Association (2017). Total Suspended Solids (TSS), Chemical Oxygen Demand (COD), and Total Nitrogen (TN) were measured. All tests were performed in duplicates.
Wetland Design
The feeding system was built from a performed ½ inch cPVC pipe to ensure homogeneous distribution on the surface of the TW. The drainage system was constructed with ½-inch perforated PVC pipe, installed at the bottom of the system. The system was feed using a Master Flex peristaltic pump, programmed by pulses using a mechanical timer, with a total of 6 pulses/day and a duration of 30 min/pulse. A drip irrigation pipe was used as a diffuser for aeration, fed by a compressor with a capacity of 45 L. The compressor supplied air at a pressure of 200 mbar, equivalent to a flow rate of 0.54 L/min. The AET operated with the saturated during the entire period of operation.
Figure 1 shows the support media for the AET1, with a depth of 65 cm of fine gravel (4 mm < Ø < 8 mm). Whereas, for the AET2, three different layers of gravel were used as support media, 15 cm of coarse gravel (Ø > 12 mm), 25 cm of medium gravel (8 mm < Ø < 12 mm), and 25 cm of fine gravel (4 mm < Ø < 8 mm), operating similarly to a French-type vertical flow wetland (Dotro et al.,2017). Both wetlands were planted with Cyperus Haspan.

Aerated treatment wetlands.
Operation
The operation of the AET began with a 3-day inoculation of 4.6 L (1/3 V) of activated sludge harvested from a domestic wastewater treatment plant located in Cájica (Colombia). During the acclimation time water was recirculated as suggested by Von Sperling (2007) to promote the adherence and growth of biofilm in the support medium.
Once the start-up finished the steady state operation began by feeding gradually diluted DWW with tap water, in three different Hydraulic Loading Rates (HLR) while maintaining the OLR for all the tests. During Phase 1, 20% DWW and 80% tap water were applied with an HLR of 0.5 m/day. For Phase 2, 40% DWW and 60% tap water were applied with HLR of 0.3 m/day, and for Phase 3 the ratio was 60% DWW and 40% tap water with HLR of 0.2 m/day. The AET operated continuously for 160 days with an average OLR of 400 gCOD/m2 day. Table 1 shows the parameters evaluated in the AET. For this study, fats oils, and grease (O&G) were not considered since the water came from a primary treatment in which most of the O&G were removed. Likewise, the DWW was previously filtered, reducing the number of solids that could reach the wetland.
Parameters for Wetland Monitoring.
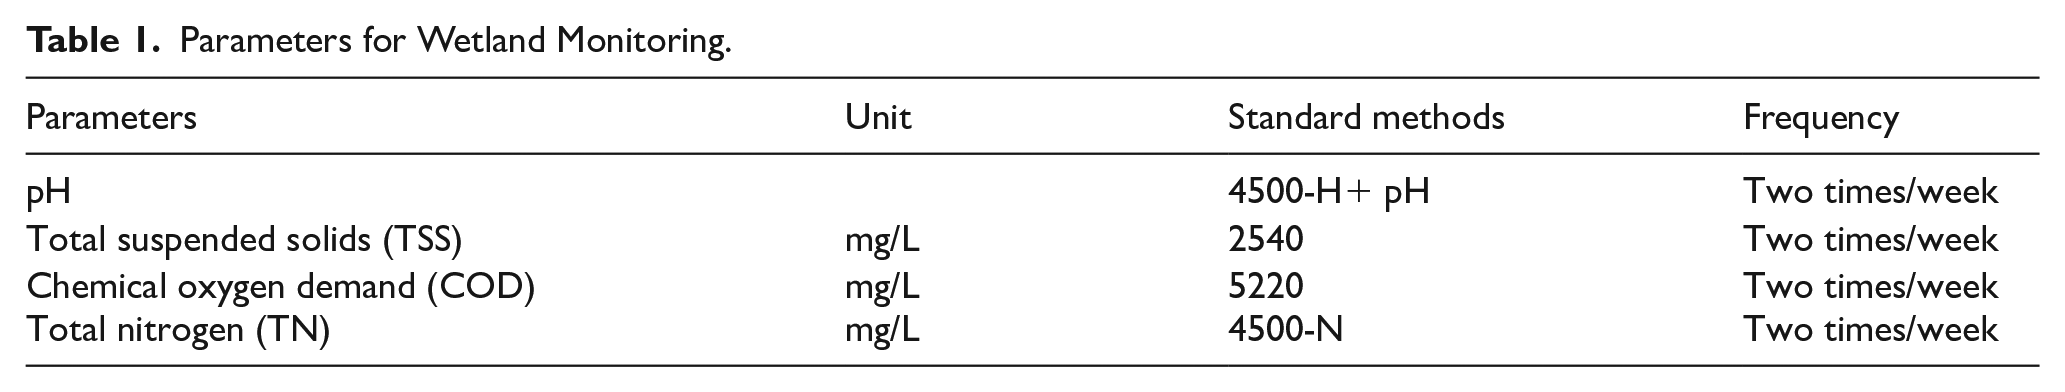
Additionally, the OTR was calculated for local conditions, that is, for a temperature of 15°C, altitude of 2,625 masl, and an atmospheric pressure of 560 mmHg (0.7 atm), and DWW COD concentration according to the equation proposal by Von Sperling (2007). The energy consumption of the system was also evaluated. This was monitored for 10 days with a 220 voltmeter at 60 Hz. The voltmeter was connected to the power source, and only the connection of the aeration system was derived from it.
Statistical Analysis
The statistical analysis was performed through descriptive statistics. Likewise, an analysis of variance (ANOVA) was performed with a significance level of p < .05, to determine the influence on the variation of the support medium. The analysis was performed using Microsoft Excel 2023 software in conjunction with OriginPro 8.5.
Results
DWW Characterization
Table 2 summarizes the DWW characterization. The coefficients of variation (CV) for the evaluated parameters were found to be lower than 20%, indicating a high degree of homogeneity. The average of organic matter values measured as COD can vary between 0.7 and 93 g/L and TSS between 0.1 and 23 g/L.
DWW Characterization.

According to the Colombian regulations on wastewater discharges (Ministerio de Ambiente y Desarrollo Sostenible, 2015) for discharges into surface resources, DWW must not exceed 450 mgCOD/L and 150 mg TSS/L. Regarding nutrients, the standard does not specify minimum values, but it does require that these parameters be analyzed and reported.
For this study, the DWW was treated before the AETs by passing it through a nylon filter with a pore size of Ø = 0.2 mm, in which TSS and most of the O&G remainder from primary treatment were retained. This ensured that the TSS and O&G did not reach the wetland and clog it over time.
Organic Matter Removal
DWW is characterized by high concentrations of organic matter, resulting in high C:N ratios of greater than 10:1 (Ji et al., 2020; Jia et al., 2018). DWW contains residues of milk, solids, fats, nutrients, detergents, and hygiene products (Chokshi et al., 2016). The constituents of DWW vary depending on the product manufactured, the product cycle, and the different additives and cleaning agents used during the process (Min and Li, 2023). All these factors cause the organic loadings of this type of water to vary constantly resulting in high concentrations.
As seen in Figure 2. The AET operated with an average OLR of 395 ± 78 gCOD/m2 day. The optimal OLR for the treatment of Industrial wastewater using treatment wetlands varies based on specific system configuration (i.e. the wetland type, Hydraulic retention time [HRT], hydraulic load rate [HLR], pollutant concentrations, and wastewater characteristics). Skrzypiecbcef and Gajewskaad (2017) found OLR average values of 82 gCOD/m2 day treating wastewater from the food processing industry using HFTW, while Van Thanh Ho et al. (2020) operated a combined system of HFTWs with OLR between 4 and 10 gCOD/m2 day treating wastewater from an industrial park. Therefore, the OLR of this study can be considered as a high OLR.

OLRIn versus OLRRmv.
Figure 3 shows the CODIn (applied) vs. CODRmv (removed). During Phase 1, the CODIn was 878 ± 183 mgCOD/L (CV of 21%) and the CODRmv was 735 ± 164 mgCOD/L (CV of 22%) resulting in an OLR removal of 333 gCOD/m2 day (76%) for AET1, while for AET2 the CODRmv was 680 ± 201 mgCOD/L (CV of 30%) with a OLR removal of 308 gCOD/m2 day (84%). For Phase 2, the CODIn was 1,273 ± 182 mgCOD/L (CV of 14%) and the CODRmv was 1,114 ± 176 mgCOD/L (CV of 16%) with ORL removals of 351 gCOD/m2 day for AET1 and 1,037 ± 223 mgCOD/L (CV of 22%) with OLR removals of 326 gCOD/m2 day for AET2.
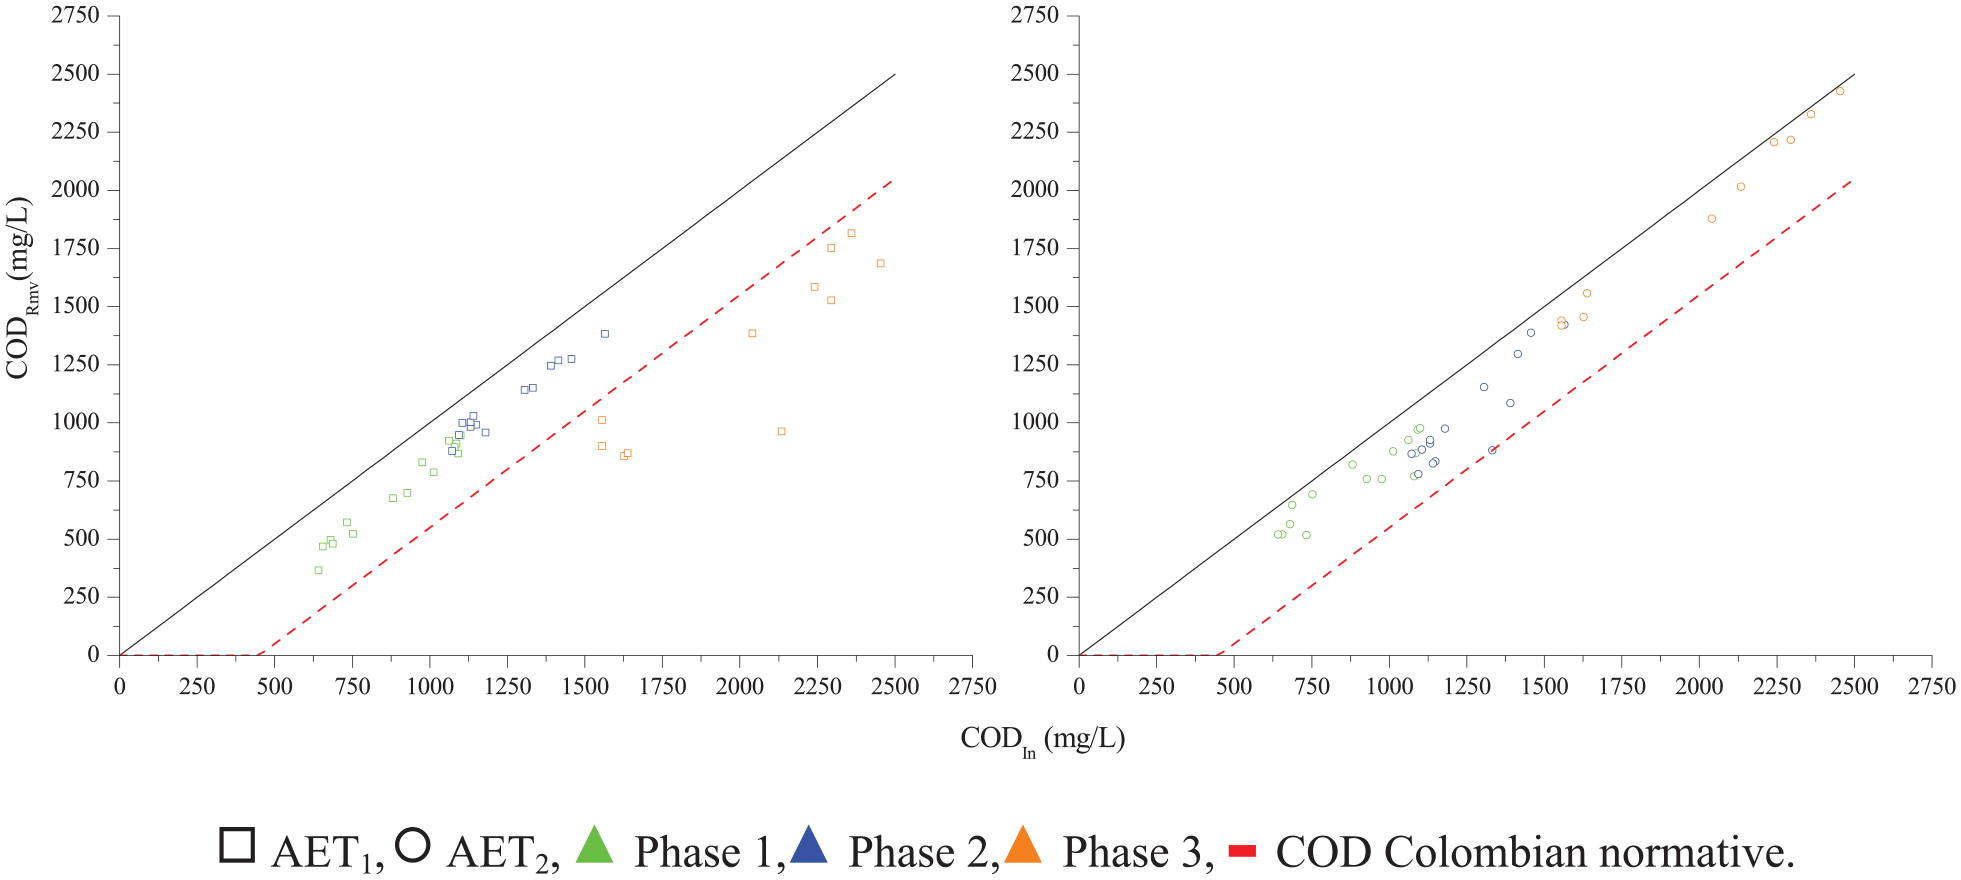
CODIn versus CODRmv.
In Phase 3, the CODIn was 1,831 ± 447 mgCOD/L (CV of 24%) and the CODRmv was 1,128 ± 481 mgCOD/L (CV of 43%) with ORL removals of 238 gCOD/m2 day for AET1, while the CODRmv of AET2 was 1,736 ± 470 mgCOD/L (CV of 27%) with OLR removals of 366 gCOD/m2 day. It can be inferred that the difference in COD removal can be attributed to the stratification of the medium., since in the AET1 the gravel diameter (4 mm < Ø < 8 mm) was smaller than in the AET2, therefore, the oxygen transfer was not sufficient compared to the AET2. This observation was also established by Vera-Puerto et al. (2022) and Portela et al. (2024) referring to the OTR in AET with coarse gravel, it is evident that the renewal rates of the air-water interface are instrumental in achieving an optimal OTR. This enhancement in OTR is attributed to the comprehensive mixing capability, which ensures uniform flow distribution. Consequently, this leads to an improvement in COD removals, underscoring the significance of air-water interface renewal in achieving efficient water treatment processes.
Moreover, in this study, it is observed that AET1 removed 968 ± 374 mgCOD/L during the entire operational period, which in turn corresponds to a removal of 74 ± 16%, while AET2 removed 1,160 ± 523 mgCOD/L which corresponds to a removal of 86 ± 9%. These results are better than those reported by Schierano et al. (2020) finding COD removals of 69% treating DWW in an HFTW with influent concentrations of 269 ± 65 mgCOD/L and similar to the reported by Yazdani and Golestani (2019) finding COD removals above 90% treating DWW in a VFTWs with different support layers. This shows promising results for the use of AET in the treatment of complex industrial wastewater, especially in highly loaded wastewater.
Furthermore, it should be noted that in Colombia, the standard guidelines Resolution 0631/2015 Ministerio de Ambiente y Desarrollo Sostenible (2015) suggest that the value of COD for discharge of the Dairy industry must be below 450 mgCOD/L. It was observed that AET1 complied with the established limits during Phases 1 and 2, while for Phase 3, the results did not meet the limits. Instead, the AET2 met the requirements during all three phases of operation.
Regarding the ANOVA test, the results indicated a significant statistical difference between the treatments evaluated. The probabilities associated with Phases 1 and 2 were p = .008 and .007, respectively, while the probability associated with Phase 3 was even lower, with p < .001. Consequently, the probability for the entire period of operation was p < .0001. The preceding statistical analysis demonstrates that the stratification of the medium significantly influenced the performance of the wetlands. For this study, the AET2 proved to be more effective than the AET1.
Nitrogen Removal
The ratio of organic matter to nutrients (C:N:P) in the DWW for aerobic metabolism is 100:5:1 (Tabelini et al. 2023) The C:N:P ratio in this study was 160:2:1 for Phase 1, 200:2:1 for Phase 2, and 325:3:1 for Phase 3, showing a nutrient deficit in this type of wastewater for aerobic processes.
As shown in Figure 4, the Total Nitrogen Load (TNL) applied to the system was 5.7 ± 0.9 gTN/m2 day for Phase 1, 3.9 ± 0.5 gTN/m2 day for Phase 2, and 2.9 ± 0.6 gTN/m2 day for Phase 3. The average TN concentration at the inlet was 13 ± 2.3 mgTN/L (CV of 17%), while the average concentrations at the outlet were 5 ± 2.8 mgTN/L (CV of 46%) and 9.6 ± 2.7 mgTN/L (CV of 28%), for AET1 and AET2 respectively.
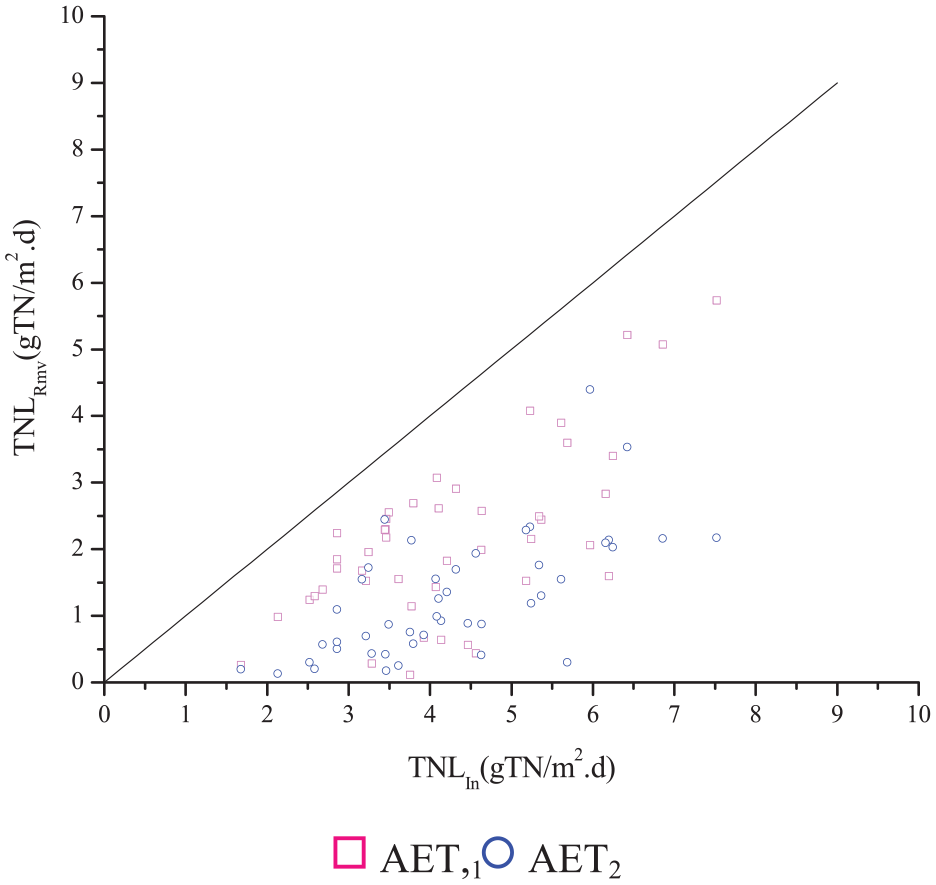
TNLIn versus TNLRmv.
Regarding TN removal, the AET1 presented values of 49 ± 24% for the 5.7 gTN/m2 .d load, 42 ± 22% for the 3.9 gTN/m2 day load and 58 ± 15% for the 2.9 gTN/m2 day, while AET2 removed 33 ± 16% for the 5.7 gTN/m2 day load, 28 ± 15% for the 3.9 gTN/m2 day load, and 22 ± 19% for the 2.9 gTN/m2 day load. Although AET1 presented better values than AET2, both wetlands presented better results than those reported by Pelissari et al. (2014) who obtained removals of 23% for a TNL of 3.09 gTN/m2 day. Miyazaki et al. (2023) and Wu et al. (2016) explain that the removal of TN requires a nitrification process in an aerobic environment and a denitrification process in an anaerobic environment; however, for the denitrification process to take place, an anoxic environment is required, which was not present in this study. Therefore, only the ammonia nitrification was generated, obtaining low percentages of TN removal.
However, the findings were consistent with those reported by Licata et al. (2022) finding TN removals in the range of 35% to 50% treating DWW with HFTWs using a substrate of 30 mm diameter silica quartz river gravel with porosity of 35% to 40%. Miyazaki et al. (2023) and Wu et al. (2016) explained that the removal of TN occurs via nitrification and denitrification process; however, for the denitrification process to take place, an anoxic environmental condition is required, which was not present in this study. Therefore, only nitrification results in limited TN removal.
Oxygen Transfer Rate
As shown in Equation 1, OTR was calculated considering local conditions, ambient temperature, altitude, atmospheric pressure, and COD and TN concentrations. Both the equation and the values of the constants were established according to Boog et al. (2014) and Von Sperling (2007)

Where:
Qair.in Air flow rate applied to the system (m3/h).
δair Air density at study conditions (kg/m3).
0.23 Percentage of oxygen in the air.
SOTE Standard Oxygen Transfer Efficiency (%/m).
T Temperature in the study area (°C).
F Fouling correction factor.
Rous et al. (2019) establish that the SOTE for an AET is 4.7%/m, while Vera-Puerto et al. (2022) obtained values between 2.8 ± 0.4 and 4.5 ± 1.2, for an aeration system at 1 m depth in a medium gravel substrate (6 mm < Ø <12 mm). Therefore, a SOTE of 4.7%/m was assumed for this study.
For AET1 an OTR of 315.9 gO2/m2 day was obtained while for AET2 an OTR of 355 gO2/m2 day was obtained. This difference in the OTR was due to the support medium, since, as shown in Vera-Puerto et al. (2022) larger gravel diameters allow for higher SOTEs.
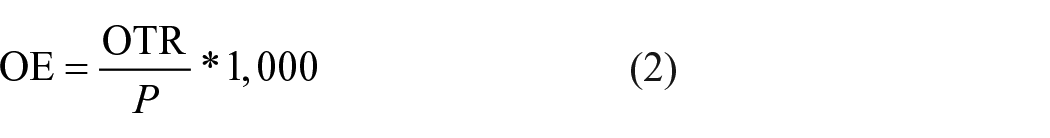
The oxygenation efficiency (OE) was calculated according to Equation 2, established by Von Sperling (2007). Taking this into consideration, the power consumed was calculated according to Equation 3. Finally, Equation 3 was replaced by Equation 2, and the OE was obtained.
Where:
OE Oxygenation efficiency (gO2/kWh).
OTR Oxygen transfer rate (kg/m2 h).
P Power (kW).

Where:
g Gravity (m/s2)
The results showed that the required power was 0.93 kW for both wetlands. However, the EO for AET1 was 14 gO2/kWh with an OTR of 316 gO2/m2 day, while for AET2 it was 15 gO2/kWh with an OTR of 355 gO2/m22 day.
Although Rous et al. (2019) and Vera-Puerto et al. (2022) present the OTR and average SOTE values for different systems, there is no literature concerning the EO of AETs and its relationship with the energy consumption of these systems. Therefore, it is suggested to continue with the study evaluating the EO of AET and its relationship with energy consumption.
Energy Consumption
Table 3 shows the values of the operating and design parameters calculated in this study. It is important to mention that the energy consumption of the system was 297 Wh/day. Considering that the average energy cost in the city of Bogota D.C. is 0.2 $USD/kWh (Enel Colombia, 2024). The energy consumption of this study would be 1.8 $USD/month.
Tecnical Details.

Conclusions
The AETs achieved removals of more than 80% of COD when operating with organic load values close to 400 gCOD/m2 day. The support media was an important factor in the COD removal efficiency and OTR; being that in the AET2 COD removal was more than 1,000 mg/L, but also a higher oxygen transfer rate was observed, 355 gO/m2 day, and a higher oxygenation efficiency, 15 gO2/kWh.
Regarding total nitrogen removal, both wetlands presented low removals, however, it is necessary to evaluate ammonia nitrogen in this type of system to better understand the dynamics of the nitrogen cycle. AETs can function as an alternative to conventional secondary treatment of DWW.
Finally, it is important to mention that further studies are needed to evaluate aspects such as intermittent aeration that allows a nitrification and denitrification process, the kinetics of organic matter removal, as well as the implementation of a combined AET-VFTW system to optimize COD and nutrient removal efficiency in DWW.
Footnotes
Acknowledgements
The authors are very grateful to the Universidad Militar Nueva Granada for financial and technical support through the IMP-ING 3406.
Author Contributions
Jhon Anyersson Lopez: Writing—review & editing, Writing—original draft, Software, Methodology, and Data curation. Sebastian Mendez Corredor: Writing—review & editing, Writing—original draft, Software, and Methodology. Carlos Alberto Arias: Conceptualization, Writing—review & editing, and Supervision. Tatiana Rodríguez Chaparro: Conceptualization, Data curation, Formal analysis, Funding acquisition, Writing—original draft, Writing—review & editing, and Supervision.
Funding
The author(s) disclosed receipt of the following financial support for the research, authorship, and/or publication of this article: The authors are very grateful to the Universidad Militar Nueva Granada for financial and technical support through the IMP-ING 3406.
Declaration of Conflicting Interests
The author(s) declared no potential conflicts of interest with respect to the research, authorship, and/or publication of this article.
Data Availability Statement
Data available upon request.