
Abstract
Despite significant advancements in improving access to safe drinking water, marginalized communities, particularly those relying on rivers and handpumps, continue to face challenges related to water contamination. This study provides comprehensive seasonal water quality assessments from the river and handpump in Barapita, a marginalized village in Odisha, India, using a novel Targeted Parameter Adjustment Strategy (TPAS). TPAS ranks pollutants by their Water Quality Index (WQI) contribution, then iteratively lowers the top contributor(s) to World Health Organization (WHO) permissible levels—recomputing WQI after each step—until the score falls below the “Good” (< 50) threshold, efficiently channelling resources towards the parameter whose incremental correction most improves overall water quality. When full compliance with all WHO guidelines is unrealistic, TPAS provides a practical route to safer water. The use of Hierarchical Cluster Analysis (HCA) enhanced understanding of the contamination sources, grouping parameters into clusters linked to geogenic and anthropogenic sources. We employed sensitivity analysis to identify the parameters influencing water quality during the four distinct seasons: winter, pre-monsoon, monsoon, and post-monsoon. This innovative combination of TPAS, HCA, and sensitivity analysis provides deeper insights into seasonal water quality variations, providing tailored interventions in each season to improve drinking water quality in the village. The findings revealed significant seasonal variations, with the monsoon season exhibiting the highest WQI values due to runoff-induced contamination, while pre-monsoon values were lowest due to reduced anthropogenic interference. Iron, turbidity, colour, and nitrates were identified as critical parameters influencing water quality. The study’s adaptive approach effectively reduced WQI to acceptable levels by sequentially targeting the most impactful parameters, demonstrating the feasibility of low-cost, community-focused interventions in rural contexts.
Keywords
Introduction
The United Nations considers access to potable water to be a basic human right, acknowledging its critical role in sustaining life and enhancing public health (UNESCO, 2022). Nonetheless, water supplies are widely contaminated and deteriorating around the world (UNESCO, 2018), endangering human health and the integrity of ecosystems in both developed and developing nations (WHO, 2020). The quantity and quality of water resources are greatly impacted by climate change (Hasan et al., 2023; Jha et al., 2020), rising nutrient loads, poor waste management, and sanitation methods. Water quality in major rivers has declined in several places, including South America, Asia, and Africa, as a result of home, industrial, and agricultural pollution (Ibrahim, 2019). Apart from the contamination of surface water sources, the contamination of groundwater is also a serious issue, as it accounts for 25% of all freshwater abstractions globally (UNESCO, 2022).
India faces several obstacles in its efforts to guarantee safe water access for its people, particularly in rural and marginalized areas (Zafar et al., 2024). Many regions in India have significant levels of heavy metals, pathogens, and nitrates in their groundwater, which makes it unsafe to consume untreated (Malyan et al., 2019). The chosen study area is Barapita Village in the Khordha District of Odisha State, India. In Odisha, water quality problems such as acidic water, total and faecal coliforms, elevated iron, nitrates, and Vibrio cholerae have been reported (Choudhury et al., 2024; Das et al., 2018; Madhav et al., 2020; Odagiri et al., 2016). In Khordha District, reported water contaminants include fluorides and nitrates (Biswakalyani et al., 2024), high iron concentrations around Bhubaneswar (which is about 20 km from Barapita) (Samal et al., 2023). Nayagarh District, which is neighbour to Khordha, had fluoride levels as high as 10.8 mg/L (Maitra et al., 2021), surpassing the WHO recommended value of 1.5 mg/L. Specific studies on the water quality in Barapita Village were not found in the literature.
The Indian government has implemented several initiatives to increase access to safe water, especially in rural areas. Swachh Bharat Mission (SBM), Jal Jeevan Mission (JJM), and the National Rural Drinking Water Programme (NRDWP) are a few of these programmes. Furthermore, the government is encouraging the sustainable use of groundwater by enacting a number of laws and policies, such as establishing community-based monitoring programmes to check the quality of groundwater and raise public awareness about water-saving measures (Jha et al., 2020). Efficient governance and institutional arrangements for the provision of safe water and sanitation are necessary both at the local and national levels (Kanyagui et al., 2024). Waterborne infections and water pollution continue to be major issues for marginalized populations in India (Kumar et al., 2021), especially those who depend on rivers and handpumps, despite notable progress made to enhance access to safe drinking water (Ghosal & Ruj, 2023).
Developing suitable interventions requires accurate data on water quality. However, estimating water quality and communicating it to various stakeholders becomes challenging due to the diversity of contaminants. Several comprehensive water quality evaluation techniques have emerged. Principal Component Analysis (PCA) and Cluster Analysis (CA) are used to identify pollution sources and understand spatial-temporal variations by grouping similar water profiles (Das & Sarkar, 2021). Machine learning methods, such as Artificial Neural Networks (ANN) and Support Vector Machines (SVM), predict water quality trends using historical data, especially in scenarios where the dataset is complex and there is a need for robust classification (Nallakaruppan et al., 2024). Remote sensing, combined with Geographic Information System (GIS) data, enables the creation of detailed maps showing the spatial pollution distribution and concentrations of contaminants (Dutta et al., 2025). Biosensors and IoT-based monitoring platforms enhance high-frequency data collection, detecting low concentrations of pollutants like heavy metals and organic contaminants, thus supporting real-time responses to pollution events (Atkinson et al., 2021; Verma & Rani, 2021).
Various water quality indices simplify assessments by aggregating multiple parameters into a single value. The WQI, initially proposed by Horton (1965) and modified in subsequent studies (Tyagi et al., 2013; Sutadian et al., 2016), is widely used for its simplicity. Other indices include the Canadian Council of Ministers of the Environment Water Quality Index (CCME WQI), which evaluates water quality based on scope, frequency, and amplitude of deviations from set standards (Canadian Council of Ministers of the Environment (CCME), 2001), and the National Sanitation Foundation Water Quality Index (NSF WQI), which uses nine core parameters weighted by their importance to human health (Sutadian et al., 2016). The Heavy Metal Pollution Index (HPI) is particularly useful in areas with heavy industrial activities and likely to be contaminated with heavy metals (Anitha et al., 2021). The Entropy Weighted Water Quality Index (EWQI) assigns weights to water quality parameters using information entropy, giving a more objective assessment (Siddique et al., 2022). Despite these advancements, we preferred the traditional WQI in our research for several compelling reasons. Its simplicity is crucial in a marginalized rural village where resources, technical expertise, and access to advanced tools are limited. The WQI requires fewer data inputs and less sophisticated equipment, making it more feasible given the constraints in data availability and monitoring infrastructure.
Although there are several studies that have assessed the drinking water quality in India at the district level (Karunanidhi et al., 2021; Khatri et al., 2020; Mazhar & Ahmad, 2020; Sarkar et al., 2022), there is a dearth of information regarding the impact of seasonal variations, especially at the village level. The objectives of this study are to evaluate the seasonal dynamics of drinking water quality in a marginalized rural village, identify the key parameters influencing the WQI, and develop innovative, resource-efficient strategies to improve water quality. Specifically, the study seeks to (1) analyse seasonal variations in physicochemical and biological water quality parameters, (2) employ sensitivity analysis and hierarchical cluster analysis to prioritize contaminants and uncover underlying patterns of contamination, and (3) propose targeted, low-cost interventions tailored to the village’s unique socio-environmental conditions. This research addresses a critical gap in the field by combining advanced analytical methods, such as targeted parameter adjustment, sensitivity analysis, and cluster analysis, with actionable recommendations that are feasible for resource-constrained communities. The insights gathered through this study can guide the solutions to the water quality problems of similar small villages and hamlets.
Study Area
Village Overview
Barapita is a village located in Khordha District, Odisha State, India. Its location is shown in Figure 1. It is a marginalized village inhabited by the Ho tribe, which is classified as a scheduled tribe by the Indian government. The Indian Constitution classifies Scheduled Castes and Scheduled Tribes in Articles 341 and 342 and gives favourable policies for them in several economic and social disciplines (Sarkar, 2023). Despite constitutional protections, these groups are still marginalized and impoverished (Wahi & Bhatia, 2018). There are 58 households in Barapita with houses sitting on land averaging 0.2 acres per household. In some instances, the houses are crowded together so closely that one cannot clearly distinguish between the different households. The main activity in the village is farming, particularly paddy. Most of the villagers work as labourers in the paddy fields or in nearby villages or industries.

Location of Barapita Village.
Drinking Water Sources in the Village
There are six handpumps in the village, but only one is being used for drinking purposes by the villagers. The locations of the drinking water sources in Barapita are shown in Figure 2.

Map showing the drinking water sources in Barapita Village.
Most of the villagers use one of the handpumps, which is centrally located as a drinking water source. Three of the handpumps are mainly used for bathing and washing, while two of the handpumps are not functional. Some of the handpumps had ion exchangers installed on them as a way of treating iron contamination. Apart from the handpumps, the villagers also depend on the Derasa River that flows at one end of the village for drinking. The drinking water sources in Barapita during the study period are shown in Figure 3.
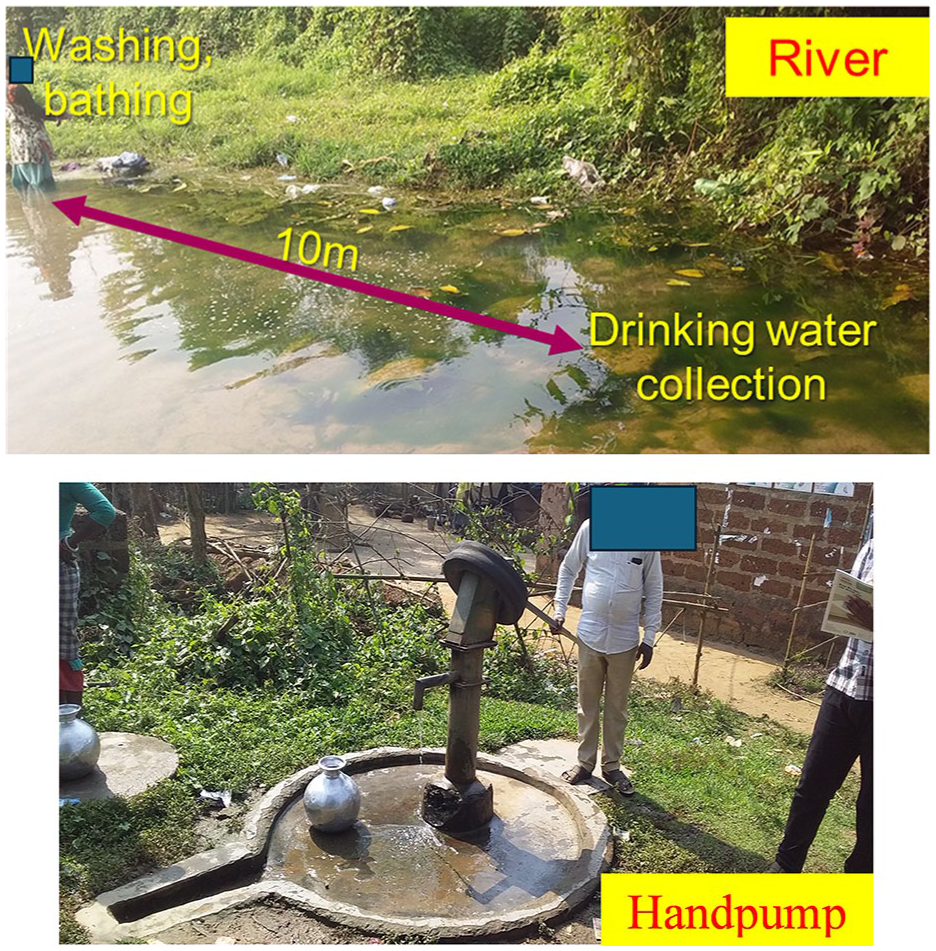
Drinking water sources in Barapita during the study period.
Some of the villagers consume untreated river water. They also depend on the river for bathing and washing clothes, with the bathing and washing point separated from the drinking water abstraction point by approximately 10 m. Amrita University through the Live-in-Labs programme, installed a water treatment system known as the Jivamritam in 2022 as a way of providing safe water in the village. Nearly 250 villages across India have installed this system (Ajith et al., 2022). However, the system cannot remove iron, and it also cannot correct the pH. Hence, the villagers are still at risk due to these two factors. By the time we collected data for this study, the Jivamritam was not operational.
Methods
Study Area Map
The location map (Figure 1) was produced in QGIS 3.30 using open-access administrative-boundary shapefiles that were downloaded from the Global Administrative Areas database (GADM) for India (national, level 0), Odisha (state, level 1), and Khordha (district, level 2). The Barapita village boundary was digitized on-screen from 0.5 m Google satellite imagery and checked against handheld-GPS waypoints collected during the August 2023 field survey. All layers were re-projected to WGS-84 (EPSG 4326); “Clip” and “Extract by Mask Layer” tools isolated the state and district extents. Distinct symbol fills were added in QGIS under the “Properties” of each layer. The map was fine-tuned by adding such features as the north arrow in the “New Print Layout”, after which the figure was exported as a 300 dpi PNG.
Survey Questionnaire
We created a questionnaire to learn more about the village’s drinking water supply system. The survey contained several questions, including demographic data, drinking water source, responsibility for fetching water at the household and household water treatment practices. The first author and a translator visited the households, and the translator asked the villagers questions. The duration of each survey ranged from approximately 30 to 45 min. To collect the responses, we programmed the questionnaire in Kobo Toolbox software and collected the data using a mobile application. Kobo Collect is an Android-based data collection tool that can be used flexibly and sends the collected data directly to a shared server for analysis and storage.
Experimental Data Collection
Water samples were obtained from the two primary drinking water sources, namely the handpump and the river, every two months over a year to evaluate the seasonal fluctuations in water quality. The testing covered the four seasons where differences in WQI were anticipated, namely winter, pre-monsoon, monsoon, and post-monsoon. We collected seven water samples from each of the drinking water sources (river and handpump), for a total of 14 samples.
We collected the specimens in 1-liter aseptic, broad-opening plastic containers. The sample containers were rinsed with distilled water and subsequently dried. The samples were promptly delivered to the laboratory for processing within one hour of being collected. We followed the standard methods stipulated by the American Public Health Association (APHA) for the analysis (Rice et al., 2012). The physicochemical parameters measured were turbidity, pH, temperature, iron, nitrates, sulphates, total hardness, arsenic, fluoride, lead, cadmium, and electrical conductivity. The biological parameters consisted of measurements for total coliforms, Escherichia coli (E.coli), and faecal coliforms.
WQI Calculations
WQI can be utilized to communicate and evaluate water quality from the sources being assessed. The Weighted Arithmetic Water Quality Index (WAWQI) was employed in this study. We selected pH, nitrates, fluoride, iron, colour, turbidity, and total dissolved solids because from our analysis, they occasionally exceeded the recommended guidelines, and regional studies indicated that these parameters occasionally exceeded the WHO and Bureau of Indian Standards (BIS) guidelines. Iron, a heavy metal, was included due to its elevated levels affecting both water quality and health. In contrast, other heavy metals such as arsenic, cadmium, and lead were consistently found at concentrations below 0.001 mg/L or were not detectable in some instances. This evidence indicates that these metals are not significant contaminants in the study area. By prioritizing parameters that surpass guideline values and have direct implications to the community’s health, we ensured a focused and efficient assessment of water quality that is most pertinent to the local population’s needs.
We calculated the WQI for each season and finally plotted the graphs to show the variation in WQI for the whole year. The equations used to calculate WQI were adopted from Islam (2024) and Zafar et al. (2024) and are given as follows:
Step 1: The unit weight (Wn) for each parameter was calculated using Equation 1

where,

Sn = standard value for the nth parameter,
k = constant of proportionality,
Step 2: The sub-index (Qn) was then calculated using Equation 3.

where:
Vn = estimated mean concentration of the nth parameter measured in the laboratory,
V0 = ideal values of the parameters in clean water (generally V0 = 0 for all parameters except for pH in this study, which has a value of 7).
For pH

Step 3: Combining steps 1 and 2 to calculate the WQI

Sensitivity Analysis
We conducted a sensitivity analysis to evaluate the influence of each variable on the WQI. Sensitivity analysis is an essential component of water quality evaluation, as it identifies the most significant components influencing the WQI, hence guides successful water management methods (Khare et al., 2019). The process involved removing a variable one at a time and calculating the new index without that variable and then comparing the new index with the original index with all measured parameters (Rickwood & Carr, 2009). The objective was to evaluate whether the removal of a specific variable affects the relationship between the new index and the original index. We also plotted the modified WQI values against the baseline WQI to visually assess the influence of each parameter.
Development of a Targeted Parameter Adjustment Strategy (TAPS) to Achieve Acceptable WQI Levels
To enhance the water quality in the village and bring the WQI within the “Good” or “Excellent” categories, we developed a systematic strategy focused on identifying and prioritizing specific water quality parameters for correction. Implementing treatment systems that address multiple parameters simultaneously can be complex and cost-prohibitive in marginalized rural areas (Daniel et al., 2021). Focusing on one parameter at a time allows for simpler, more manageable interventions. By targeting the most influential parameters first, resources can be allocated efficiently to achieve the greatest improvement in water quality (Mankin et al., 2005). This approach enables the development of customized strategies that consider the specific contamination profile and seasonal variations identified in the study. This approach is particularly suitable for rural settings, where resources are limited and interventions need to be cost-effective and manageable. Seasonal adjustments ensure that interventions remain effective throughout the year, addressing fluctuations in contaminant levels (Vaiphei & Kurakalva, 2021). This method provides a practical framework for prioritizing interventions, optimizing resource use, and tailoring solutions to the community’s specific needs. The strategy involved nine stages, as illustrated in Figure 4.

Targeted parameter adjustment strategy development.
The methodology is outlined below:
• Calculate the WQI using all measured water quality parameters, following the weighted arithmetic mean method.
• Compare the calculated WQI in step 1 with the standard categorization thresholds of “Excellent” 0 to 25, “Good” 26 to 50 and if it is within these categories and all parameters are within the permissible limits, accept the parameter concentrations.
• If the calculated WQI > 50 classified as “Poor” 51 to 75, “Very Poor” 76 to 100, or “Unsuitable for Drinking” > 100, it is signalling the need for intervention.
• If the calculated WQI > 50 in step 2, identify the parameters exceeding their permissible limits.
• Rank the identified parameters in descending order based on their percentage contribution to the overall WQI.
• Starting with the parameter contributing the most to the elevated WQI, adjust its concentration to its permissible limit as per WHO guidelines.
• Recalculate WQI and assess if it has fallen below 50.
• If WQI < 50: The water quality was deemed acceptable, and no further adjustments are needed.
• If WQI ⩾ 50: Proceed to incrementally reduce the parameter’s concentration to fractions of its permissible limit (80%, 50%, 40%, 20%, 10%, 5%, 2.5%, and finally 0%, which is the ideal value for all parameters except pH, where the ideal value is 7.0).
• If adjusting the first parameter to its ideal value did not reduce the WQI below 50, introduce the next parameter in the ranked list.
• Repeat the adjustment process for this parameter, starting from the WQI last calculated after adjusting the previous parameter.
• Continue this iterative process for all parameters exceeding permissible limits.
• If the WQI remained above 50 after adjusting all exceeding parameters, target iron (specifically in this study) due to its significant influence on the WQI, as identified in the sensitivity analysis.
• Adjusting iron concentrations had a substantial impact on lowering the WQI to acceptable levels.
Hierarchical Cluster Analysis (HCA)
We enhanced the methodology by utilizing HCA to categorize analogous water quality measures, thereby elucidating the fundamental patterns and interactions among the examined variables. HCA is an unsupervised multivariate statistical method commonly employed in environmental research to categorize variables or observations into clusters according to their attributes (Shresta & Kazama, 2006). Our investigation employed Ward’s technique, a widely recognized procedure in HCA, noted for its efficacy in forming clusters with little intra-group variance while maximizing inter-cluster dissimilarities (Ward, 1963). The resemblance between parameters was quantified utilizing euclidean distance. The HCA produced a dendrogram, a tree-like figure that visually depicts the clustering process and demonstrates the correlations among the water quality characteristics. The dendrogram facilitated the identification of parameter groups with analogous patterns, possibly signifying shared pollution sources or comparable behaviours in the aquatic environment (Zhou et al., 2007).
Results and Discussion
Drinking Water Sources Usage and Household Treatment Methods
Most villagers (64.3%) depend on the handpump for drinking water purposes, 30.3% rely on the river and 5.4% use both sources of water. Most villagers (59%), irrespective of water source, do not treat their drinking water (Figure 5) at the household level.

Household water treatment methods and drinking water sources (numbers along lines represent number of households).
The significant dependence on handpump water reflects the limited infrastructure and resources commonly seen in rural marginalized areas. The primary reason for the high proportion of villages not treating their water suggests a combination of insufficient knowledge and limited access to necessary resources. Behailu et al. (2017) have seen similar tendencies in other rural areas, where the convenience and perceived safety of handpump water deter additional treatment. From the survey it came out that most villagers perceive the river water to be safe for drinking, and some continue to use it. Most of the villagers were not aware that unsafe water could be risky to their health. Hence, there is a need for conducting water and sanitation awareness campaigns. Most of the villagers are illiterate, and this might contribute to their limited knowledge about water quality. Another reason the villagers may not treat their water is that the river water appears clean and clear. This might cause the villagers to perceive the “clean water” as safe, resulting in them not treating it. To encourage water treatment at homes, it is essential to introduce affordable and easy-to-use water treatment kits in the village, such as chlorine tablets or filters. Boiling drinking water demonstrates an adaptive approach to reduce immediate health hazards, which is corroborated by research conducted in other areas where boiling is a prevalent technique for ensuring water purity (Ajith et al., 2023). The lack of treatment among a substantial proportion of the population poses considerable public health problems. Unprocessed water, particularly from manual pumps, may carry dangerous viruses and impurities. The practice of cloth filtration, mainly by handpump users, reflects a traditional method to remove particulate matter, though it is less effective against microbial contamination (Dey et al., 2022).
Comparative Analysis of Water Quality Against WHO and Local Standards
The average values of the water quality parameters that were determined for the river and the handpump, their methods of analysis, the WHO guideline values and the Bureau of Indian Standards (BIS) are shown in Table 1.
Measured Water Quality Parameters From the Main Drinking Water Sources.
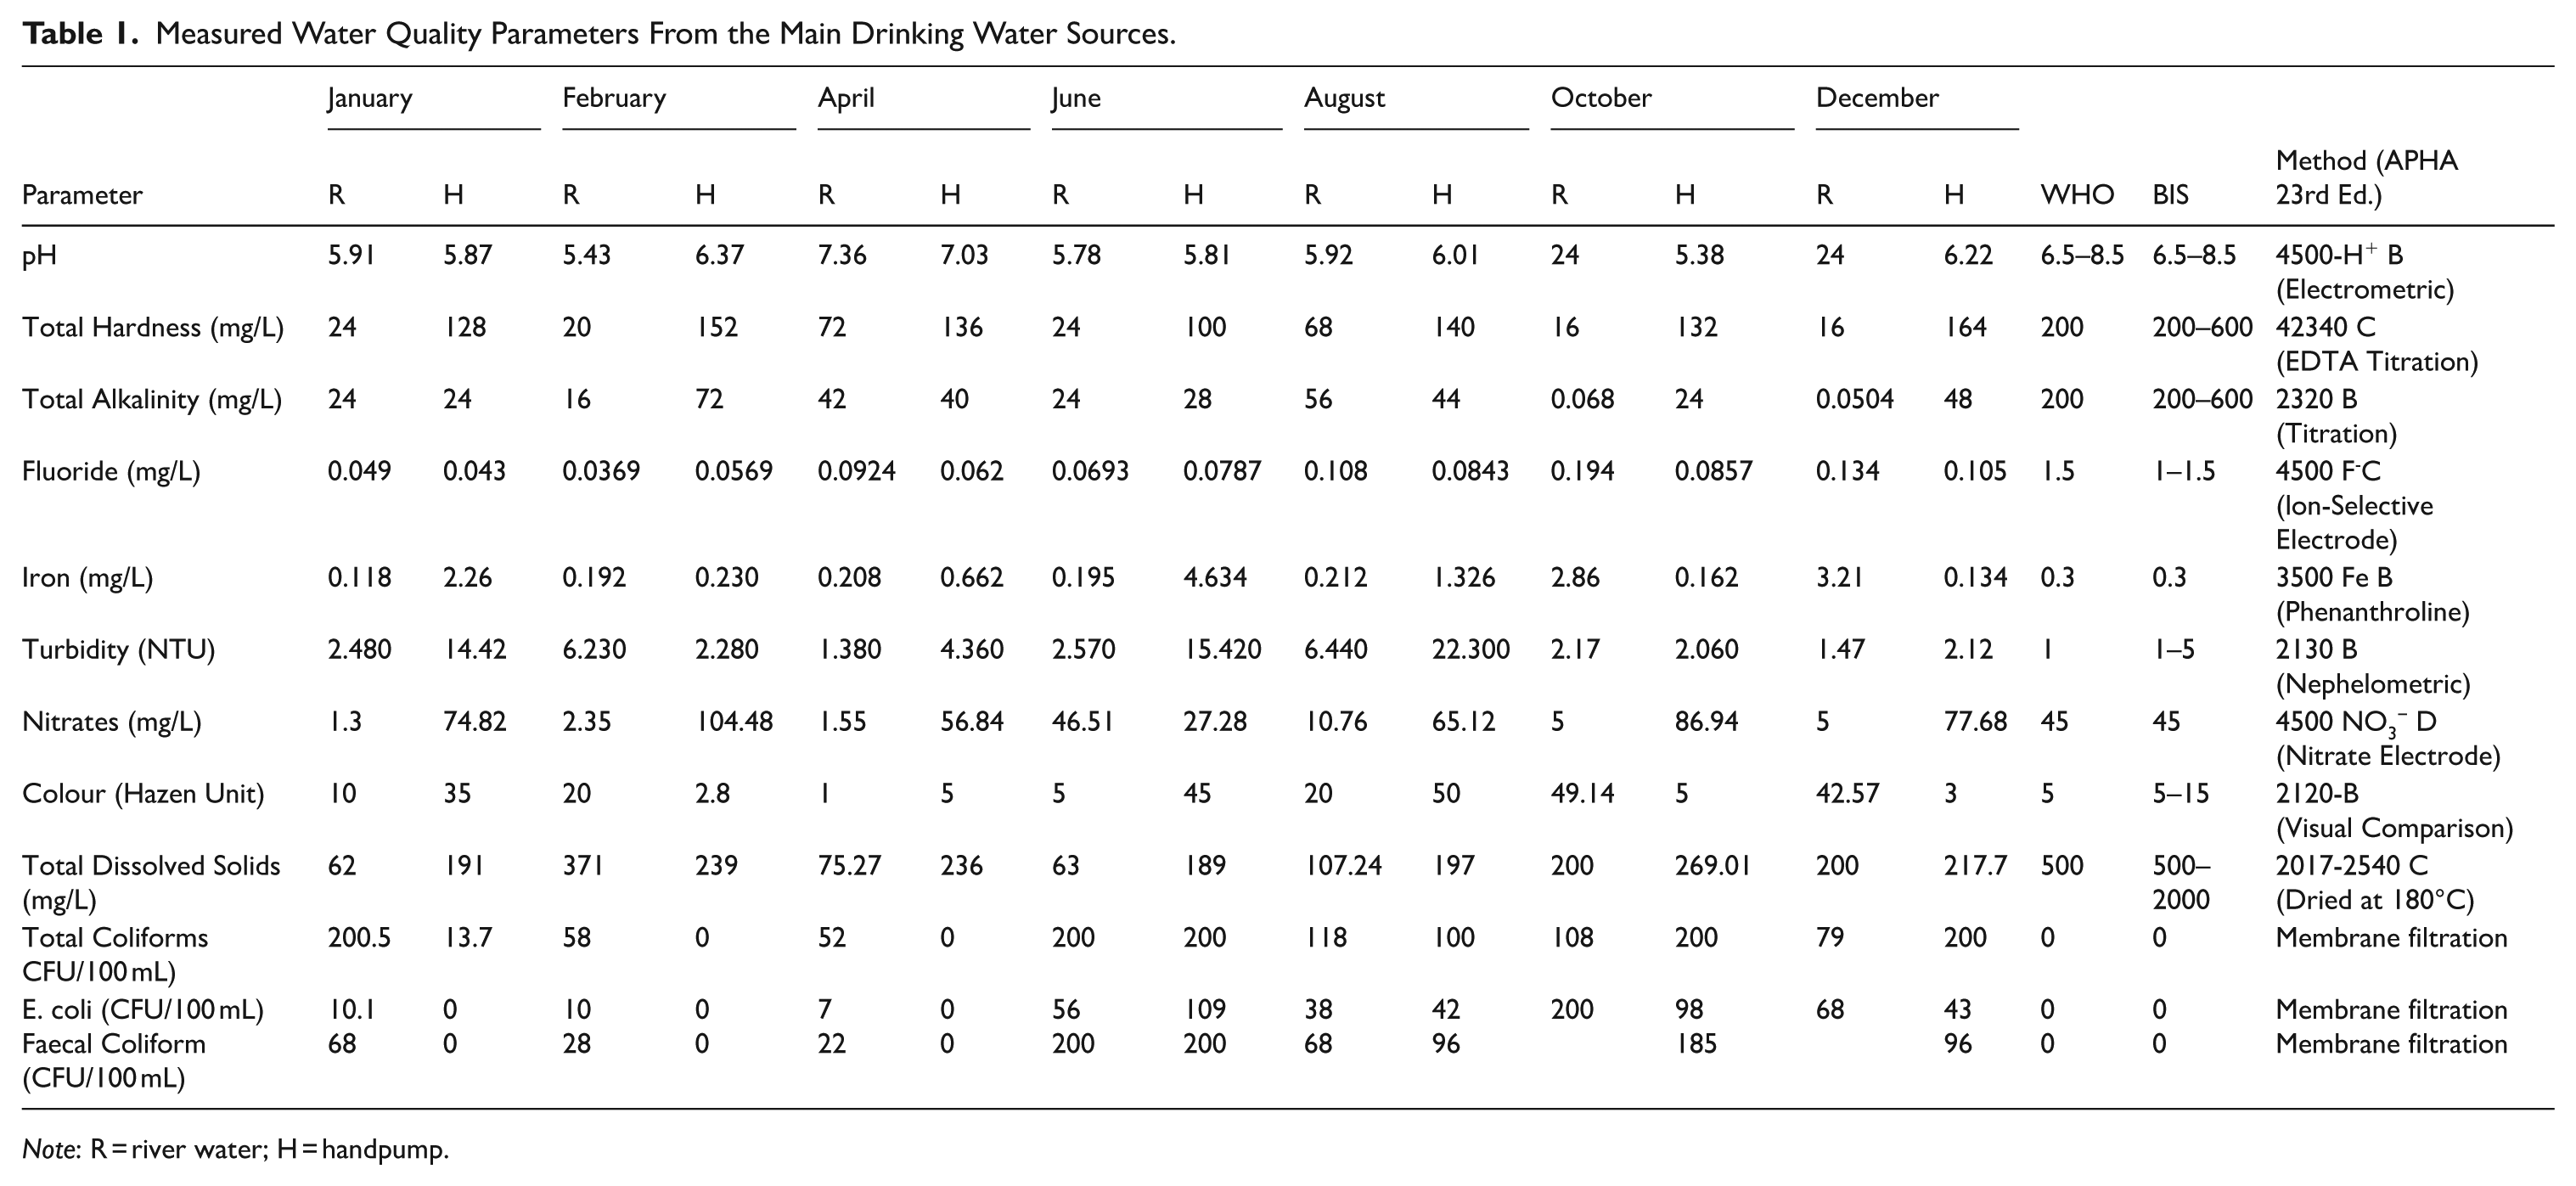
Note: R = river water; H = handpump.
Detailed Analysis of Critical Water Quality Parameters
In this section, we exclusively examined parameters that occasionally exceeded the recommended ranges regulated by WHO and BIS. These parameters are pH, turbidity, iron, and nitrates. We didn’t discuss the other parameters because they were always within the guidelines and less likely to harm the community.
pH
The river water pH ranged from 4.72 to 7.36 throughout different seasons, whereas handpump water exhibited pH values ranging from 5.38 to 7.03. According to Achary (2014), groundwater in Bhubaneswar showed a pH range of 5.8 to 7.4, indicating slightly acidic to neutral conditions. The pH readings reached their minimum levels during the monsoon season for both sources and were lower than the acceptable threshold established by WHO, suggesting that villagers are consuming acidic water. The region’s lateritic soils, which are naturally acidic (Achary, 2014) and have low buffering capacities (Khound & Bhattacharyya, 2018; Laluraj et al., 2006), could be responsible for the low pH in the river. In addition, the villagers heavily rely on paddy irrigation and use inorganic fertilizers. Agricultural runoff carrying nitrogenous fertilizers initiates nitrification processes that release hydrogen ions into the water, further reducing its pH (Camargo & Alonso, 2006). Acidic water can cause an imbalance in electrolytes, leading to conditions such as hyponatremia, hypokalemia, hypocalcemia, and hypomagnesemia (Rosborg et al., 2019). A study conducted by Stene et al. (2002) found that there is a correlation between the acidity level of drinking water and an increased risk of type 1 diabetes. The study revealed that tap water with a pH of 6.2 to 6.9 was related to a fourfold higher risk of diabetes compared to water with a pH of 7.7. Implementing a regular water quality monitoring programme and pH correction procedures, such as the injection of lime, can effectively ensure the maintenance of safe pH values.
Turbidity
The turbidity levels were markedly elevated during the monsoon season, with river water exhibiting a range of 1.38 to 6.44 NTU. During the monsoon season, high turbidity is a frequent problem caused by various factors, including the surface runoff that occurs after heavy rainfall. This runoff brings dirt, organic matter, and other particles into the water sources. Another study by Nayak et al. (2023) in Bhubaneswar reported even higher turbidity levels in certain areas, with values reaching up to 15 NTU in some groundwater samples. The handpump water had turbidity ranging from 2 to 22.30 NTU with high values during the monsoon. This could be due to infiltration of contaminated water through soil layers, as noted in other studies conducted during the monsoon (Gawle et al., 2021). In a study in Bhubaneswar, the average turbidity level in the groundwater was found to be 6.8 NTU, highlighting potential risks to public health (Das et al., 2018). A study in Nagla Chandi a marginalized Indian rural village, found the turbidity of 5.4 NTU in handpumps used for drinking purposes in the village (Kanyagui et al., 2024).
Iron
Iron is an essential element, but high levels can have adverse health effects, including liver damage, cardiovascular problems, and cancer (Jasmin & Mallikarjuna, 2014). Moreover, a significant concentration of iron can modify the taste and appearance of water. The river’s iron concentrations varied from 0.12 to 0.21 mg/L and constantly remained within the WHO guideline of 0.3 mg/L across all seasons. The iron concentration in the water from the handpump ranged from 0.13 to 4.63 mg/L, with an average of 1.34 mg/L. This average value surpassed the recommended limits specified by WHO. The larger area near Bhubaneswar, which is about 20 km from Barapita, is covered by lateritic soil (Achary, 2014), which is a source of iron in groundwater (Das et al., 2018). Dissolved organic matter and compost can reduce the conversion of Fe(II) to Fe(III), resulting in elevated concentrations of soluble iron in groundwater (Huang et al., 2010; Krupińska, 2017). Acidic conditions (low pH) enhance the solubility of iron minerals, further increasing iron levels (Krupińska, 2017). Galvanized iron components employed in handpumps are prone to corrode, especially in acidic groundwater, resulting in the leaching of iron particles into the water supply (Casey et al., 2016). A study in the same state found iron concentrations which ranged from 1 to 20 mg/L (Nayak et al., 2012) and in Khordha District the concentrations reached 4.6 mg/L (GoI, 2013).
Nitrates
The quantities of nitrates exhibited seasonal fluctuations, with elevated levels seen during the monsoon season, reaching a maximum of 46 mg/L in river water, indicating a significant influx of agricultural runoff into the river. Vaiphei and Kurakalva (2021) found that changes in nitrate levels in river water over time are influenced by nitrogen sources, mobilization, and transformation processes. A study in the same state recorded nitrate levels exceeding the WHO recommended values in about 34% of the samples (Naik et al., 2022). In the handpump the nitrate level reached a maximum of 104 mg/L during the winter. The use of nitrogen-rich fertilizers in nearby agricultural fields results in nitrates leaching into the groundwater system (Addisie, 2022). During heavy rainfall in the monsoon, nitrates are more readily transported into both surface water and groundwater due to increased infiltration and percolation (Vaiphei & Kurakalva, 2021). Rajkumar et al. (2024) found that in Telangana, India, nitrate levels in groundwater peaked during the monsoon due to agricultural runoff, similar to our findings of elevated nitrates in handpump water. Additionally, in winter, the decreased absorption of nitrates by plants and reduced microbial activity might lead to elevated levels of nitrates leaching into the groundwater (Vaiphei & Kurakalva, 2021). Nayak et al. (2023) found that nitrate levels in certain regions around Bhubaneswar exceeded the WHO recommended limit, with measurements peaking at 58.3 mg/L in some samples.
Analysis of Secondary Water Quality Parameters
The total hardness for both handpump water (100–164 mg/L) and river water (20–72 mg/L) was within acceptable ranges, indicating that hardness is not a significant issue affecting water quality in the village. Alkalinity levels varied from 24 to 72 mg/L in the handpump and 16 to 56 mg/L in the river. These are quite low and may result in restricted buffering capacity, thereby intensifying pH instability (Carstensen & Duarte, 2019). Fluoride levels in both sources were quite below the WHO maximum threshold of 1.5 mg/L, with ranges of 0.043 to 0.105 mg/L in handpump water and from 0.037 to 0.108 mg/L in the river, suggesting no imminent risk of fluorosis (Chen et al., 2013). Water colour readings raised a concern, especially for handpump water, which occasionally surpassed the recommended limit of 15 Hazen units (WHO, 2022), attaining levels as high as 45 units. Increased colour levels may indicate the existence of organic substances or colloidal particles (Meyn & Hallé, 2017), the presence of iron (Weyhenmeyer et al., 2014), and microbial proliferation (Zhang et al., 2014). Total dissolved solids (TDS) were quite low, with measurements between 189 and 269 mg/L in the handpump and 42 to 371 mg/L in the river, remaining below the palatability limit of 1,000 mg/L.
Correlation Matrix of Water Quality Parameters
Valuable information can be extracted from a correlation matrix since it gives the links between the water quality parameters, highlighting noteworthy interactions that need attention to ensure water safety. This section mainly focuses on a few correlations that had higher values (r < −0.7 or r > 0.7) and showed statistical significance at 0.1 or 0.05 significance level. However, we also included correlations within the same ranges that, although not statistically significant, still demonstrated strong relationships. Table 2 shows the correlations among the parameters for both the handpump and the river. An illustration to interpret Table 2 is given in the following example, which shows how to find the correlation between pH and fluoride in the river water and the handpump. To find the correlation between pH and fluoride for river water (the correlations are below the diagonal of ones), look for pH in the columns (the first column in this case) and search for fluoride in the rows (the fourth row in this case), and you get r = 0.536 at their intersection. On the other hand, to find the correlation between pH and fluoride for the handpump (the correlations are above the diagonal of ones), look for fluoride in the fourth column and pH in the first row; where they intersect is the correlation value, r = −0.25.
Correlations Among Parameters (Handpump Values Above the Diagonal and River Values Below the Diagonal).

Correlation is significant at 0.05 level two tailed.
Correlation is significant at 0.01 level two tailed.
River Water Correlations
Total alkalinity and fluoride showed a strong relationship (r = 0.767). Alkaline conditions in aquatic environments can increase the solubility of fluoride-containing minerals, resulting in a greater dissolution of fluoride into the water (Khan & Ravikumar, 2013). This is in agreement with a relationship that was also established by (Maitra et al., 2021). This association enables water treatment facilities to adopt targeted strategies, such as modifying pH levels or employing activated alumina filters, to diminish fluoride concentrations and guarantee the water’s safety for consumption (Mohapatra et al., 2004; Nawlakhe & Paramasivam, 1993). The substantial correlation (r = 0.861) between E. coli and faecal coliforms highlights the reliability of E. coli as an indication of faecal contamination (Edberg et al., 2000). This link is essential for water safety protocols, as monitoring E. coli levels facilitates the early identification of contaminated incidents. Water treatment systems can be immediately modified using disinfection techniques such as chlorination or ultraviolet (UV) irradiation to eradicate pathogenic bacteria (LeChevallier & Au, 2004). This association, as discussed by Shankar and Ponnusamy (2023), underscores the possible health hazards associated with faecal contamination if not properly controlled. While the correlation between water colour and turbidity in the river was high (r = 0.73), the relationship did not reach statistical significance. High turbidity levels can indicate the presence of suspended sediments, which are often correlated with increased contaminant concentrations (Rügner et al., 2013). This evidence suggests that increased particulate matter in water is often linked to discolouration. This link is crucial for water treatment and safety protocols, since elevated turbidity and colouration can disrupt disinfection procedures. Suspended particles can impede the efficacy of disinfectants, such as chlorine, thereby enabling the survival of hazardous microbes (LeChevallier et al., 1988). Consequently, water treatment plants must employ efficient filtration technologies to eliminate particle matter prior to disinfection, guaranteeing that the water is both potable and visually appealing. E. coli exhibited a negative correlation with total dissolved solids (r = −0.71) and pH (r = −0.75), although neither relationship was statistically significant. The presence of inorganic ions, a constituent of TDS, has been demonstrated to influence the photocatalytic inactivation of E. coli, indicating that elevated TDS levels may diminish E. coli viability (Rincón & Pulgarin, 2004). Laboratory studies have shown that a reduction in pH correlates with an increased die-off rate of E. coli, signifying an inverse link between pH and E. coli viability (Yee et al., 2005).
Handpump Correlations
The relationship between turbidity and colour is a positive correlation (r = 0.811), indicating that higher levels of particulate matter are frequently associated with discolouration (Zawawi et al., 2022). The presence of a high positive correlation (r = 0.805) between total hardness and total alkalinity suggests that both parameters are influenced by the same minerals, notably carbonate compounds like calcium and magnesium carbonates (Hem, 1970). Elevated hardness and alkalinity can result in scale accumulation in pipes, boilers, and other water fixtures, diminishing their efficiency and longevity (Sly et al., 1990). In water treatment, techniques such as lime softening or ion exchange may be required to diminish hardness and alkalinity, thereby reducing scaling problems and enhancing water quality for both home and industrial applications. Iron and turbidity showed a high positive correlation (r = 0.857) suggesting that higher levels of iron are a key factor in causing water turbidity. This is because iron precipitates can create suspended particles, which aligns with the findings of Maitra et al. (2021) and Singh et al. (2020). pH showed a strong correlation with total alkalinity (r = 0.721); however, the correlation was not statistically significant. Total alkalinity quantifies water’s ability to neutralize acids and is strongly associated with pH, both being affected by the carbonate system in aquatic environments (Boyd et al., 2011; Saalidong et al., 2022). Iron exhibited negative correlations with total hardness (r = −0.75) and nitrates (r = −0.71). In certain instances, iron may precipitate with ions that induce hardness, hence diminishing their concentration in water (Tahernezhad et al., 2016). Iron has been reported to significantly contribute to the decrease of nitrates in groundwater. Iron minerals can promote the reduction of nitrates via redox processes, with iron serving as a reducing agent that transforms nitrates into other nitrogen species, including ammonium (Shimada et al., 2021). Nitrates were positively correlated with dissolved solids (r = 0.71) but negatively correlated with colour (r = −0.72). In groundwater research, the association between nitrates and TDS is frequently significant, as both are affected by analogous sources, including agricultural runoff and soil leaching (A Khan et al., 2023). The strong positive connection between iron and turbidity (r = 0.86) suggests that increased iron concentrations substantially enhance water turbidity. The conversion of Fe(II) to Fe(III) results in the formation of hydrous ferric oxide, which is a precipitate that can increase water turbidity (van Beek et al., 2020). Elevated iron levels can promote the proliferation of iron bacteria, thereby obstructing pipes and compromising water quality (Sly et al., 1990). Water treatment protocols must incorporate iron removal techniques, including aeration followed by filtering or the application of oxidizing agents such as chlorine or potassium permanganate, to precipitate and eliminate iron from the water (Benjamin et al., 1996).
Hierarchical Cluster Analysis (HCA)
The HCA shown in Figure 6 for the handpump and river water in Barapita Village revealed distinct patterns of contamination driven by anthropogenic and geochemical factors. For the handpump, three clusters were identified: (1) microbial indicators (total coliforms, E. coli, and faecal coliforms), indicating contamination from inadequate sanitation practices and open defecation; (2) geochemical parameters (iron, colour, and turbidity), likely influenced by lateritic soils and poor handpump maintenance; and (3) ionic parameters (total hardness, alkalinity, pH, and TDS), reflecting natural mineral dissolution and buffering capacity. These clusters highlight the dual challenge of microbial and geochemical contamination in groundwater, with significant public health risks from waterborne pathogens.

Hierarchical cluster analysis for (a) Handpump and (b) River.
For the river, HCA also formed three clusters: (1) physical parameters (turbidity, colour, and TDS), reflecting surface runoff and erosion during monsoons; (2) geochemical parameters (total hardness, alkalinity, fluoride, pH, and iron), dominated by natural geological contributions; and (3) microbial and nutrient pollution (faecal coliforms, total coliforms, E. coli, and nitrates), indicative of agricultural runoff and poor sanitation. The results underscore the need for integrated water management strategies, including improved sanitation infrastructure, protection of water sources, and regular water quality monitoring to safeguard public health and address contamination in both sources effectively.
Water Quality Index (WQI)
The seasonal variations in water quality indices for the water sources are shown in Figure 7.

WQI variation during the study period.
River Seasonal Water Quality Variations
The WQI for the river revealed notable seasonal changes. During the pre-monsoon, the WQI was 54.47, indicating poor water quality. This value suggests relatively low pollution. In monsoon the WQI increased to 67.83, remaining in the same category as the pre-monsoon, with some level of contamination likely from surface runoff. The marked increase in WQI during the monsoon can be attributed to surface runoff, which introduces contaminants into the river (Barakat et al., 2018). This seasonal variation poses a significant health risk to the villagers, particularly during the monsoon when the water quality degrades to very poor levels. The villagers entirely depend on firewood for cooking purposes, and this results in deforestation, resulting in loss of vegetation cover, increasing soil erosion and sediment load in water bodies during rainfall events (DeVilleneuve et al., 2023). Post-monsoon experienced a lower WQI of 54.96 compared to monsoon, but in the same category. Post-monsoon dilution and natural filtration processes likely contribute to this improvement. During winter the WQI decreased to 52.89, suggesting improvement in natural purification and lower levels of contaminants compared to other seasons. These variations highlight the influence of seasonal changes on water quality, with monsoon seasons typically bringing higher levels of contamination due to surface runoff and subsequent dilution effects in post-monsoon seasons. Akter et al. (2016) found that river water can maintain relatively good quality even during adverse weather conditions, though it requires consistent monitoring and management. A study in the neighbouring state of Bihar also identified seasonal variations in river water quality, showing that there is a challenge in maintaining consistent water quality throughout the year in this region (Zafar, et al., 2024).
Handpump Seasonal Water Quality Variations
The handpump WQI showed significant seasonal variations. Notably, the WQI was high in January, June, and August due to high levels of iron during these months. The pre-monsoon period had a WQI of 171.2, showing that the water was unsuitable for drinking. However, the WQI dramatically increased to 789.01 during the monsoon, indicating that the water was still unsuitable for drinking. The substantial rise in contaminants is likely due to the agrochemical pollutants and faecal contaminants in the surface runoff infiltrating the groundwater. There was an improvement during the postmonsoon, with the WQI value of 50.43. This improvement may be due to the dilution effect of rainwater infiltrating and purifying the groundwater. Mohammed and Abdulrazzaq (2018) also reported similar seasonal variations in WQI in their study on drinking water quality. The pre-monsoon and post-monsoon experienced better water quality, indicating reduced pollutant infiltration. This evidence suggests that interventions during monsoon seasons, such as improved drainage and protective measures around water sources, could mitigate contamination levels.
Sensitivity Analysis of WQI
The sensitivity analysis evaluated the impact of individual parameter removal on the WQI for the handpump and river as shown in Figure 8. A correlation analysis of the WQIs recalculated after the removal of each parameter revealed that all modified WQIs were perfectly and significantly correlated with the original WQI (r = 1.00, p = .00) at the 0.01 significance level, except when iron was excluded. When iron was removed, the correlation between the modified WQI and the original WQI decreased slightly but remained statistically significant (r = .985, p < .05) at the .05 significance level. This indicates that while all other parameters had a negligible impact on the correlation with the original WQI, iron played a more substantial role in influencing the index. Iron had the most significant influence across all seasons. Its removal in winter reduced the WQI by 67%, altering the water categorization from “not suitable for drinking” to “very poor.” During the monsoon, iron’s removal caused an even larger reduction of 70.84%. This dominance is likely attributed to the high concentration of iron in the groundwater, a characteristic of the lateritic soils in the region (Das et al., 2018). The significant influence of iron underscores its critical role in categorizing water quality and the urgent need for iron remediation technologies. In contrast, parameters like colour and fluoride had minimal impacts, with changes in WQI ranging from a 0.74% decrease (colour) to a 16% increase (fluoride). Post-monsoon, the dominance of iron decreased slightly, with its removal reducing the WQI by 19.37%, while fluoride showed a notable 15.22% increase.

Sensitivity analysis of WQI for (a) Handpump and (b) River.
For the river water, a correlation analysis of the WQIs recalculated after the removal of each parameter demonstrated that the modified WQIs remained significantly correlated with the original WQI (p < .05) when any parameter except iron was excluded. However, when iron was removed, the recalculated WQI did not show a significant correlation with any of the other WQIs. This lack of significant correlation indicates that iron has a substantial and unique impact on the WQI of the river water, emphasizing its dominant role in influencing water quality in this context. Colour and iron were significant contributors to WQI variation in winter, with colour causing a 15.68% decrease and iron resulting in an 18.37% increase when removed. This indicates a seasonal variability in the aesthetic parameters of water, likely tied to fluctuating turbidity and organic matter during surface runoff events (Vega et al., 1998). During pre-monsoon, the removal of most parameters increased the WQI except for iron, which caused a 26.76% decrease. In monsoon, fluoride removal had the greatest impact, increasing the WQI by 15.66%, while colour removal reduced it by 12.34%. These results underscore the critical role of iron in driving WQI variation for the handpump and highlight seasonal dynamics in parameter influence for the river, emphasizing the need for targeted mitigation efforts focusing on iron and seasonal parameters like fluoride and colour.
Targeted Parameter-Specific Strategies to Improve WQI
To enhance the WQI to acceptable levels, we implemented a targeted parameter adjustment strategy (Table 3) focusing on parameters exceeding their WHO permissible limits (PL) across different seasons. For the river water, during the winter season, only colour and pH exceeded the PLs, with colour contributing more significantly to the elevated WQI. By reducing the colour to within its PL, the WQI improved from the “Poor” to “Good” category. In the pre-monsoon season, although all parameters were within their PLs, iron—despite being below the PL—was adjusted to 50% of its PL due to its substantial impact on the WQI, resulting in a decrease in WQI from 54.47 to 40.31, thereby achieving an acceptable WQI. During the monsoon season, adjustments to colour and pH alone were insufficient to lower the WQI below the threshold; consequently, iron was reduced to 50% of its PL, decreasing the WQI to 41.80. In the post-monsoon season, adjusting pH had a minimal effect on the WQI; thus, iron was reduced to 50% of its PL, lowering the WQI from 54.98 to 44.24.
WQI Improvement Strategies and Categorization (categorization adopted from Dutt and Sharma, 2022).

For the handpump water, multiple parameters exceeded the PL during the winter season, with iron being the primary contributor. Reducing iron concentration to 40% of its PL resulted in a significant decrease in WQI from 243.15 to 49.94, bringing it into the acceptable range. In the pre-monsoon season, adjusting iron to 50% of its PL decreased the WQI from 171.21 to 46.23. During the monsoon season, despite reducing iron to its ideal value, the WQI remained above acceptable levels until colour was adjusted to the PL, resulting in a WQI of 38.89. In the post-monsoon season, targeting nitrates by adjusting their concentration to the PL reduced the WQI from 50.43 to 49.97.
These results demonstrate that prioritizing and adjusting key contaminants—particularly iron, followed by colour, pH, and nitrates—effectively improved the WQI of both river and handpump water sources across all seasons. This targeted approach underscores the efficacy of focusing on parameters with the greatest impact on overall water quality to achieve standards suitable for drinking, which is critical for safeguarding public health in marginalized rural communities.
Biological Seasonal Water Quality Variation
The existence of E. coli poses significant health risks, including outbreaks of waterborne diseases such as diarrhoea, cholera, and other gastrointestinal illnesses. The biological variation in water quality of the two sources is shown in Figure 9.

Biological water quality variation for the river and the handpump.
In the river, the E. coli concentrations were lowest during the pre-monsoon season at 7 CFU/100 mL and highest post-monsoon at 108 CFU/100 mL. The winter season experienced moderate contamination with 33 CFU/100 mL, while the monsoon season recorded 47 CFU/100 mL. The consistently higher E. coli levels in the river during the monsoon and post-monsoon suggest that runoff from surrounding areas, including settlements, contributes significantly to contamination. This emphasizes the need for effective watershed management and pollution control measures to protect river water quality. The close proximity of latrines, open defecation sites, and animal husbandry areas to water sources increases the risk of microbial contamination (Mochware et al., 2024). Anderson et al. (2021) demonstrated that promoting safe water storage practices significantly reduced microbial contamination in rural households.
Table 4 shows the suitability for drinking of the water sources based on biological assessment and the overall suitability considering both biological and physico-chemical parameters.
River and Handpump Biological Water Quality.

Note: NS = not suitable for drinking; S = suitable for drinking.
Similarly, the handpump water showed an average of 0 CFU/100 mL E. coli concentrations in the pre-monsoon season, suggesting minimal contamination, but experiences a sharp increase during monsoon and post-monsoon, with averages of 76 CFU/100 mL and 98 CFU/100 mL, respectively. The winter season for the handpump recorded an average of 14 CFU/100 mL. During the monsoon, the elevated precipitation results in water seeping through the soil, transporting faecal matter and other contaminants into the groundwater. Hansen et al. (2020) found comparable patterns, indicating elevated levels of E. coli during the rainy season because of heightened surface runoff and the leaching of pollutants into water sources. Moreover, handpumps frequently lacking proper maintenance or protection serve as reservoirs for microbial contamination (Hansen et al., 2020). In numerous rural regions, the prevalent practice of open defecation and inadequate waste disposal results in the pollution of groundwater sources, particularly during periods of high rainfall (Hansen et al., 2020).
Potential Contamination Control Measures
Implementing a Community-Led Total Sanitation (CLTS) programme and conducting hygiene education can reduce open defecation and can result in a decrease in microbial contamination of drinking water sources (Asantewaa-Tannor et al., 2025). Introducing proper waste disposal methods can prevent contaminants from reaching water sources. Ensuring that handpumps are regularly inspected and maintained can reduce contamination from corroded parts and mechanical failures. Promoting affordable and accessible treatment methods like boiling, solar disinfection, or the use of ceramic filters can reduce microbial contamination at the household level (Sobsey et al., 2008). Educating farmers on the cautious use of fertilizers and encouraging organic farming practices can reduce nitrate leaching into groundwater (Sutton et al., 2011). Raising awareness about the health risks associated with contaminated water and promoting safe water practices can empower the community to take proactive measures (Addisie, 2022). Involving local residents in water quality monitoring using portable kits and the establishment of community-based monitoring programmes can enhance ownership and ensure timely identification of contamination issues (Ramesh et al., 2024).
Socio-Economic Implications of Water Contamination
The reliance on contaminated water sources for drinking and household use directly impacts the health of villagers, leading to increased incidences of waterborne diseases such as diarrhoea, cholera, and typhoid fever (Lin et al., 2022). These health issues disproportionately affect children and the elderly, contributing to higher morbidity and mortality rates (Prüss-Ustün et al., 2019). The lack of access to safe water exacerbates poverty cycles, as ill health reduces productivity and earning potential (García-López et al., 2024) and diverts the limited available resources from essential needs such as education and food to healthcare. Children suffering from waterborne diseases often miss school, leading to poor academic performance and higher dropout rates (Ahmed et al., 2022). The burden of fetching water typically falls on women and girls, consuming substantial amounts of time and energy that could be invested in education or income-generating activities (Geere & Hunter, 2020). Water scarcity and contamination can exacerbate gender inequalities by reinforcing traditional gender roles and limiting women’s participation in social and economic spheres (Akpabio et al., 2024). High levels of nitrates and microbial contamination can degrade soil quality and crop yields, impacting food security and livelihoods (Schmoll, 2006). Reduced agricultural productivity leads to lower household incomes and increased vulnerability to market fluctuations and environmental shocks. The stress associated with water scarcity and health problems can strain social relations within the community. Competition for clean water resources may lead to conflicts, undermining social cohesion and the collective capacity to address common challenges (Bisung & Elliott, 2014).
Limitations
While our bi-monthly sampling captured the essential seasonal variations across the four main seasons in India, we recognize that higher frequency sampling could offer more detailed insights into short-term fluctuations in water quality. Future studies are encouraged to employ more frequent sampling intervals to enhance the understanding of temporal dynamics in water quality parameters. The other limitation is that our strategy framework assumes that adjusting one parameter will have a direct and isolated impact on the WQI. In reality, water quality parameters can interact in complex ways. Another limitation to the current study is that the WQI calculated did not include microbial water contaminants; it only incorporated physicochemical parameters. A water quality index that incorporates both physicochemical and microbial contaminants could have given a comprehensive analysis of the WQI variation in the village.
Recommendations
In Barapita, improvements to the water supply infrastructure are essential. We recommend timely repairing and maintaining of existing water supply systems to ensure a continuous and safe water supply in the village. For example, professionalized maintenance was shown to increase handpump functionality in the Central African Republic (Fink et al., 2022), and a similar approach could be adopted in Barapita to enhance the reliability of its water sources.
The implementation of an advanced filtration system such as the Jivamritam in the village is also important, especially during the monsoon season when there are high contamination risks. In rural Nepal, biosand filters effectively removed iron and microbial contaminants from drinking water, significantly reducing waterborne diseases (Ngai et al., 2007). Barapita could benefit from such technology to address its specific issues with high iron levels and microbial contamination.
Regular water quality assessments of drinking water sources are important for early detection and prompt remediation of contamination. However, this initiative is lacking in Bararpita. A Learning Innovation Platform (LIP) implemented in Thailand across 13 communities showed significant health improvements and enhanced local capacity in water quality monitoring (Maneeprakorn et al., 2024). Adapting a similar monitoring framework in Barapita could empower the villagers to manage water quality effectively and efficiently.
In Barapita, all the drinking water sources are not protected. Protective measures around water sources should be enforced to reduce contamination risks. For example, the Sulabh Sanitation Movement in India improved rural sanitation by constructing affordable twin-pit pour-flush toilets and promoting proper waste disposal, which resulted in a marked reduction in water source contamination (Pathak, 2011). Applying this model in Barapita—through better waste management and improved sanitation facilities—could significantly decrease the entry of contaminants into local water supplies.
Community awareness and education programmes must also be prioritized in Barapita. Effective awareness campaigns that emphasize the seasonal variations in water quality and the associated health risks are crucial, particularly during the monsoon season. In tribal areas of Pakistan, targeted awareness campaigns led to a 11% increase in water purification practices (Cyan & Kasim, 2023). By implementing similar initiatives, Barapita residents can be better informed about the health hazards of unsafe water and the importance of proper hygiene and sanitation.
Conclusion
This study highlights the urgency of improving access to safe drinking water in Barapita village, where high iron and nitrate concentrations, low pH, and significant microbial contamination detected in the drinking water sources in the village pose health risks to the villagers. By assessing seasonal water quality through a WQI and integrating techniques like sensitivity analysis and HCA, the research shows how contamination levels fluctuate with rainfall patterns, agricultural runoff, and inadequate sanitation infrastructure. Notably, iron emerged as the most impactful parameter, especially in the handpump, while microbial contamination remained a year-round concern for both sources.
The TPAS proved effective in sequentially reducing WQI to acceptable levels by focusing on high-impact contaminants first—a critical insight for resource-constrained rural environments. Low-cost interventions to reduce iron, disinfect microbial contaminants, and stabilize pH can substantially improve water quality. Equally important are community education and engagement measures, which ensure local stakeholders remain aware of safe water handling practices and the seasonal dynamics of contamination. Strengthening sanitation, protecting source areas from runoff, and establishing a village water management committee would further support long-term sustainability. Ultimately, this research not only guides context-specific solutions for Barapita but also offers a model for marginalized communities worldwide, showcasing the value of combining robust water-quality assessments with tailored, community-driven interventions.
The Jivamritam water treatment system installed in the village by Amrita University is a major part of the solution to the water quality issues in the village. However, this study has shown that the system needs to be augmented with a module to reduce iron and correct pH to meet the BIS and WHO guidelines. The authors are conducting laboratory studies to develop such a module. Additionally, a logistical plan for the maintenance and provision of spare parts for the Jivamritam water treatment system is also necessary to reduce its downtime and enhance its efficiency. Another important part of the strategy is community education about water quality, water treatment, sanitation, and hygiene. These are planned and training material for them is being developed. A village water committee is also being set up to provide an institutional framework for water management in the village. The members of the committee will be trained in basic financial management and leadership skills. Additionally, there are plans to protect drinking water sources from contamination through surface runoff by planting vegetation, such as shrubs around them. All the plans outlined in this section are earmarked for implementation in Barapita Village in June or July 2025.
Footnotes
Acknowledgements
This project was funded by the E4LIFE International Ph.D. Fellowship Programme offered by Amrita Vishwa Vidyapeetham. We extend our gratitude to the Amrita Live-in-Labs® academic programme for providing all the support.
Ethical Considerations
The protocol was reviewed and approved by Amrita Vishwa Vidyapeetham Institutional Human Ethics Committee.
Author Contributions
P.D. was responsible for collecting the data, performing the initial analysis, and drafting the manuscript, including the interpretation of findings and preparation of tables and figures. N.K. and K.N. provided critical revisions to the manuscript, ensuring the scientific accuracy and clarity of the content. Both N.K. and K.N. contributed to refining the methodology, contextualizing the findings within the broader literature, and improving the overall structure and flow of the manuscript. All authors reviewed and approved the final version of the manuscript prior to submission.
Funding
The author(s) disclosed receipt of the following financial support for the research, authorship, and/or publication of this article: This project was funded by the E4LIFE International Ph.D. Fellowship Program offered by Amrita Vishwa Vidyapeetham.
Declaration of Conflicting Interests
The author(s) declared no potential conflicts of interest with respect to the research, authorship, and/or publication of this article.
Data Availability Statement
Data can be made available through the authors upon request.