
Abstract
The Gomti River, a vital water source for Lucknow, India, faces escalating pollution challenges due to urbanization, industrial discharge, and agricultural runoff. This study aims to assess its water quality using a water quality index (WQI) and advanced statistical methods, addressing knowledge gaps in understanding pollution dynamics in this urban river. Systematic sampling and analysis of physicochemical parameters, including pH, TDS, turbidity, ions, and organic pollutants, were conducted. Results revealed neutral pH (average = 7.55), permissible TDS (323.95 ppm), and moderate turbidity (16 NTU), while hardness (136 ppm), alkalinity (57 ppm), and ammonia (0.39 ppm) indicated localized contamination. Dissolved oxygen (DO) was critically low (0.9 ppm), with high BOD (30.7 ppm) and COD (75.7 ppm), reflecting significant organic pollution. PCA and cluster analysis identified primary pollution sources, highlighting untreated sewage and industrial effluents. These findings emphasize the urgent need for targeted interventions, such as wastewater treatment and stricter discharge regulations, to ensure the river’s sustainability. The study underscores the importance of integrating WQI with statistical methods for comprehensive water quality assessment, offering critical insights for policymakers and aligning with sustainable development goals (SDGs) related to clean water and environmental conservation.
Keywords
Introduction
Rivers are fundamental to supporting human populations and ecosystems, serving as critical sources of water for drinking, agriculture, industry, and biodiversity (Santy et al., 2020; Saqib et al., 2023). However, the rapid expansion of urbanization, industrialization, and agricultural activities has led to a global decline in river water quality, posing significant risks to both human and environmental health (Chabuk et al., 2023). The Gomti River, a tributary of the Ganga River in Uttar Pradesh, India, holds immense ecological and socio-economic importance, particularly for the city of Lucknow. Despite this, the Gomti faces severe pollution challenges, driven primarily by untreated sewage, industrial effluents, and agricultural runoff. These issues are exacerbated during periods of low flow, severely affecting the river’s capacity to sustain aquatic life and provide clean water (Chan Kujiek & Sahile, 2024).
Monitoring river water quality is essential for evaluating its suitability for various uses and for guiding sustainable management practices. Physicochemical parameters such as pH, total dissolved solids (TDS), turbidity, hardness, and concentrations of ions and heavy metals are key indicators of water quality. These parameters reflect the influence of natural processes and anthropogenic activities, directly impacting aquatic ecosystems and human health (Chidiac et al., 2023; WHO, 2008). Globally, the water quality index (WQI) has been widely used to simplify complex water quality data into a single, interpretable value, making it an accessible tool for decision-making by policymakers and the public (Santy et al., 2020; Nayak et al., 2024). Applications of WQI include notable studies on rivers such as the Yamuna in India, the Huangpu in China, and others across Europe and the Middle East (Pimparkar et al., 2023; Saqib et al., 2023).
Recent advancements in water quality assessments have highlighted the integration of advanced statistical methods, such as principal component analysis (PCA) and cluster analysis, with WQI. These methods enhance the understanding of pollution dynamics by identifying sources, uncovering trends, and interpreting relationships among water quality parameters (Jigyasu et al., 2020; Pimparkar et al., 2023). While global studies have successfully implemented these techniques to address water quality challenges, there is a lack of similar research focusing on urban rivers in India. Specifically, limited efforts have been made to apply these integrated approaches to the Gomti River, underscoring a critical knowledge gap in the field.
This study addresses these gaps by conducting a comprehensive assessment of the Gomti River’s water quality through the combined use of WQI, PCA, and cluster analysis. Systematic sampling across multiple locations along the river ensures the representativeness of the data, while advanced statistical techniques allow for a deeper interpretation of water quality dynamics. The findings provide actionable insights for sustainable water resource management and contribute to global efforts to achieve sustainable development goals (SDG 6: Clean Water and Sanitation, and SDG 15: Life on Land).
Objectives
This study’s objectives are: (1) to assess the water quality of the Gomti River through analysis of key physicochemical parameters; (2) to calculate the to evaluate the pollution level; (3) to apply PCA and cluster analysis to interpret relationships among parameters and identify pollution sources; and (4) to provide insights for water quality management in urbanized river basins.
By employing systematic sampling and advanced statistical analyses, this study offers a robust understanding of pollution dynamics in the Gomti River. These findings contribute to global research on urban river pollution by demonstrating the effectiveness of integrating WQI with statistical methods. Furthermore, the study identifies key areas for targeted interventions to restore the ecological and socio-economic value of this critical water resource. Next sections of the paper provide detailed literature review, study area, materials and methods, results and discussion, and conclusions of the study.
Literature Review
Global Studies on Water Quality Assessment
The decline in water quality due to pollution is a worldwide concern, with rivers across the globe experiencing significant deterioration in physicochemical and biological parameters (Santy et al., 2020). Global assessments, such as those on the Huangpu River in China and rivers across Europe, have demonstrated the effectiveness of integrating the WQI with advanced statistical methods like PCA and cluster analysis (Kujiek & Sahile, 2024). These techniques have proven instrumental in identifying pollution sources and understanding spatial and temporal trends in river systems, providing actionable insights for water resource management in urbanized areas (Pimparkar et al., 2023; Saqib et al., 2023).
Indian Context of River Pollution
In India, rivers such as the Yamuna, Ganga, and others have been extensively studied due to their ecological and cultural importance. However, these rivers have shown alarming levels of pollution driven by urbanization, industrial discharge, and agricultural runoff (Chidiac et al., 2023; WHO, 2008). Traditional WQI applications have been effective in summarizing water quality data but often fall short in providing a detailed understanding of pollution dynamics (Nayak et al., 2024). Despite its significance, the Gomti River has received limited attention in terms of integrated analyses that combine WQI with advanced statistical tools. Existing studies have largely focused on physicochemical assessments, leaving a critical gap in understanding the river’s pollution dynamics holistically (Paul, 2017). By addressing this gap, this study aims to contribute valuable insights into sustainable river management.
Relevance of WQI
The WQI is a widely recognized tool that simplifies complex water quality data by aggregating multiple parameters into a single numerical value (Kujiek & Sahile, 2024). This index provides an intuitive representation of water quality, making it an essential tool for decision-makers and stakeholders (Paul, 2017). Globally, WQI has been applied to evaluate rivers in diverse regions, including Europe, the Middle East, and Asia. It serves as a standardized method for comparing water quality across different settings, facilitating policy formulation and public awareness (Kujiek & Sahile, 2024).
Integration of Statistical Methods in Water Quality Studies
Recent advancements in water quality studies emphasize the use of statistical techniques such as PCA and cluster analysis (Chidiac et al., 2023). PCA simplifies complex datasets by identifying the most influential parameters, allowing researchers to focus on key drivers of pollution. Cluster analysis, on the other hand, groups similar sampling sites to reveal spatial pollution patterns, aiding targeted interventions (Jigyasu et al., 2020). These methods have been successfully applied in various urban river systems, as demonstrated in studies by Chabuk et al. (2023) and Pimparkar et al. (2023), which highlight their potential for improving water quality assessments and management strategies.
Research Gap and Novelty
While global studies have demonstrated the value of integrating WQI with advanced statistical methods, such applications remain underutilized in India, particularly for urban rivers like the Gomti. Most existing studies on the Gomti have focused narrowly on physicochemical analyses without leveraging advanced statistical techniques to uncover deeper insights into pollution sources and trends. This study fills this critical gap by employing an integrated approach that combines WQI, PCA, and cluster analysis to evaluate the Gomti River’s water quality comprehensively. By addressing this gap, the study contributes a novel framework for assessing urban rivers and provides actionable insights for policymakers and water resource managers.
Study Area
The study is for this study is presented through Figures 1 and 2. The Gomti River, a significant tributary of the Ganga River, originates from Gomat Taal (Fulhar Lake) in Pilibhit district, Uttar Pradesh, India, and flows for approximately 900 km before merging with the Ganga at Saidpur (Khan et al., 2020). This study focuses on the river stretch in Lucknow (26.8467°N, 80.9462°E), the capital city of Uttar Pradesh. Covering an area of 2,528 km2 and situated at an elevation of 123 m above sea level, Lucknow heavily relies on the Gomti River for drinking water, irrigation, and ecological functions (Mishra & Tandon, 2020). The city experiences a humid subtropical climate, characterized by distinct seasons: hot summers (temperatures exceeding 40°C), mild winters (dropping to as low as 4°C), and an annual average rainfall of 896 mm, primarily concentrated during the monsoon season (July to September; IMD, 2021). These climatic factors, combined with seasonal flow variations, significantly impact the river’s hydrology and water quality. The Gomti is predominantly a groundwater-fed river, which maintains its perennial nature, but reduced flow during summer months exacerbates pollution levels (Khan et al., 2022). The geomorphology of the river basin is characterized by alluvial soils, contributing to its sediment load and influencing the river’s hydrochemical properties (Khan et al., 2021). The gentle slopes and meandering channels of the Gomti affect sedimentation patterns and pollutant dispersion. Urbanization in Lucknow has severely degraded riparian vegetation, reducing the natural filtration capacity and biodiversity along the riverbanks (Kumar et al., 2017). The river suffers from significant pollution, with untreated sewage accounting for approximately 80% of the wastewater discharged from Lucknow, in addition to industrial effluents and agricultural runoff (Mishra & Tandon, 2020). These inputs contribute to elevated BOD (30.7 ppm) and COD (75.7 ppm) levels and low dissolved oxygen (DO, 0.9 ppm), which are insufficient to support healthy aquatic life. High turbidity, elevated total dissolved solids (TDS), and other pollutants further degrade water quality (Kushwah et al., 2023). Despite its deteriorating condition, the Gomti River remains critical for its ecological, agricultural, and domestic utility. Addressing these challenges requires urgent interventions, including the establishment of wastewater treatment plants, regulation of industrial discharges, and promotion of sustainable agricultural practices (Mishra & Tandon, 2020). These actions align with SDGs related to clean water and environmental conservation, highlighting the need for integrated river basin management to restore the health and sustainability of this vital water resource.
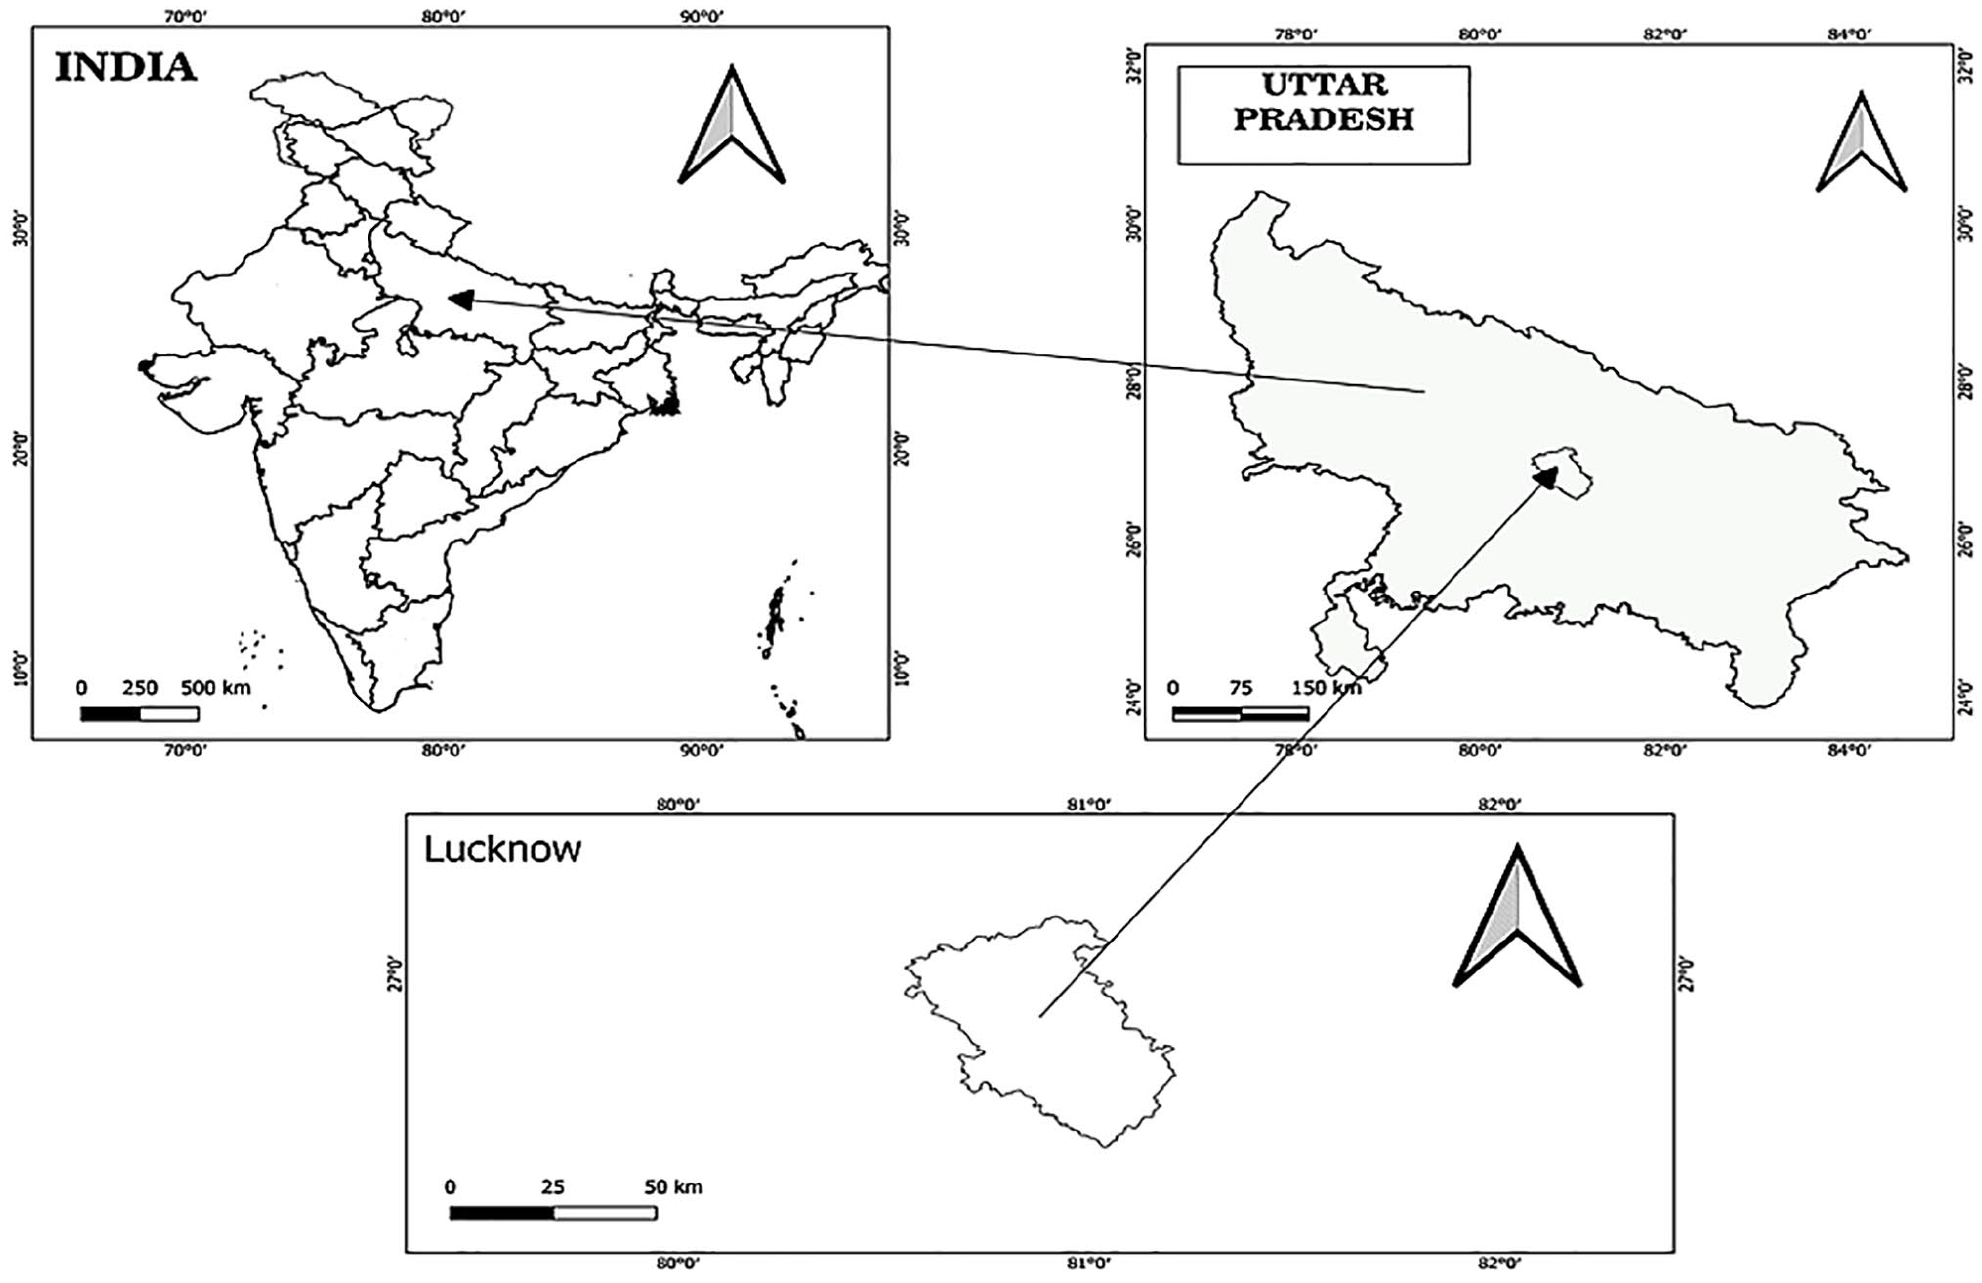
Study area Lucknow.

Gomti river stretch area.
Materials and Methods
Sampling and Collection
Surface water samples were systematically collected from twenty locations along the Gomti River in Lucknow during July 2023 (see Supplemental Table 1 and Figure 3). These locations were strategically selected to represent upstream, midstream, and downstream sections of the river, as well as areas near potential pollution sources such as urban settlements, industrial discharge points, and agricultural runoff zones. The sampling was conducted using a grab sampler to ensure representative and uncontaminated water samples. To prevent contamination, all equipment, including sampling bottles and grab samplers, was thoroughly cleaned with deionized water before use. At each location, multiple samples were collected to account for spatial variability, and all samples were stored in pre-labeled high-density polyethylene (HDPE) bottles with minimal headspace to limit air exposure. Preservatives, such as nitric acid (HNO3) for heavy metal analysis and sodium thiosulfate for chlorine-containing samples, were added to prevent chemical changes during storage. Sampling was conducted at two different times of the day–morning (7–9 AM) and evening (5–7 PM)—to capture variations in dissolved oxygen (DO), biochemical oxygen demand (BOD), and other parameters influenced by diurnal changes. Samples were collected from a depth of 0.3–0.5 m below the water surface to avoid contamination from floating debris and atmospheric interactions. Quality control measures included triplicate sampling, field blanks, duplicate samples, and calibration of all instruments before each sampling session, ensuring high accuracy and reliability in water quality assessment.

Locating the sampling sites on the Lucknow district.
Field Measurements
Field measurements were conducted at the time of sample collection to ensure the immediate recording of key water quality parameters. Portable instruments were used to measure electrical conductivity (EC) and pH, providing on-site assessments of the water’s ionic strength and acidity/alkalinity. Additional parameters such as temperature, turbidity, and dissolved oxygen (DO) were measured using handheld multiparameter probes to capture real-time variations. These field measurements were crucial in complementing laboratory analyses by providing baseline data on physicochemical conditions at the time of sampling. The real-time assessment of DO, BOD, and temperature fluctuations helped in understanding their impact on river health and pollution levels, particularly near high-impact zones such as urban and industrial areas.
Laboratory Analysis
In the laboratory, the collected water samples underwent detailed physicochemical analysis to determine their chemical composition and contamination levels. Analytical procedures followed American Public Health Association (1998) standard guidelines, with each sample analyzed in triplicate to ensure precision and reliability. Major anions such as fluoride (F–), chloride (Cl–), nitrate (NO3–), and sulfate (SO4²–) were measured using a Lovibond UV-Visible Spectrophotometer, while cation concentrations of magnesium (Mg²+), sodium (Na+), potassium (K+), and calcium (Ca²+) were quantified using a flame atomic absorption spectrophotometer (VARIAN-AA280 FS). Nutrient parameters including ammonia (NH3), phosphate (PO4³–), and nitrite (NO2–) were analyzed using spectrophotometric methods. Dissolved oxygen (DO), biochemical oxygen demand (BOD), and chemical oxygen demand (COD) were measured using Winkler’s method and closed reflux titration techniques. Equipment was recalibrated every ten samples to maintain accuracy, and strict sample storage conditions were maintained, such as refrigeration at 4°C for BOD and COD analysis. Quality control measures, including blanks, duplicates, and spiked recovery samples, were used to validate the results and minimize analytical errors.
Data Visualization
Visualization tools were employed to analyze and interpret the collected data effectively, ensuring a comprehensive understanding of trends, spatial patterns, and pollution hotspots. Origin software was used to create graphical representations, including time series plots, scatter plots, histograms, and contour plots. These visualizations provided insights into fluctuations in key water quality indicators such as turbidity, dissolved oxygen, pH, and pollutant concentrations. Additionally, contour mapping helped identify pollution gradients along the river, pinpointing high-risk zones for targeted interventions. The use of visualization techniques not only facilitated an intuitive interpretation of data but also aided in correlating different physicochemical parameters to understand interdependencies within the aquatic ecosystem.
Statistical Analysis
A multi-dimensional statistical approach was used to uncover interrelationships among water quality parameters and identify pollution sources. Regression analysis and correlation analysis were conducted to evaluate interdependencies between different parameters, establishing statistical links between pollutants. Principal Component Analysis (PCA) was applied to reduce dataset complexity and identify dominant pollution contributors, helping in distinguishing the most influential variables affecting water quality. Cluster Analysis was performed to group sampling sites based on similar water quality characteristics, aiding in the identification of high-risk pollution zones. These advanced statistical techniques provided a robust understanding of pollution dynamics, helping in the differentiation of natural variations from anthropogenic influences. The integration of these methods enhanced the interpretation of data, leading to a more precise assessment of pollution levels and potential mitigation strategies.
Water Quality Index (WQI) Calculation
The WQI was calculated to provide an integrated assessment of water quality at each site. Each parameter was normalized using the Equation 1:

where

The calculated WQI values were classified into five categories: excellent (WQI < 50), good (50 ⩽ WQI < 100), moderate (100 ⩽ WQI < 200), poor (200 ⩽ WQI < 300), and very poor (WQI > 300), reflecting the overall water quality status across different sections of the Gomti River. This classification system provided a quantitative measure of pollution levels and helped assess spatial and temporal variations. The integration of WQI with statistical methods such as PCA and clustering allowed for a deeper understanding of pollution sources and spatial trends, making it a valuable tool for water quality management and policy recommendations.
Results and Discussion
Physicochemical Properties
The Gomti River surface water samples that were analyzed for their physicochemical properties, together with statistical measurements like average, minimum, and maximum values. Table 1 provides a summary of the physicochemical characteristics of the surface water of the Gomti River, including statistical measures such the mean, minimum, and maximum values for each parameter. The pH levels varied from 7.12 to 7.98, with an average of 7.55, falling within the permitted range of 6.5 to 8.5 set by both BIS (Kisan et al., 1989) and WHO (2008). This means that the water sample is neutral to slightly alkaline, making it suitable for various types of aquatic life. TDS: The average TDS level was 323.95 ppm, with a wide range from 210 to 453 ppm. Higher TDS levels may indicate an increase in dissolved chemicals, which could negatively impact water quality. Turbidity: An average turbidity of 16 NTU was observed, with values ranging from 7 to 29 NTU. Turbidity measures the degree to which suspended particles cloud the water, and higher turbidity levels can affect aquatic ecosystems and water purity.
Summary Statistics of the Analytical Data.

Additionally, the concentrations of various ions were determined. Sodium (Na) ranged from 10 to 80 ppm, with an average of 33 ppm, while Potassium (K) ranged from 5 to 30 ppm, with an average of 10 ppm. The average content of Calcium (Ca) was 49 ppm, within a range of 31 to 130 ppm. Hardness averaged 136 ppm, which indicates the water’s ability to form a lather with soap. Alkalinity averaged 57 ppm, ranging from 25 to 80 ppm.
Nitrate (NO3–) levels varied from 10 to 28 ppm, with an average of 17 ppm, while Nitrite (NO2–) was below the detection limit (BDL) to 0.28 ppm, with an average of 0.17 ppm. Although the average ammonia (NH3) level was relatively low at 0.39 ppm, higher concentrations could harm aquatic organisms. Ammonia pollution typically stems from industrial discharge and agricultural runoff.
The average Iron (Fe) content was 0.5 ppm, ranging from BDL to 3.3 ppm, while Fluoride (F) remained constant at 1 ppm. Phosphate (PO4) levels averaged 0.082 ppm, ranging between 0.1 and 0.5 ppm. Chlorine (Cl) was not detected in the samples. The average concentrations of Zinc (Zn) and Copper (Cu) were 0.37 and 0.13 ppm, respectively, with ranges from BDL to 1 ppm for zinc and BDL to 0.5 ppm for copper. Sulfate (SO4) levels averaged 45.55 ppm, ranging from 20 to 80 ppm.
Dissolved Oxygen (DO) is vital for aquatic life, with an average level of 0.9 ppm, suggesting insufficient oxygen for a healthy aquatic ecosystem. Higher DO levels are typically preferable. Biochemical Oxygen Demand (BOD), a measure of the oxygen bacteria use to decompose organic material, averaged 30.7 ppm, indicating a significant organic pollution load. Chemical Oxygen Demand (COD), which measures the oxygen required to oxidize both organic and inorganic substances, averaged 75.7 ppm, highlighting the total pollution level in the water. Higher COD levels indicate greater pollution and oxygen demand.
The magnesium content ranged from 10 to 137 ppm, with an average of 87.5 ppm. Chloride ion concentrations ranged from 90 to 180 ppm, with an average of 137.2 ppm, reflecting possible sources of pollution or natural influences.
These findings provide essential insights into the chemical composition of the Gomti River water, enabling better evaluations of water quality and potential environmental impacts. Continuous monitoring of these parameters is crucial for identifying contaminant sources and implementing effective management strategies to protect aquatic ecosystems and public health. Measures such as improving wastewater treatment, regulating industrial discharges, controlling agricultural runoff, and increasing public awareness and engagement in river conservation activities are critical. Additionally, the enforcement of water quality regulations is necessary to ensure the river’s health and sustainability.
Figure 4a to v illustrate the spatial variation of water quality parameters, including pH, TDS, Turbidity, Sodium, Potassium, Calcium, Hardness, Alkalinity, Nitrate, Nitrite, Ammonia, Fluoride, Iron, Phosphate, Zinc, Copper, Sulfate, Dissolved Oxygen, BOD, COD, Magnesium, and Chloride.

(a–v) Spatial Variation of water quality parameters.
Hydrogeochemical Properties
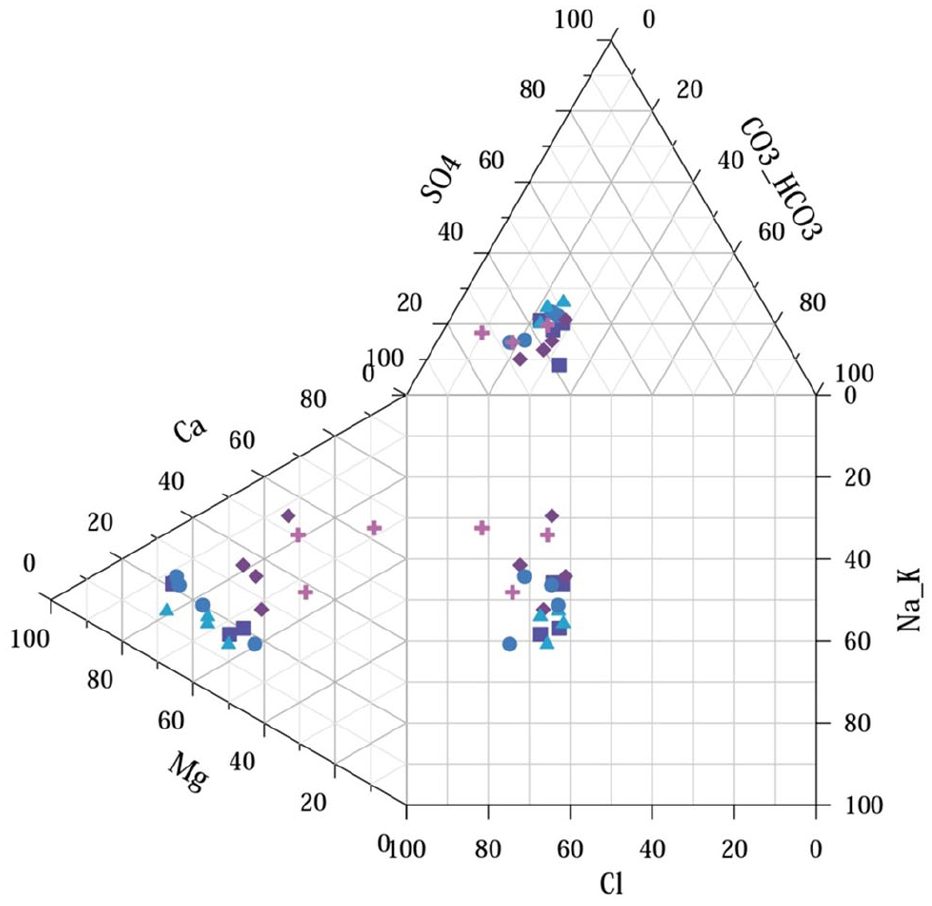
The hydrogeochemical properties of the Gomti River’s surface water, represented in Figure 5, illustrate the distribution of major cations and anions. A Piper trilinear diagram is a graphical representation commonly used in hydro-geochemistry to illustrate the hydro-chemical facies of water samples based on the concentrations of major cations and anions. It provides a visual way to classify water types and understand the dominant geochemical processes influencing water composition. The triangular cationic field of Piper diagram reveals that majority of the surface water samples fall into (Ca2+ and Mg2+) dominant class. whereas in anionic triangle, majority of the samples (65%) fall into sulphate field. About 35 % of the surface water samples fall into chloride field.

Trilinear diagram showing hydrogeochemical character of surface water.
Figure 6 shows (Singh et al., 2023) The major cation and anion values are presented on two independent triangular plots, and the data points are projected onto a common rectangular grid at the base of each triangle.
Two independent triangular plots of major Cation and Anion.
Correlation Analysis
The correlation matrix (see Table 2) shows the relationships between several metrics detected in surface water samples. Each parameter, such as pH, TDS (Total Dissolved Solids), turbidity, and others, is compared to every other parameter, yielding a symmetric matrix with the diagonal representing perfect correlation (1.0), indicating that a parameter correlates completely with itself. Positive correlation coefficients, shown by values closer to 1.0, indicate a direct link between parameters, which means that when one grows, so does the other. Negative correlation coefficients, closer to −1.0, suggest an inverse connection, with one parameter increasing as the other decreases. Values close to zero indicate little or no association. This matrix is critical for comprehending the interdependence of multiple water quality metrics, offering insights into the complicated.
Correlation Matrix for Surface Water.
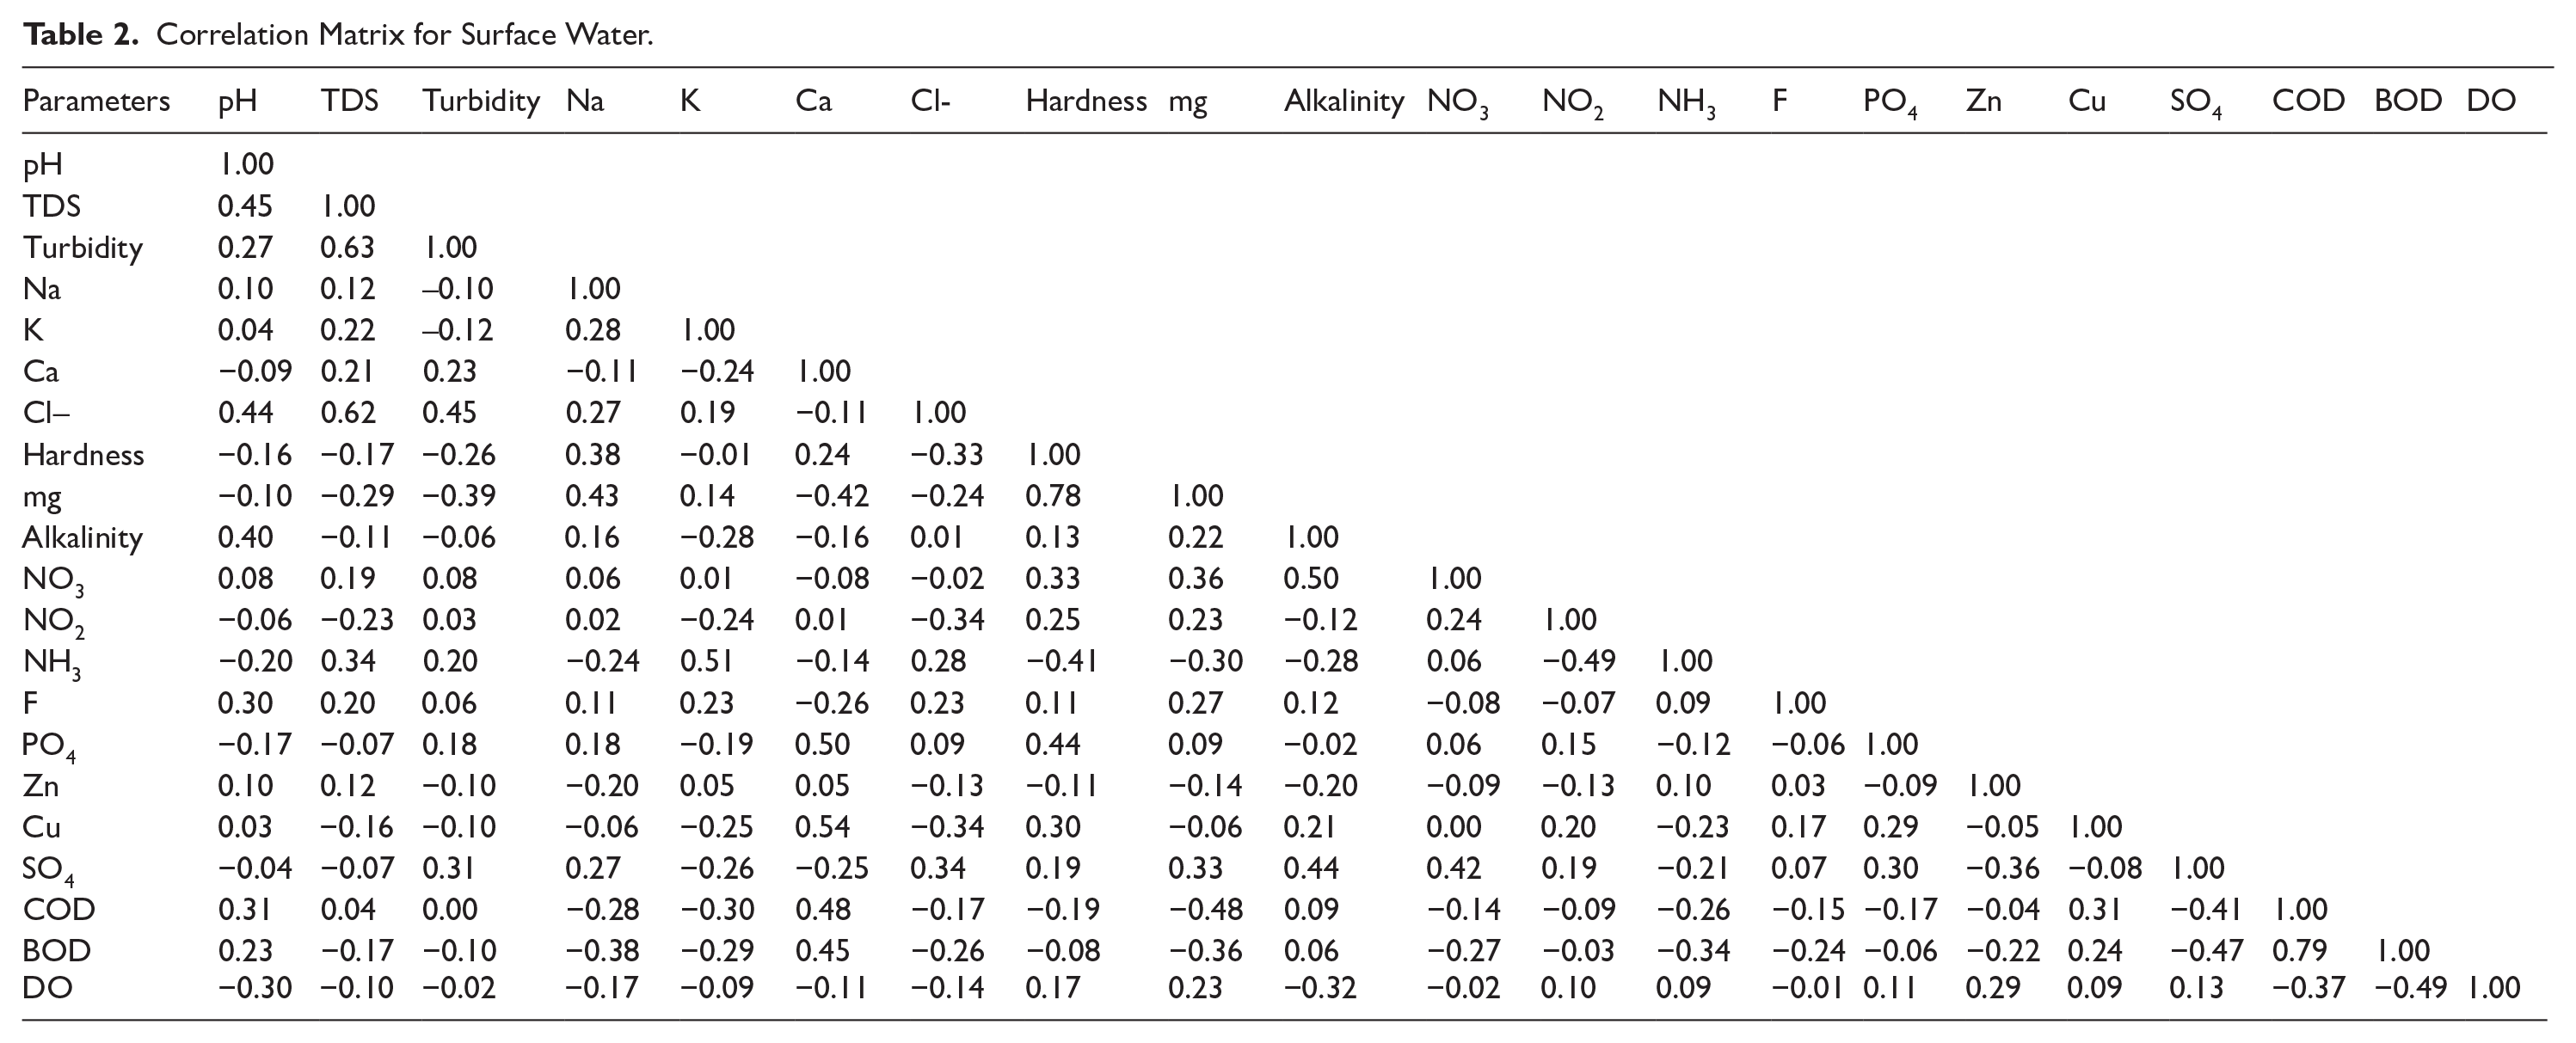
pH and TDS have a modestly positive correlation (0.5), meaning that as pH increases, so does TDS. pH and turbidity show a modestly positive connection (0.3), suggesting that greater pH levels may be linked to increased turbidity. pH and alkalinity have a somewhat positive association (0.4), indicating that greater pH levels may be associated with higher alkalinity values. TDS and turbidity have a modestly positive connection (0.6), suggesting that greater TDS levels may be linked to increased turbidity. Na and turbidity have a slight positive connection (0.1). Na and K have a slight positive connection (0.3).DO has modest negative associations with pH (−0.3), Turbidity (−0.4), NO3 (Nitrate; 0.1), NO2 (Nitrite; 0.1), NH3 (Ammonia; 0.1), F (Fluoride; 0.1), PO4 (Phosphate; 0.1), Zn (Zinc; 0.1), SO4 (Sulfate; 0.1), COD (Chemical Oxygen Demand; 0.1), and BOD (Biochemical Oxygen Demand; −0.4).
Principal Component Analysis (PCA)
As shown in Table 3, the PCA identified three principal components (PCs) that explained 91% of the total variance in the water quality data. The first principal component (PC1) accounted for 45.3% of the variance and was strongly associated DO, BOD, and COD. This component highlights the dominant role of organic pollution, primarily caused by untreated sewage and industrial effluents, which lead to oxygen depletion in the river.
PCA Result Summary.

The second principal component (PC2) explained 30.2% of the variance and was influenced by Total Dissolved Solids (TDS), Turbidity, and Ammonia. This component reflects pollution from agricultural runoff and suspended particulates, which contribute to the degradation of water quality. The third principal component (PC3), accounting for 15.4% of the variance, was associated with Iron and Hardness, indicating localized industrial contamination and natural geochemical influences. These results demonstrate that organic pollution, agricultural runoff, and industrial discharge are the primary contributors to the Gomti River’s water quality issues.
Cluster Analysis
As presented in Table 4, Hierarchical clustering grouped the water quality parameters into three distinct clusters based on their similarities. Cluster 1 included DO, BOD, and COD, underscoring their interconnected roles in representing organic pollution. Cluster 2 consisted of TDS, Turbidity, and Ammonia, reflecting influences from suspended solids and agricultural activities. Cluster 3 contained Iron and Hardness, indicating the effects of industrial discharges and natural factors.
Cluster Analysis.
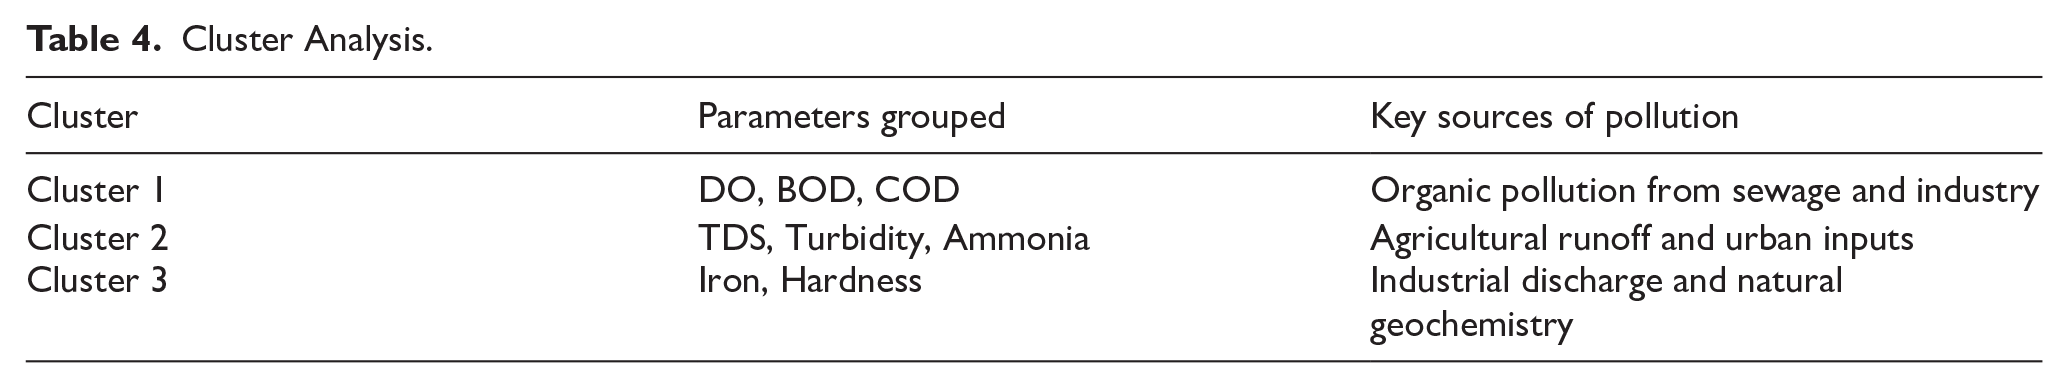
Spatially, the clustering analysis also revealed three pollution zones: (A) Upstream Sites (Cluster 1): These locations exhibited relatively better water quality, with minimal influence from urban or industrial sources; (B) Midstream Sites (Cluster 2): Moderate pollution levels were observed here, mainly due to agricultural runoff and urban waste; and (C) Downstream Sites (Cluster 3): These locations had the highest pollution levels, driven by untreated sewage, industrial effluents, and urban runoff.
Comparison With Previous Studies
The results of this study align with previous assessments of river water quality in urban settings, while also offering distinct contributions through the integration of advanced statistical techniques. Studies such as those by Nayak et al. (2024) and Saqib et al. (2023) have highlighted the utility of WQI for assessing pollution levels in rivers like the Ganga and Yamuna. However, these studies primarily focused on traditional WQI analyses without incorporating advanced tools like PCA and cluster analysis, which are critical for identifying pollution sources and spatial trends. In contrast, this study integrates these statistical methods to provide a comprehensive understanding of the Gomti River’s pollution dynamics.
For instance, Pimparkar et al. (2023) demonstrated the efficacy of cluster analysis in grouping water quality data for wetland systems, which is similar to the clustering approach used in this study to categorize pollution levels across different sections of the Gomti River. Similarly, Jigyasu et al. (2020) applied PCA to identify dominant pollutants in a river system, an approach that this study extends by linking PCA findings directly to specific pollution sources such as untreated sewage and industrial discharge. This additional layer of analysis enhances the actionable insights derived from the data.
Comparatively, global studies on the Huangpu River in China (Saqib et al., 2023) and rivers in Europe (Santy et al., 2020) have effectively used integrated methods to highlight pollution from urban runoff and industrial activities. This study parallels those efforts but provides a unique perspective by focusing on an urban Indian river with distinct seasonal variations and socio-economic contexts, particularly the Gomti’s reliance on groundwater inputs and its vulnerability during low-flow periods.
Justification of Novelty
This study differentiates itself from previous works by integrating WQI with PCA and cluster analysis to offer a multi-dimensional understanding of the Gomti River’s water quality. Unlike traditional approaches that summarize water quality into a single index, this study provides deeper insights into spatial variability and the interplay of physicochemical parameters. For instance, while prior studies have reported low dissolved oxygen (DO) levels in urban rivers, this study uniquely correlates DO with high biochemical oxygen demand (BOD) and chemical oxygen demand (COD) levels using PCA, directly linking these findings to sources such as untreated sewage and agricultural runoff.
Furthermore, the use of systematic sampling across multiple locations and advanced statistical analyses makes this study one of the first to comprehensively assess the Gomti River using these methods. By addressing the limitations of earlier research, such as the lack of integrated analyses, this work establishes a framework for similar assessments in other urban river systems.
Implications of the Study
The findings of this study hold significant implications for water security in urbanized river basins. Low DO levels (average 0.9 ppm) and elevated BOD (30.7 ppm) and COD (75.7 ppm) indicate substantial organic pollution in the Gomti River. Such conditions threaten the availability of clean water for drinking, industrial, and recreational purposes. To address these issues, it is imperative to upgrade wastewater treatment infrastructure and enforce stricter environmental regulations on industrial discharge. Establishing systematic water quality monitoring programs will also play a crucial role in maintaining the long-term sustainability of this vital water resource.
The implications extend to food security, particularly in agricultural systems that rely on the Gomti River for irrigation. Elevated levels of ammonia (0.39 ppm) and nitrates (17 ppm) could degrade soil quality, affecting crop health and productivity. Furthermore, the presence of pollutants such as heavy metals, though currently within permissible limits, raises concerns about bioaccumulation in crops, potentially jeopardizing food safety. Sustainable agricultural practices, including riparian buffer zones and controlled agrochemical use, should be adopted to mitigate these risks. Integrating water quality standards into agricultural policies will further enhance food security while safeguarding soil and crop health.
This study also aligns with several SDGs. It directly supports SDG 6 (Clean Water and Sanitation) by identifying critical pollution sources and proposing targeted interventions to improve water quality. Furthermore, addressing pollution in the Gomti River contributes to SDG 15 (Life on Land) by restoring ecosystem health and biodiversity along the riverbanks. Indirectly, the study supports SDG 2 (Zero Hunger) by addressing the impact of water pollution on agricultural sustainability. The methodological approach of integrating WQI with advanced statistical techniques such as PCA and cluster analysis also offers a replicable framework for achieving SDG 17 (Partnerships for the Goals), encouraging collaboration among researchers, policymakers, and stakeholders.
From a policy perspective, this study underscores the need for integrated water resource management strategies. Establishing centralized wastewater treatment plants for urban settlements along the Gomti River, imposing stricter penalties for industrial units violating pollution norms, and promoting community-driven river conservation programs are essential steps toward improving water quality. These measures will not only enhance environmental outcomes but also foster greater public awareness and participation in river management efforts.
Beyond environmental impacts, the findings highlight broader socio-economic implications. The deteriorating water quality of the Gomti River directly affects the livelihoods of communities dependent on it for water and agriculture. Poor water quality increases public health risks and imposes economic burdens due to the need for alternative water sources and healthcare expenses. Thus, improving the river’s water quality is critical not only for achieving environmental sustainability but also for enhancing the socio-economic well-being of the region.
Conclusions
The assessment of the Gomti River’s water quality in Lucknow reveals a mixed status of physicochemical parameters, with some values falling within permissible limits of BIS and WHO standards, while others indicate critical pollution concerns. Parameters such as pH, TDS, sodium, potassium, and calcium were within acceptable ranges, ensuring suitability for aquatic ecosystems and general usage. However, elevated hardness, alkalinity, and turbidity, along with critically low dissolved oxygen (DO) and high biochemical oxygen demand (BOD) and chemical oxygen demand (COD) values, indicate significant organic and inorganic pollution. The primary sources of contamination include untreated sewage discharge, industrial effluents, and agricultural runoff, which are particularly concerning during low-flow summer periods when pollutant concentrations are likely to increase due to reduced dilution capacity.
The novelty of this study lies in the integration of WQI, PCA, and Cluster Analysis, providing a comprehensive and spatially explicit understanding of pollution dynamics in the river. The findings highlight that DO, BOD, and COD serve as critical indicators of organic pollution, while TDS, turbidity, and ammonia reflect significant agricultural and urban influences. The clustering analysis identified high-risk pollution zones, particularly downstream sections, emphasizing the urgent need for localized interventions.
From a broader perspective, the results have significant implications for achieving SDGs, particularly SDG 6 (Clean Water and Sanitation) and SDG 15 (Life on Land). Ensuring the health of the Gomti River is essential for water security, food security, and long-term ecological sustainability. The study strongly advocates for improving wastewater treatment infrastructure, enforcing stricter industrial effluent regulations, implementing sustainable agricultural practices, and promoting community-based water conservation efforts.
However, this study is limited to monsoon season data, and the lack of multi-seasonal monitoring restricts the ability to capture seasonal variations in pollution levels. Future research should focus on longitudinal assessments covering pre-monsoon, monsoon, and post-monsoon periods to better understand temporal shifts in water quality. Additionally, integrating real-time water quality monitoring systems, hydrological modeling, and AI-driven predictive analysis would enhance water resource management strategies. Future work should also assess the ecological impacts of pollution on aquatic biodiversity and the socio-economic consequences of water quality deterioration.
By addressing these challenges, the sustainability of the Gomti River can be safeguarded for future generations, ensuring it continues to serve as a vital water resource for drinking, agriculture, industry, and biodiversity in the region.
Supplemental Material
sj-docx-1-asw-10.1177_11786221251328589 – Supplemental material for Assessment of Water Quality of Gomti River at Lucknow
Supplemental material, sj-docx-1-asw-10.1177_11786221251328589 for Assessment of Water Quality of Gomti River at Lucknow by Nidhi Singh and Smita Tung in Air, Soil and Water Research
Footnotes
Acknowledgements
The authors would like to express their gratitude to the Department of Civil Engineering, GLA University, Mathura, for providing the facilities and resources required to conduct this research.
Notation
BDL Below Detection Limit.
Author Contributions
Nidhi Singh: Conceptualization; data collection; analysis; and manuscript drafting. Smita Tung: Supervision; critical review; and editing of the manuscript. Both authors reviewed and approved the final version of the manuscript.
Funding
The author(s) received no financial support for the research, authorship, and/or publication of this article.
Declaration of Conflicting Interests
The author(s) declared no potential conflicts of interest with respect to the research, authorship, and/or publication of this article.
Supplemental Material
Supplemental material for this article is available online.
References
Supplementary Material
Please find the following supplemental material available below.
For Open Access articles published under a Creative Commons License, all supplemental material carries the same license as the article it is associated with.
For non-Open Access articles published, all supplemental material carries a non-exclusive license, and permission requests for re-use of supplemental material or any part of supplemental material shall be sent directly to the copyright owner as specified in the copyright notice associated with the article.