
Abstract
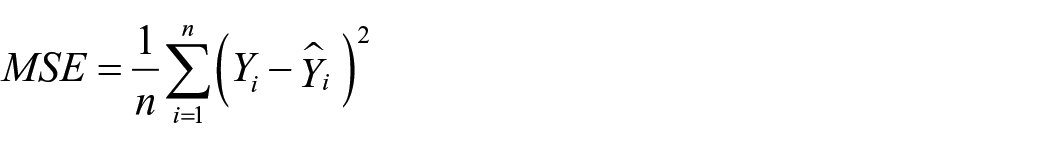
Toxic contaminants with potential exposure to health risks now appear in urban drainage systems. These contaminants may be measured in specific concentrations or gross terms with impact on potential of hydrogen (pH) and dissolve oxygen (DO). Often, urban slum settlements are at the effluents of these drainage systems. These communities mostly lack functional water treatment facilities. They drink and sanitize from run-off, and shallow wells in alluvial aquifers. This is responsible for the poor health and low quality living conditions of urban slum dwellers. It becomes imperative to implement reliable, real-time, water quality assessment and prediction systems to resolve known and emerging water quality issues in order to improve the quality of life in such communities. Thus, this work developed an inference engine for robust water quality assessment and prediction using some statistical and intelligent discriminant functions. Results show that machine learning algorithms including the Logistic Regression, Decision Trees, Random Forest, XGBoost, and Neural Networks schemes reliably predicted water potability in the absence of two missing instrumentation parameters namely: pH and DO. Typically, the inference engine estimated pH in the absence of DO. Subsequently, the Dissolved Oxygen was estimated using the predicted pH. In outcomes, computational metrics of the pH prediction model returns Mean Squared Error (MSE) of 0.0163 for training and 0.1024 for validation. Similarly, the Dissolved Oxygen was estimated by the Random Forest model with a mean squared error (MSE) of 1.0335 for training and 0.7150 for validation. Decision engines built on statistical discriminant functions reliably predicted water potability with validation accuracy and F1 score of 95.19% and 96.94% for Logistic Regression, 100% and 100% for Decision Trees, 98.97% and 99.35% for Random Forest, and 100% and 100% for XGBoost. Also, the Neural Networks scheme predicted water potability with an MSE of 98.97% and 99.35% for training and validation respectively. The developed soft sensor solution is applicable in situations with complete or incomplete instrumentation data. Summarily, the developed inference engines provide a reliable framework for fault diagnosis and serve as backup sensors in case of failure. This enhanced the validation and reliability of sensor data for water quality assessment and prediction.
Keywords
Introduction
Water is very important to human existence. It is by far one of the most important resources on Earth (Elubid et al., 2019). According to several studies, less than 1% of the available water resources are fit for human use (Yaro et al., 2023). Therefore, it is important to have a technique for evaluating the quality of groundwater systems using some index parameters. Since access to clean and potable water is crucial for human well-being and the entire ecosystem, the geographic distribution of freshwater is an important metric for assessing public health and its sustainability (Elubid et al., 2019). The distribution of fresh water varies widely across the globe and mostly influenced by geographical factors. Within the same geographic location, fresh water distribution may differ between urban and rural areas (Aji Setiawan et al., 2020). In urban areas, centralized water treatment and distribution systems are basic facilities. On the other hand, communities mostly rely on decentralized sources such as wells, boreholes, or rivers (Maryati et al., 2022). Potable water is water that is safe to drink and free from harmful contaminants, pathogens, and pollutants. Regions with abundant freshwater sources and well-developed infrastructure and water treatment systems generally have a higher percentage of potable water. Most people in industrialized nations have seamless access to drinkable water. These include people in Western Europe, the United States, Canada, etc. (Bernabé-Crespo & Loáiciga, 2024). Nevertheless, in developing nations, the availability of safe drinking water is of significant concern. Based on data provided by the World Health Organization (WHO), it is estimated that a staggering 2.2 billion individuals worldwide do not have adequate access to potable water (WHO & UNICEF, 2019). In the aforementioned places, there exists a heightened incidence of waterborne diseases. This gives rise to apparent health compromise and relatively high mortality (Lee et al., 2020). The Water Quality Index (WQI) is employed to categorize the quality of drinking water based on multiple physical, chemical, and biological parameters. This tool is among the many accessible options for representing data pertaining to the nature of water. It aggregates various water quality parameters (Uddin et al., 2021). This rating assesses the influence of several factors on the overall characteristics of water. The metrics under consideration include Electrical Conductivity (EC), Total Dissolved Solids (TDS), Chloride, Calcium, Magnesium, Sodium, Potassium, Sulphate, Total Hardness, Bicarbonate, pH, Carbonate, and Sodium Adsorption Ratio (SAR), among others. The interpretation of these parameters can be very cumbersome for the general public and even policy makers. That is why the WQI is very important since it aggregates all the parameters.
Water quality parameters consist of a range of physical, chemical, and biological attributes that ascertain the appropriateness of water for diverse applications. These include drinking, irrigation, and the sustenance of aquatic organisms. These parameters are used to measure the quality of water and determine whether it meets specific water quality standards (Omer, 2019). There are various water quality parameters that are frequently employed in the evaluation of water quality. They include temperature, pH, dissolved oxygen, and total dissolved solid. Others are Biological oxygen demands, turbidity, bacteria, pathogens, etc. These parameters are measured through various methods, including laboratory testing, field monitoring, and remote sensing. The objective is to ensure that they meet specific water quality standards to protect public health, aquatic life, and the environment.
Sensors play critical role in monitoring water quality. They support continuous measurement of key water quality parameters. However, occasionally these sensors could fail for a variety of reasons. When they do, they can have significant consequences for water quality monitoring. These may be inaccurate or incomplete data, false alarms, or missed alerts. The penalty may be poor public health, increased maintenance costs and downtime. This can lead to a range of issues, including delays in official response to contamination events, inaccurate risk assessments, and incorrect management decisions. To address these issues, it is important to have a reliable system in place for sensor maintenance and replacement. This can involve regular calibration and testing of sensors, as well as contingency plans for responding to sensor failures. Additionally, it is important to have backup sensors and redundancy in the monitoring system to ensure that data collection can continue even if individual sensors fail.
Soft sensors are essentially parameter estimation backup tools for measuring systems. They facilitate what-if analysis, real-time prediction for plant control, sensor validation, and fault diagnosis strategies. Basically, they are software that measure and process several signals in a plant in order to estimate the value of another variable of the system (Lima et al., 2022). In plants, a measuring device may get damaged due to extreme working conditions. Sometimes, the cost of acquiring some devices might be a concern. The challenge could also include inability to install specific measuring devices due to certain limitations in technologies. In situations like this, soft sensors are found useful as an alternative way of measuring, or estimating missing parameters or variables in the plant.
A soft sensor could be model-driven (white box) or data-driven (black box). The model-driven soft sensor is modeled with the first principle approach by understanding the physics of the system while the data-driven soft sensor relies on information derived from the historical data of the system from which empirical models are built. Soft sensors have helped governments to implement regulations in industrialized countries. An example is the Kyoto treaty aimed at reducing the emission of greenhouse gasses (Fortuna et al., 2006). In a nutshell, a soft sensor, like an observer, is a plant model for estimating plant variables.
In recent times, there has been a notable surge in interest within the domain of water quality evaluation, and potability prediction. More attention is now on the use of predictive models and machine learning algorithms (Ighalo & Adeniyi, 2020). Prior to the emergence of intelligent tools, evaluation of water quality predominantly depended on manual examination and chemical analysis of water samples obtained from different sources. These methods are known to take significant time and financial resources to realize. In addition, it is important to note that the static sampling of water quality parameters may not effectively account for the dynamic fluctuations that might occur due to a multitude of environmental influences (Ma et al., 2020). To overcome these constraints, water quality experts have resorted to employing data-driven methodologies to determine and possibly predict the potability of water from different sources. In this regard, the application of machine learning (ML) algorithms methods has demonstrated significant potential in the prediction of water potability. Thus, this work considered a range of machine learning methods for water quality assessment and prediction. The methods include models that are based on decision trees, support vector machines, random forests, and neural networks.
The models utilized in this study have been trained using historical data on water quality. The outcomes demonstrated the capability of the models to forecast the potability of water by considering a diverse set of inputs, such as pH levels, turbidity, conductivity, and dissolved solids, as well as a variety of chemical and biological characteristics.
The selection of relevant predictive variables is a crucial factor in the prediction of water potability. Researchers have conducted investigations into the significance of several water quality criteria in the prediction of potability. For example, the work of Sharma et al. (2019) revealed that some measures, such as turbidity, sulfate, and electrical conductivity, exhibited significant correlations with water quality. Similarly, an independent investigation conducted by Aziz et al. (2020) underscored the importance of pH, chloride, and total dissolved solids (TDS) as reliable indicators for properly predicting potability.
Furthermore, in the quest for real-time monitoring of water quality, accessibility and data quality are pivotal factors in the advancement and accuracy of prediction models. Up to this time, researchers have relied on historical water quality data, meteorological data and some geographic information for developing prediction models. Nevertheless, some issues relating to data consistency, the presence of missing values (which is the focus of this study), and the overall quality of the data have been established (Miller et al., 2005). In order to handle these concerns, various data preprocessing approaches, including imputation and data augmentation, have been employed to enhance the dependability of predictive models. Thus, assessment of the accuracy of water potability prediction models is crucial in ascertaining dependability and precision. In this process, metrics such as accuracy, precision, recall, and F1-score are frequently employed by researchers to evaluate the performance of a model (Rani et al., 2023). Additionally, receiver operating characteristic (ROC) curves and area under the curve (AUC) values are used to measure the model’s ability to discriminate between potable and non-potable water.
In some model-specific outcomes of soft sensors for water potability, Usman Kaoje et al. (2021) employed a machine learning methodology to forecast the water quality indicators of the Kelantan River. This was achieved by utilizing historical data obtained from many stations. The prediction model was developed using a Support Vector Machine (SVM). The study made predictions about six water quality measures, including dissolved oxygen (DO), biochemical oxygen demand (BOD), chemical oxygen demand (COD), ammonia nitrogen (NH3-N), and suspended solids (SS). The study’s findings revealed that suspended solid parameters had the most favorable performance in terms of prediction, as evidenced by its highest R2 score values. In contrast, the R2 score for the prediction of the COD parameter was found to be the lowest, suggesting that the dataset poses challenges in terms of its suitability for modeling using SVM. On the other hand, an examination of the impact of attribute number reveals a positive correlation between the prediction accuracy of the four parameters (DO, BOD, NH3-N, and SS) and the model’s performance. However, optimal estimation of the pH parameter is achieved by employing the minimum amount of features identified in the scheme.
From the foregoing, it is apparent that predicting water potability requires the knowledge of all key quality parameters and involving them in the model to predict potability. This might suffer a setback in case of sensor(s) omission, failure, or malfunction on the field. These are very common situations on the field. Therefore, it is useful to develop smart soft sensors that estimate missing key parameters when the need arises. They also stand in as backup sensors pending when the sensors’ fault is diagnosed and resolved. This study therefore focuses on the use of a soft sensor as a parameter estimation tool for fitting values of missing water quality parameters to predict water potability.
Materials and Methods
Data availability
The dataset used in this study is “Water Quality Dataset for Water Quality Prediction Tool” by Geetha J. (2023) obtained from Hydroshare (https://www.hydroshare.org/resource/4ab43e1b507b496b9b42749701daed5c/). It consists of 1,361 samples acquired from 31 unique capital cities in India. The cities are listed thus: Shimla, Chandigarh, Jammu, Dehradun, Lucknow, Patna, Kolkata, New Delhi, Bhopal, Jaipur, Ranchi, Dispur, Kohima, Gangtok, Gandhinagar, Mumbai, Raipur, Bhubaneswar, Hyderabad, Bengaluru, Chennai, Thiruvananthapuram, Pondicherry, Panaji, Telangana, Bangalore, Daman, Silvassa, Imphal, Agartala, and Shillong. The dataset has fourteen (14) features and eight (8) significant quality parameters. These include temperature, D.O., pH, conductivity, BOD, nitrate, fecal coliform, and total coliform. Lastly, it has a target label “class” which is a categorical data with the value “yes” if the water is potable and “no” if it is not. A cross-section of the data is shown in Table 1 while the classification of the target labels is shown in Table 2.
A Cross-Section of Water Quality Dataset Showing the Features and Labels Obtained From a Snapshot of the Data Head on Jupyter Notebook (Accessed Date: 10/12/2023).

Classification of Targets Before and After Preprocessing.

Data preprocessing
All samples in the dataset with missing values were first removed, reducing the number of samples to 967. The new classification of target labels is shown in Table 2. The station code, location, latitude, longitude, capital city, and state which are not significant parameters contributing to water potability were taken off. As shown in the correlation analysis in Figure 1, the fecal coliform feature is highly correlated with the total coliform feature with a correlation coefficient of 0.85. Therefore, the fecal coliform feature was also taken off. The final features used are: temperature, D.O., pH, conductivity, B.O.D, nitrate concentration, and total coliform.
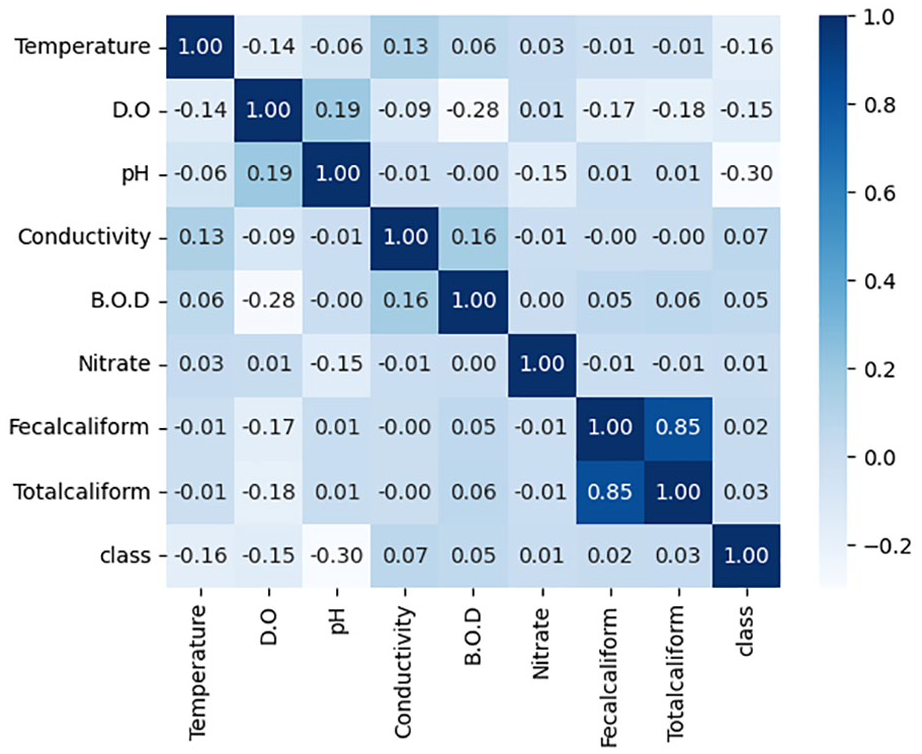
Correlation coefficient among water quality parameters.
Before the stages of model training and validation, the training and validation datasets were normalized due to the highly disparate scales used to measure the various water quality parameters.
The StandardScaler, also known as Z-score normalization or standardization, is a method used to transform features (variables) in a dataset such that the standard deviation of each feature is 1 and the mean is 0 (Rahmad Ramadhan & Yolanda, 2024).
Mathematically, the formula for standardization is:

Where:
Machine learning algorithms
Many machine learning algorithms are used in this work to build the water potability decision making model. The algorithms used in this study are logistic regression, decision trees classifier, decision trees regressor, random forest classifier, random forest regressor, XGBoost classifier, and XGBoost Regressor. Random forest regressor and XGBoost regressor were also used to develop soft sensors (which are parameter estimators) to estimate pH and dissolved oxygen respectively. The flow chart in Figure 2 describes the processes and steps taken to develop the models. These include loading of the dataset, filtering, scaling, training, and validating the models.

Flow chart for machine learning models for soft sensor development and application.
Performance metrics


Results and Discussion
Soft sensors: Water quality parameters estimation
In this study, we developed a soft sensor designed to estimate or predict the pH level of water based on five key water quality parameters: temperature, conductivity, biochemical oxygen demand (B.O.D.), nitrate, and total coliform counts. Additionally, we created a second soft sensor to estimate dissolved oxygen (D.O.) levels, incorporating the same five parameters along with the estimated pH value obtained from the first sensor. The 80-20 split strategy (Joseph, 2022) was used for all the regressor models. However, the 70-30 split strategy was also attempted but the performance was poor considering that the MSE for all the statistical models were greater than their respective 80-20 counterparts both in training and validation (Suwadi et al., 2022).
PH estimation model
Different machine learning algorithms namely: decision tree regressor, random forest regressor, XGBoost regressor, and neural networks were implemented to develop models that estimate the pH.
For the pH model, as seen in Figure 3, the minimum validation error is 0.1024 while the maximum is 0.1581 obtained from the random forest and neural network schemes respectively. The random forest algorithm outperformed other algorithms except the decision tree which is closest to it.

Comparison of the MSEs of the ML Algorithms for predicting the pH.
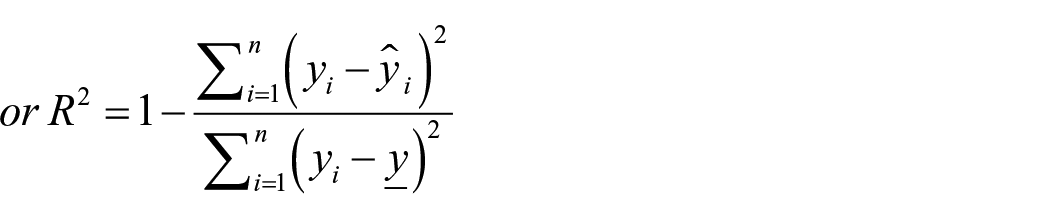
Figure 4 shows how the predicted pH compares with the actual pH with Random Forest algorithm. The plot of the predicted pH shows a good agreement with the plot of the actual pH except for a few spikes that could have been classified as outliers. From the regression plots shown in Figure 5a, 5b, and 5c, the R2 values for validation are 0.2933, 0.4963, and 0.3018 for decision tree regressor, random forest regressor, and XGBoost regressor, respectively.
Comparative Performance of Random Forest Predicted and Actual pH: (a) decision tree regressor for pH, (b) random forest regressor for pH, and (c) XGBoost regressor for pH.

The plot of predicted and actual values of pH obtained from different ML Algorithms.
Dissolved oxygen estimation model
Similar to the pH estimation, random forest, decision trees, XGBoost, and neural network models were used to predict dissolved oxygen. In this case, the minimum validation MSE is 0.7075 while the maximum is 1.2626 which are obtained for Decision tree and XGBoost respectively. Both extreme MSEs here are more than what we have in the pH model. This behavior is justified by the introduction of the predicted pH values used to estimate the Dissolved Oxygen. Unlike the pH model, the neural network algorithm performs fairly well with lower training and validation MSEs. For the D.O. model, as seen in Figure 6, the minimum validation error is 0.7075 while the maximum is 1.2626 obtained from the XGBoost and decision tree schemes respectively. The XGBoost algorithm outperformed other algorithms in this case from our research.
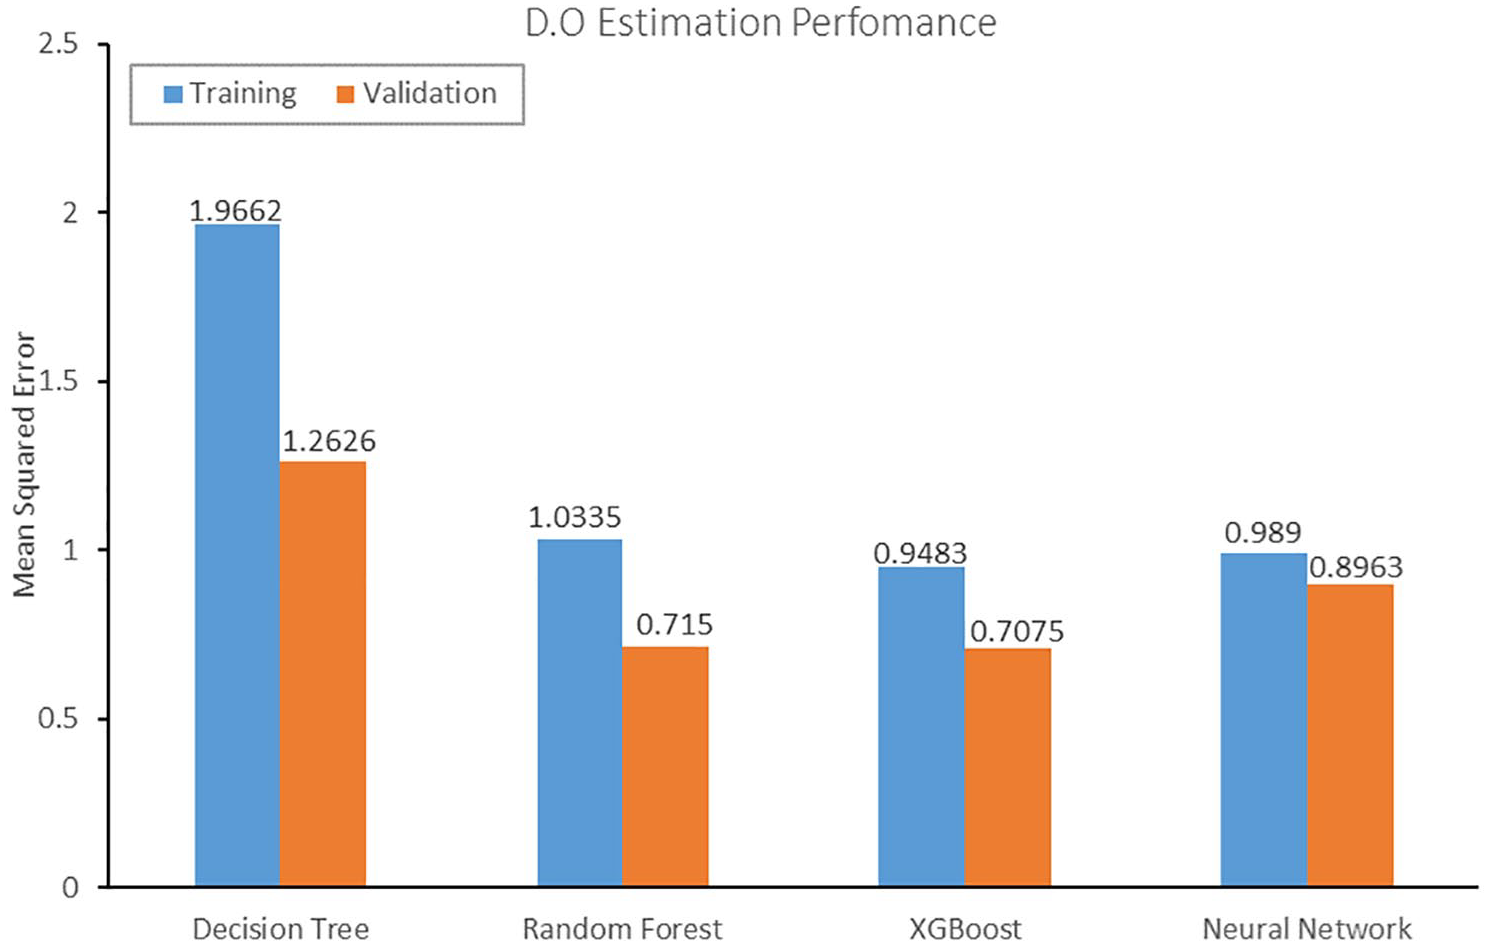
Comparison of the MSE ML Algorithms for predicting Dissolved Oxygen.
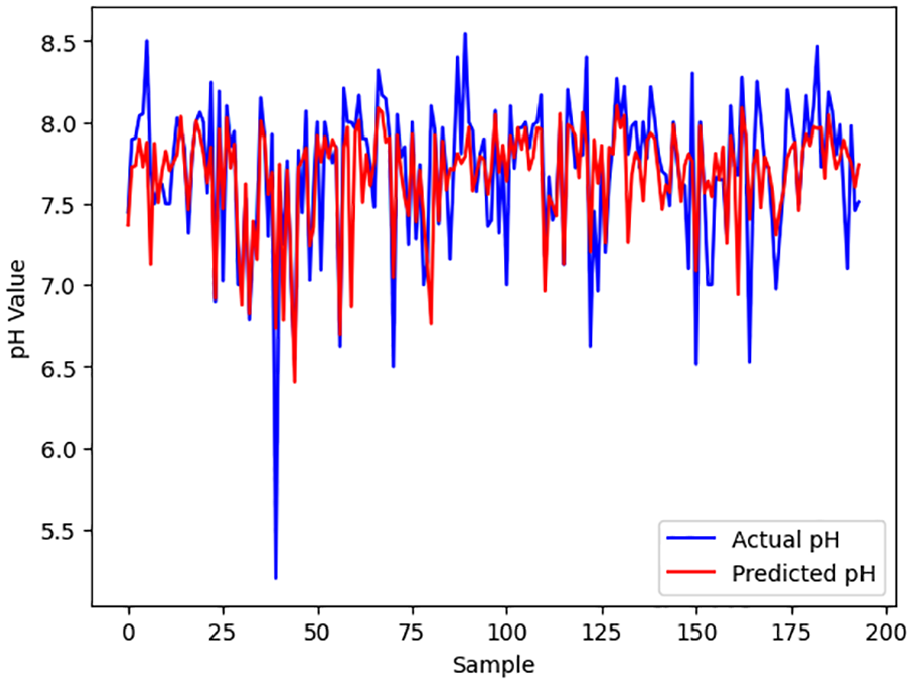
Figure 7 illustrates the comparison between the actual D.O. values and D.O. predicted using the XGBoost algorithm. The plot of the predicted D.O. (in red) shows a good agreement with the plot of the actual D.O. (in blue) just as in case of pH, but also has few spikes that could have been classified as outliers.

Comparison between the actual D.O. and D.O. predicted using the XGBoost algorithm.
Also, as shown in Figure 8a–c, in the regression plots of the predicted D.O. values and actual D.O. values, the R2 values for validation are 0.3132, 0.6110, and 0.6040 for decision tree regressor, random forest regressor, and XGBoost regressor respectively.

Actual vs predicted values of dissolved oxygen obtained from different ML algorithms: (a) decision tree regressor for D.O, (b) random forest regressor for D.O, and (c) XGBoost regressor for D.O.
Water potability prediction
Water is considered to be potable when it is safe for drinking and free from harmful contaminants, pathogens, and pollutants. According to Geetha Jenifel (2023) from the dataset used in this study, the water is potable when the target label class has the value “yes.” When the water is not potable, it has the value “no.” The normalized features (temperature, D.O, pH, conductivity, B.O.D, nitrate, and total coliform) were used to train a logistic regression model. A 70-30 split strategy was used to train the logistic regression model. This gave 81.09% validation accuracy. Feature engineering was carried out on the dataset to improve the performance of the model. To be precise, with different degrees of polynomials, the polynomial regression method was used to transform the features up to the eighteenth degree. The optimum order occurring at the tenth degree happened to be the optimal degree beyond which the training accuracy continued to increase while the validation accuracy started to decline. This indicated an overfitting problem beyond tenth order. Decision tree classifier, random forest classifier, and XGBoost classifier algorithms were also implemented for predicting potability. The 80-20 split strategy was used for all these.
Ultimately, a Neural network model was trained to recognize the pattern and extract water quality features using a three-layer network. Its hyper-parameters are as follows:
Layer 1: 120 Neurons, Relu activation function, and L2 with lambda = 0.0001
Layer 2: 60 Neurons, Relu activation function, and L2 with lambda = 0.0001
Layer 3: 1 Neurons, Linear activation function
The model was trained for 5,439 epochs.
The performances of the different schemes are summarized in Table 3. F1 score and accuracy score obtained for prediction by the logistic regression was 95.19 and 96.94, respectively. Other schemes gave relatively higher accuracies and F1 scores.
Summary of the Performance Metrics and Hyper-Parameters for Water Potability.

As shown in Figure 9, The Decision Tree and XG Boost algorithms correctly identified all potable and non-potable water samples. However, Random Forest Classifier and Neural Network models wrongly classified two (2) samples that are potable as non-potable.

The confusion matrix for the different machine learning models prediction models: (a) decision tree classifier, (b) random forest classifier, (c) XGBoost classifier, and (d) neural network.
Graphical user interface for water potability prediction
A graphical user interface was developed for the prediction algorithm. The application was built with Python and Django framework. The developed machine learning models were deployed on the website applications.
Plate 1 shows a state where all parameters are provided to the system except pH and D.O. After clicking the “check potability” button on the web page as shown in Plate 1, pH and D.O. values are predicted and displayed as shown in Plate 2 as approximated values. The prediction of the water potability is also shown as water is potable or water is not potable.
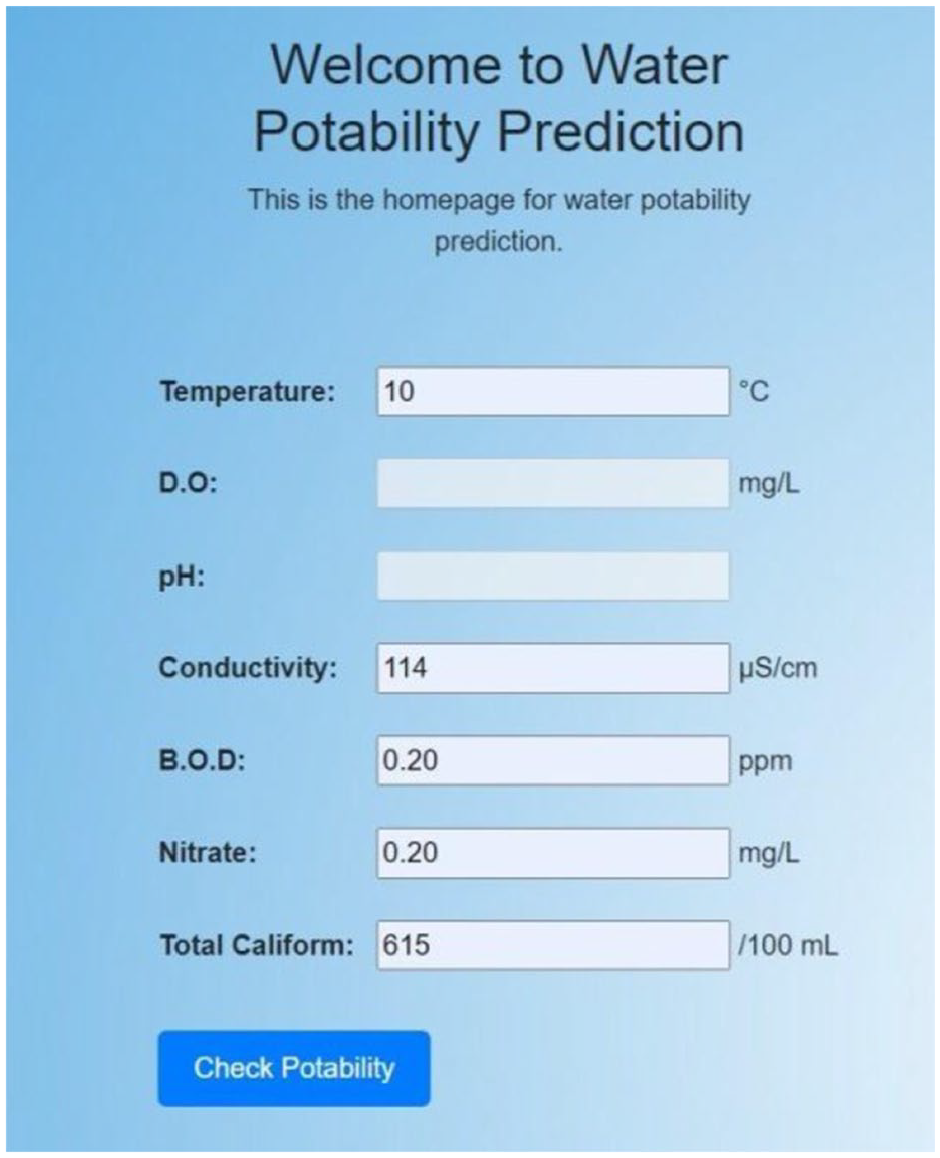
Plate 1: User interface for the water potability prediction website application showing the inputs

Plate 2: User interface for the water potability prediction website application showing the result
Summary and Conclusions
Sensors are essential in monitoring and assessing water quality because of the critical nature of their role. It is important they are also monitored and are in good working condition with high precision. When they fail and are not able to acquire and transmit data properly, it impacts negatively on the whole monitoring framework. This study addresses such challenges by developing robust inference engines referred to as soft sensors. The soft sensors are built with advanced machine learning models capable of predicting two critical parameters: pH and D.O. in case of incomplete instrumentation data. The results show high predictive accuracy across models. Among the pH soft sensors, Random Forest had the best performance with 0.1024 validation MSE while XGBoost achieved the best among the D.O. soft sensors with 0.9483 validation MSE. The developed soft sensors provide a reliable framework for fault diagnosis and serve as backup sensors in case of failure. This work highlights the potential of soft sensor-based solutions for improving water quality assessment and prediction systems, especially in urban slum settlements. Urban slum communities most times lack functional water treatment facilities. They rely on runoff and shallow wells for water supply. The inference engine can help identify contamination risks and inform necessary interventions. By advancing water quality monitoring and prediction through the developed soft sensors, the public health and living conditions in these settlements can be significantly improved.
Footnotes
Acknowledgements
The authors would like to appreciate the funding for this research from the Mastercard Foundation through the African Engineering and Technology Network (AFRETEC) which is managed by Carnegie Mellon University Africa under the Inclusive Digital Transformation Research Grant given to University of Lagos, Akoka, Nigeria. The views expressed in this document are solely those of authors and do not necessarily reflect those of the Carnegie Mellon University Africa or the Mastercard Foundation.
Abbreviations
BOD Biochemical Oxygen Demand
COD Chemical Oxygen Demand
D. O. Dissolved Oxygen
MSE Mean Squared Error
ML Machine Learning
NH3-N Ammonia Nitrogen
R2 R-Squared
SDG Sustainable Development Goal
SVM Support Vector Machine
SS suspended solids
WQI Water Quality Index
XGB Extreme Gradient Boosting
Author Contributions
Study conception and design: T.A., F.O., and M.O; data collection: M.A. and U.A.; analysis and interpretation of results: T.A., M.A., F.O., and K.O.; draft manuscript preparation: M.A., T.A., F.O., A.A., and U.A. All authors reviewed the results and approved the final version of the manuscript.
Declaration of Conflicting Interests
The author(s) declared no potential conflicts of interest with respect to the research, authorship, and/or publication of this article.
Funding
The author(s) received no financial support for the research, authorship, and/or publication of this article.