
Abstract
Understanding variations of heavy metals and their anthropogenic influence on wetland soils are very imperative and crucial for environmental planning and sustainability. To assess heavy metal contamination in Ibese wetland soils, Nigeria, 30 soil surface (0–20 cm) samples clustered around industrial effluents, were collected and analyzed with atomic absorption spectrophotometer for copper (Cu), zinc (Zn) and cadmium (Cd). Herein, the geo-accumulation (Igeo), and pollution index (PI), coupled with environmental (RS) remote sensing vegetation and water indices were employed as predictor models to assess heavy metals contamination of the area. The vegetation and water indices highlighted an intense decreasing vegetation trend and loss of waterbodies of the area, respectively. The results of the Igeo metals revealed that the wetland soils pollution ranged from uncontaminated to moderately contaminated, except Cd which ranged from moderately to heavy pollution. The PI shows a moderate significant pollution by Cu and Zn, except Cd which recorded considerable contamination. A very significant correlation was found between the metals and the spatial distribution pattern revealed that the contamination is related to the influence of uncontrolled human activities on soil properties like soil pH and organic carbon. The study suggested that adequate attention be directed to alert policymakers and stakeholders toward lessening the anthropogenic sources in the area for future control measures.
Introduction
In recent years, concern has pervaded globally over problems of heavy metal contamination in the environment (WHO, 2014; Kahsay et al., 2018; Uchimiya et al., 2020). This concern has garnered public attention to investigate heavy metal contamination (Wang et al., 2018) due to the increasing human populations (Xu et al., 2018). However, knowledge on the heavy metals like cadmium (Cd), copper (Cu), and zinc (Zn) contaminations around industrial effluents can be exploited for safe-guarding human health and ecological control measures (Kalpana et al., 2023). Hence, adequate assessment of heavy metals in the environment is important in developing countries, like Nigeria. The most contaminant of toxic-metals in the environment is soil (Q. Li et al., 2022), especially, wetlands (Adeniyi & Owoade, 2010). Wetland soils, characterized by water-logging, poor-oxygen conditions and uncontrolled sewage waste, generally function as a pool or reservoir of many heavy metals, especially, regions where Earth’s surface is deteriorating because of uncontrolled human activities (Tobore et al., 2021). Unfortunately, anthropogenic-induced activities, like open sawdust incineration, inappropriate concentration of industrialization and urbanization expansion, remain a common practice in Nigeria (Nkwunonwo et al., 2020; A. O. Tobore et al., 2022). More importantly, contamination of heavy metals in wetlands soils are xenobiotic (Riyazuddin et al., 2021), and serves as a buffer for toxic elements to human-being and animals (H. Li et al., 2018; Mazurek et al., 2017).
Heavy metals in soil are directly measured by means of analytical techniques (Wei & Yang, 2010; Yari et al., 2017). However, standard soil analytical techniques are becoming very expensive and time consuming over spatial and temporal geographical frames (A. O. Tobore et al., 2022). Specifically, analytical techniques of soil, satellite remote sensing (RS) and pollution indices, combined with geographical information system (GIS) database, has emerged a premier cost-efficient discrimination of toxic metal in wetlands (Wagh et al., 2018; Wei & Yang, 2010). Despite the existence of many pollution indices, such as enrichment factor (EF), pollution load index (PLI), geo-accumulation (Igeo), and pollution index (PI) among others. Igeo and PI have become reliable, efficient and sensitive to better estimate the natural and anthropogenic pollution (El Hamzaoui et al., 2020; Kong et al., 2012; Kowalska et al., 2016). On the other hand, satellite data, such as Landsat, has the capabilities to provide consistent, accurate and suitable indirect predictive information’s relating to spatial distribution of heavy metal contamination (Dogan, 2009). For instance, Enhanced vegetation index (EVI), Normalized difference vegetation index (NDVI), and Modified normalized difference water index (MNDWI), remains reliable and accurate indirect techniques applied to assess heavy metal contamination in the environment (Abdelaziz et al., 2018; Bijeesh & Narasimhamurthy, 2019).
Consequently, with the increasing economic growth, “Ibese” Ogun state, Nigeria, has been witnessing a dramatic expansion in industrialization and urbanization and also described as Agrarian region vulnerable to climate change (Akindele et al., 2020). Currently, efforts to abate heavy metals contamination in wetland soils requires urgent attention in developing countries, such as Nigeria, where “wetlands in close vicinities to waste effluents or industrial areas are sometimes referred to as wastelands” (A. Tobore & Bamidele, 2022). Extant research, in agriculture, and the environment indicates that a technique harmonizing soil standard specification, Igeo, and PI, combined with RS environmental covariates such as, EVI, NDVI, and MNDWI, are regarded as essential and accurate techniques utilized to assess heavy metal contamination in the environment, especially, in developed countries (Song et al., 2015). This is not the case in developing countries, like Nigeria. Hence, highlights the focus of the present study. The objectives of this study were to: (i): assess the wetland changes of the area between year 2012 and 2021 using EVI, NDVI, and MNDWI (ii): assess the spatial contamination of Cu, Zn and Cd, through GIS- based pollution (Igeo, and PI) indices.
Materials and Methods
Description of the study area
The study area lies between latitudes 7° 0′ 25.98 and 7° 0′ 40.8 N and longitudes between 3° 2′ 56.98 and 3° 2′ 98.69 E bounded with industries (Figure 1). The area is situated at Yewa North Local government area (LGA), with a population of 198,793 (National Population Commission, 2006 National Census) in an area of 723 Km2. The area is located within the lowland zones (31–161 m) of Nigeria with a major river flowing in its valley from different (south, west and north) directions. The annual mean rainfall of the area is about 1,368 mm and daily minimum and maximum mean temperature of about 21 and (Department of Meteorological Services, Abeokuta). The inhabitants practice agriculture with commonly grown crops like vegetables etc. (Dada, 2017). The soil’s parent material is derived from the sedimentary rocks underlain by sands, and clays, (Olabode & Mohammed, 2016). The parent material of the studied soils is sedimentary with Ustic moisture regime and possesses 1:1 lattice clay (>50% base saturation) minerals (J. R. Orimoloye et al., 2019). They are characterized as ferrugenized clay mottled and designated as Typic Kandiustalf according to USDA Soil Taxonomy System (2022). The soil depth of the area reflects in-situ clay formation or migration with weak angular blocky/sub-angular on the ped surfaces and characterized by dark grayish brown color. The soil textural class ranged between clay and sandy clay, where clay content increasing gradually with depths (J. R. Orimoloye et al., 2019).

Study area showing the geological formations, and the sample locations.
Data acquisition and analysis
The study applied RS data through geographical information system software to map the wetland changes of the area, during 2012 and 2021. Herein, Landsat 7 and 8 (enhanced thematic mapper plus) and (Operational land images/ thermal infrared sensor), respectively, of 30 m (m) atmospherically-corrected bands resolution, provided by U.S. Geological Survey (USGS) website (www.earthexplorer.usgs.gov) were downloaded and georeferenced to assess the studied area. The Landsat imageries were acquired in the dry month of February through path 191 and row 55 tied to the Universal transverse Mercator (UTM) of zone 31 North. The essence of the operation is to provide cloud free phenology stability, temporal consistency, and accurate quality interpretation of the images (Panuju et al., 2020; Théau, 2006). Afterward, the tied images were projected to the World geographic system (WGS) 1984. Table 1 provides further detail on the specifications of the utilized Landsat images.
Spectral and Radiometric Specifications of Landsat Images.

Source. USGS, 2012 & 2021.
Note. SWIR = short-wavelength infrared; NIR = near-infrared.
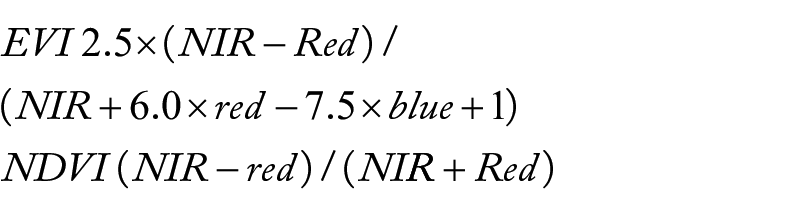
RS spectral-based indices have the potential abilities to indirectly assess the variation of soils relating to heavy metals through the relative humidity, greenness and brightness of vegetative cover (Baig et al., 2014; I. R. Orimoloye et al., 2020). In this study, spectral-based EVI, NDVI and MNDWI were applied to assess the vegetation cover and coverage of surface water of the area using the acquired 2012 and 2021 Landsat images. EVI and NDVI are efficient accurate indices applied to delineate wetland vegetation and help to identify the past and present vegetation conditions of an area (Lillesand et al., 2015). The MNDWI is an improved index utilized to better discriminates coverage of water surfaces of an area and was derived from the normalized difference water index (Bijeesh & Narasimhamurthy, 2019). The EVI, NDVI and MNDWI of the area were calculated through the equations described by Bhatti and Tripathi (2014) and Eid et al. (2020) as follows:

For each spectral-based index, the images—EVI, NDVI and MNDWI were produced into maps through raster calculator in Arc-Map 10.3 software version. Thereafter, the collected 30 random GPS coordinates points of the land cover features (i.e. waterbodies and vegetation) obtained from the field-work were overlay in the Google Earth engine for re-validation of the EVI, NDVI and MNDWI of the area. The vegetation cover and water index were applied as dependent support variables to assess the heavy metal contamination in the studied area. The corresponding various land cover types of the area were classify based on Lillesand et al. (2015) and Eid et al. (2020) (Tables 2 and 3).
Vegetation Values for Land Cover Types.

Source. Lillesand et al. (2015), Crippen (1990).
MNDWI Values for Land Cover Types.

Source. Eid et al. (2020).
Environmental covariates
Wetlands soils are sensitive to natural as well as anthropogenic activities, due to the ever increasing human populations (Tobore et al., 2021). In this study, geopedological information (geology, and soil types), geomorphology data (such as elevation, aspect, and distance to contour line were utilized to support movement of soil deposition pathway in the area, while anthropogenic information (proximity to roads, and rivers) were applied as environmental covariates to support the assessment of the heavy metals contamination (Figure 2). Geomorphology of the area was performed with 30 m Shuttle radar topographic mapper (SRTM), acquired through U.S. Geological Survey repositories. The digital elevation model (DEM) ranged from low (35) to high (161 m), slope degrees varied between 0 and 19, while, aspect map varied between 0 and 360° (distributed in 10 direction classes). The distance to the contours line also varied between 0–150 m and was utilized to better understand its contaminant pathway. The proximity to existing roads and rivers were derived for each raster cell to the closest road and river section using Euclidean distance in ArcGIS 10 software environment.

Environmental covariates used for Ibese wetland soils.
Sampling and characterization
In this study, a semi—detailed soil survey method was applied to assess the wetlands of the area. Triplicate soil samples were collected randomly at soil depths of 0 to 20 cm. Based on predominant land slope segments, a total of 60 soil samples were collected via the aid of soil auger and furthered clustered to 30 representative surface samples to assess the soil characteristics of the area based on field soil textural class examination. Latitude and longitude coordinates through the aid of global positioning system (GPS Garmin 65s) device of ≤ 5 m accuracy was attached to the collected soil samples to produce the spatial soil nutrient distribution maps of the studied area. Thereafter, the samples were air-dried before sieving with a 2 mm sieve.
Laboratory analysis of soil properties
In this study, soil reaction was measured by 1:1 soil to distilled water ratio. Particle size analysis and organic carbon (OC) content were determined through the hydrometer method and Walkley-black wet combustion method, respectively (Bashour & Sayegh, 2007; United States Department of Agriculture [USDA], 2022; Walkley, 1947). Concentration (mg/kg) of Cu, Zn and Cd, were measured from the air-dried < 2mm fraction of the soil using 1 g of pulverized digested samples. Digestion was done with 10 ml of a nitric and perchloric acid in ratio 2:1 (v/v) for 90 min, initially at 150°C. Thereafter, 2 ml of concentrated hydrochloric was added to the mixture and 230°C temperature of the digest was used for another 30 min on the digester and was allowed to cool down at room temperature. Afterward, the content of each digestion tube was transferred into a 50 ml volumetric flask, made to volume with distilled water and read through atomic absorption spectrophotometer (Das & Ting, 2017).
Spatial distribution of soil characteristics using GIS-based approach
GIS is a user-friendly computer based technology applied to assess the spatial distribution of natural and anthropogenic pollution over an expanse geographical area (C. Zhang et al., 2019). In the study, ordinary kriging (OK) interpolation was utilized as the unbiased and a superior linear prediction in elaborating the distribution of the soil properties that is, soil texture, organic carbon and soil pH of the area (Radočaj et al., 2021). On the other hand, soil data from the analysis were subjected to simple descriptive (mean, standard deviation) statistics through SPSS 20 version, for Windows. Correlation was used to understand the potential and relationship between the heavy metals—Zn, Cu and Cd with the soil pH, soil texture, and organic carbon contents.
Geoaccumulation index (Igeo) and pollution index (PI)
Pollution indices remain an effective tool for a better estimate of natural or anthropogenic pollution (Kowalska et al., 2016). In the study, geo-accumulation (Igeo), and pollution index (PI) were utilized to assess the heavy metal pollution of the area. The Igeo and PI were calculated on the basis of heavy metal contents of the soil through geochemical background values of 0.41(Cd), 38.9 (Cu), and 70.0 (Zn) which is essential for the study (Rivera et al., 2015).
Igeo is an effective indicator applied to quantify the intensity of heavy metals pollution. The Igeo enables easy and accurate assessment of heavy metal accumulation by comparing the current and pre-industrial concentration in the environment (Bhuiyan et al., 2010; Ji et al., 2008). The study utilized the Igeo to assess the intensity of the metal accumulation of the area using the proposed equation by Müller (1969) and redefined by El Hamzaoui et al. (2020).

where, B refers to the local natural geochemical value in the earth crust, and ni: is the concentration of individual heavy metals (Kabata-Pendias & Mukherjee, 2007). The 1.5 is the constant factor, and thus accommodate or compensate for possible lithogenic effects to detect possible anthropogenic influences in the environment (Özkan, 2012). The Igeo for Cd, Cu, and Zn of the area were computed and classified as follows:


The pollution index (PI) is the heavy metal concentration in the soil to the local background of soil concentration. The study utilized the PI to assess the soil quality of the area through the equation described by Wei and Yang (2010):

where Cn is the concentration of individual heavy metals and Bn refers to the background local natural geochemical value. In the study, the PI was then classified as follows:

Stepwise workflow of the study.
Results and Discussion
Satellite-based assessment of Ibese wetland soils
In the study, the wetlands pattern through the EVI, NDVI and MNDVI were displayed in Figure 4 focusing on vegetative cover and water surface between 2012 and 2021. The resultant values of the displayed EVI, NDVI and MNDVI of the area ranged from 0.46 to –0.01 and further reclassified into threshold value of 1 to –1. The applied electromagnetic spectrums of blue (0.45–0.52 μm) and red (0.63–0.69 μm) including the green (0.52–0.60 μm) bands assisted in the visibility of healthy and unhealthy vegetative cover of the studied area. Also, the NIR reflectance (0.77–0.90 μm) reveals vegetation as green which was utilized together with green electromagnetic band to detects waterbodies having low reflectance (Crippen, 1990). Based on the obtained results, shifts in the vegetative cover and waterbodies were observed. The results of the spectral value were dominated with −1 value, respectively and revealed that the studied area is susceptible to wetland depletion due to decreased in vegetative cover and loss of water surface.

EVI, NDVI and MNDSI of the study area in different years, (a–c) representing year 2012; (d–f) representing year 2021.
The shifts observed in the area could be related to the phenology of the wetland dynamics as well as water index as highlighted by Petus et al. (2013) and I. R. Orimoloye et al. (2018). Nevertheless, the decreased in vegetation cover and loss of waterbodies content of the area may be attributed to environmental degradation and gradual or sudden anthropogenic activities such as illegal deforestation of vegetation to built-up. I. R. Orimoloye et al. (2018) posited that spectral-based indices (such as EVI, NDVI and MNDWI) dominated with value of −1, can be successfully utilized to delineate areas that are prone or susceptible to anthropogenic activities. This was equally the views of Tobore et al. (2021) and Polykretis et al. (2020). Furthermore, Dogan (2009), opined that EVI, NDVI, MNDWI, remains the indirect method applied to study the rate of human activities. Although, Polykretis et al. (2020), demonstrated that EVI, NDVI and MNDWI are the most significant and important indexes employed to assess vegetation cover and water surface area, especially areas with uncontrolled agricultural activities.
The EVI and NDVI (ranging from 1 to –1) applied in this study depicts an indices capable to monitor the annual vegetation changes. In addition, the absorptive and reflective feature of the EVI and NDVI has helped to better reflect the different vegetative cover of the studied area through the electromagnetic spectrum-bands (A. O. Tobore et al., 2019). In addition, the absorption of the chlorophyll-red light and infrared radiation through the mesophyll of the vegetative cover makes it easy to assess the conditions of vegetation cover of the area (Halabisky et al., 2016). Polykretis et al. (2020) re-affirmed that an area covered by slight or dense vegetation, the vegetation growth conditions can be assess or monitor with EVI and NDVI. The present findings is similar to the results of Khadijat et al. (2021) and Mugure and Oino (2013), that vegetative cover loss in developing countries like Nigeria can be accrue to illegal deforestation and inappropriate land use planning. Furthermore, Lillesand et al. (2015) demonstrated that assessment of vegetation cover through EVI and NDVI, remains a global standardized index that can helped to compensate and generate information relating to the rate of human activities. Nevertheless, Halabisky et al. (2016) noted that the photosynthetically and non-photosynthetically spectral signatures provided by Landsat data has helped to easily and accurately delineate the differences in wetland changes of the area through EVI and NDVI (Polykretis et al., 2020).
The MNDWI utilized in this study provides information that is helpful to compare the evolution of non-aqueous and aqueous surfaces of the area (Richardson et al., 2016). The results of the MNDWI analysis between 2012 and 2021 successfully revealed a significant depletion of surface waterbodies of the area. The outcome of the present research highlighted that the loss of surface waterbodies in the area and could be traced to conversion of wetland environment of the area into build-up environments, such as roads, bridges, and industries which occurred over-time. Besides, the MNDWI applied in this study connotes a very good proxy to determine wetland areas faced with water stressed which may be pinpointed to anthropogenic activities (Serran & Creed, 2016). Although, McFeeters (1966) argued that MNDWI can help to established well means of detecting surface waterbodies in less time and with higher accuracy. Furthermore, the superiority of the MNDWI maps has helped to monitor and predicts the physiological drought which is apparent to a shortage of water especially an area faced with gradual to a sudden anthropogenic induced activities (Nguyen et al., 2019; A. O. Tobore et al., 2022). Moreover, Serran and Creed (2016) reported that MNDWI can help in the estimation of the soil-water content through Landsat. Nevertheless, the aggravated global climate change, and invasive species as well as anthropogenic activities, especially in developing countries could have significantly play or contributed to the decreased or loss of the vegetation cover and surface waterbodies of the studied area (Feng et al., 2017; Serran & Creed, 2016).
Concentration of heavy metals in Ibese wetland soils located around industrial area
The descriptive statistics of the studied area for soil heavy metals are provided in Table 4. The mean concentrations of the present study are in the order: Cu > Zn > Cd. The threshold limit is applied to checkmate the minimum toxicity in soils environment (Olatunde et al., 2020; Tóth et al., 2016). The mean concentrations of heavy metals in our study and other relating studies are presented in Table 5. Coefficient of variation (CV) is a degree or measure of relative variability while the standard deviation (SD) primarily revealed the degree or disparity of the analyzed data (A. O. Tobore et al., 2022; Wilding, 1985). In the study, the Cd had the highest CV (6.5%) while Cu (2.37%) recorded the lowest CV value. Similarly, high SD was also obtained for Cd (3.63), while Cu (1.10) and Zn (1.20) recorded lowest SD. The variability of soil heavy metals—Cu, Zn and Cd observed may be trace to pedogenic processes etc. (A. O. Tobore et al., 2022). High concentrations of Cu, Zn and Cd obtained could be trace to different anthropogenic sources and a similar order with high concentration of Zn and Cu were reported by M. K. Zhang et al. (2010). The results of the Cu, Zn and Cd concentration measured in our study interdem with the study of Olatunde et al. (2020). Nevertheless, the concentration of Zn, Cu and Cd obtained in the studied area may be influenced by deposition of waste plastics, batteries, leather, paint products and metal scrap that are indiscriminately dumped within the surroundings of the area. The present results also aligned with the study of Adewuyi and Osobamiro (2016), indicating that high Zn concentration in the environments may be attributed to anthropogenic impacts such as traffic-related metals which allow easy mobility of heavy metals into wetlands. Although, R. P. Li et al. (2009) argued that high concentration of metals like Cu and Zn contents may be due to the presence and variation of atmospheric deposition of toxic fumes movement in close vicinities to industries. Furthermore, Oyetibo et al. (2017) reported that road-dust and industrial atmospheric effluents discharged makes it easy to transfer appreciable significant toxic metals into wetland areas through precipitation. The high concentrations of these soils—(Cu, Zn and Cd) are of great concerns to the environment and may be attributed to poor community sewage system and abuse of fertilizer by farmers (Majolagbe et al., 2018; Y. Zhang et al., 2016).
Heavy Metal Concentration (mg/kg) in Ibese Wetlands.

Heavy Metal Concentration (mg/kg) Compared With This Study and Other Studies.

Correlation matrix of Ibese wetland elements located around industrial area
The correlation matrix was applied to evaluate the relationships between the heavy metals and physico-chemical properties (Table 6). Bioavailability of heavy metals in the soil can be influenced by the interactions of soil pH and organic carbon including soil texture especially clay which retains other contaminants in the soil (Ma et al., 2016). So far, organic carbon, soil reaction (pH), and soil texture in the present study affects the migration and dispersion of heavy metal contaminants in the area (Costa et al., 2020). Also, soil organic carbon (OC) content had correlation with copper (Cu) and thus affects the rate of metal enrichment in the soils. Based on the spatial distribution pattern, the soil OC content ranged from very low (<0.4%), to moderate (1.0%–1.5%) (Figure 5). The intensive farming of the land and other uncontrolled agricultural activities could be responsible for the low concentration of OC content in the area. Although, Barakat et al. (2012) and A. O. Tobore (2023) opined that OC plays important roles in the retention of heavy metals concentration in the soil. Negative correlation was observed for sand with OC and thus indicates that these elements may not be associated with carbonate minerals (Barakat et al., 2012). Although, soil pH and OC contents serve as important parameters for heavy metals retention in soils (Barakat et al., 2012). The soil reaction (pH) of the studied soils ranged between slightly acidic (pH 6.1) and moderate alkalinity (pH 8.4), with a general trend of increasing alkalinity. The acidic and increasing alkalinity could be an indication of the low OC content, due to yearly farming of the area without adding appropriate fertilizers. Besides, the low OC concentration in the studied area revealed low nutrients availability within the study area and thus affecting the fertility spatial distribution status of the studied area. Besides, IARI (2011) opined that most soil nutrients can be easily transported when the soil pH solution ranges between acidic and alkalinity. Nevertheless, the pedogenic processes, the type of pesticides and indiscriminately discharge of household waste including industrial effluents in close vicinities to surroundings or along the riverbanks may also be attributed to the pH variation (Obiora et al., 2016).
Heavy Metals Correlation With Physico-Chemical Properties of Ibese Wetlands.


Soil pH, organic carbon and soil texture of the study area.
Pollution assessment of Ibese wetland soils
Assessment using Igeo and PI
In the study, a quantitative analysis of heavy metals pollution assessment around industrial area was undertaken to assess its impacts on wetlands soil through GIS-based (pollution index and geo-accumulation) techniques. The heavy metals pollution index (PI) distribution maps of Ibese wetland soils around industrial area are shown in Figure 6. The results obtained showed that Zn, and Cu ranged between the class of low (PI ⩽ 1) and middle (1 < PI⩽3), except Cd that ranged from low (PI ⩽ 1) to high (PI > 3). This is an indication that the Ibese wetland soil around the industrial area needs immediate intervention to ameliorate hazardous pollution. The Igeo metals revealed that Zn and Cu ranged between the class of uncontaminated (0 < Igeo⩽1) to moderately contaminated (1<Igeo 2), and with the exemption of Cd (Figure 7). The geo-accumulation (Igeo) Cd transects of the area (i.e. north, west and south) ranged from uncontaminated to moderately/heavy pollution. This suggests that the studied area is significantly contaminated by these three metals—Zn, Cu and Cd. Although, the metals concentration recorded in the studied area could be attributed to uncontrolled human activities and high population density (El Khalil et al., 2008). Also, Tobore et al. (2021) and Chang et al. (2014) opined that the problem of heavy metal contamination in wetlands are of great concern particularly in developing countries like Nigeria, where wetlands are used as discharge of household and industrial waste materials.

PI for copper, cadmium and zinc of the area.
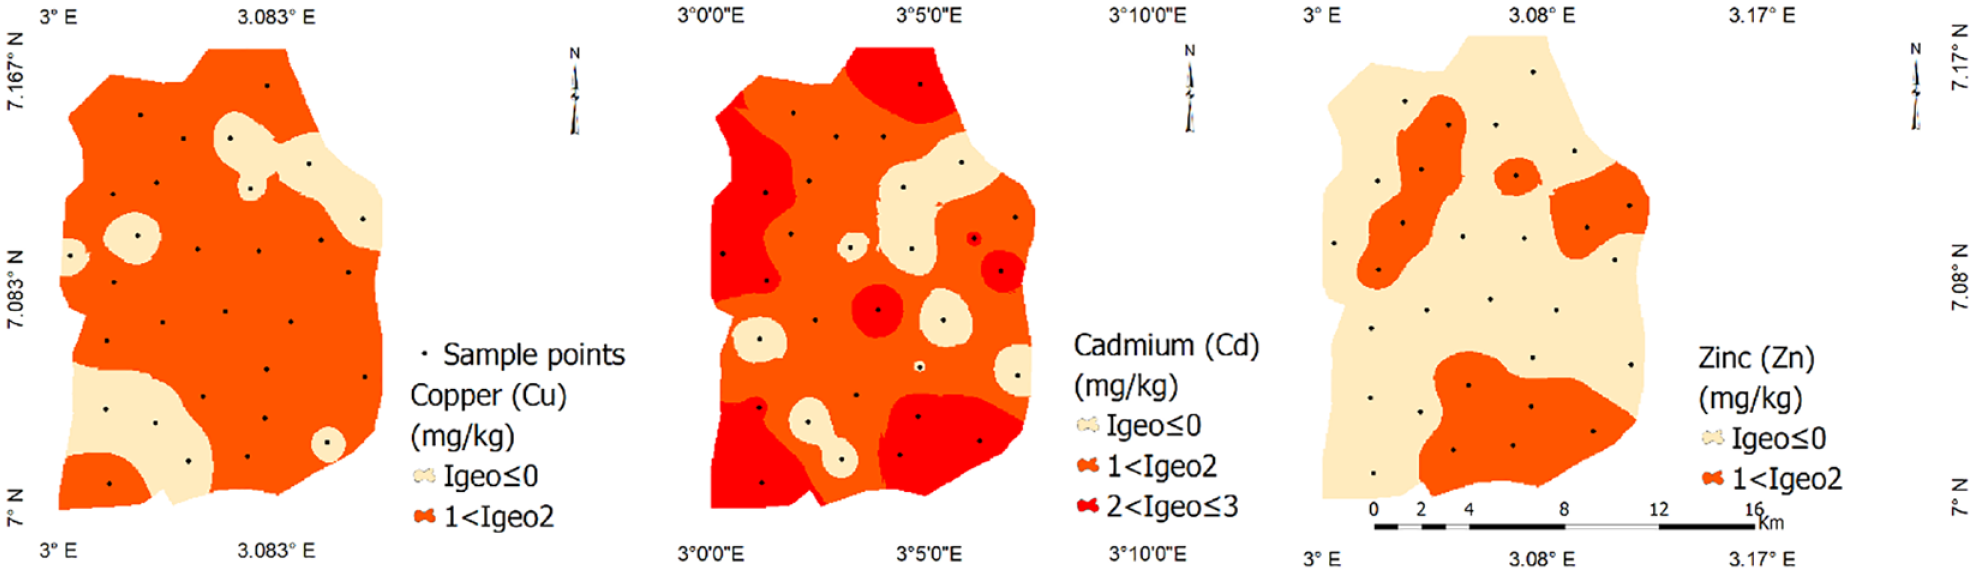
Igeo for copper, cadmium and zinc of the area.
Conclusion and Recommendation
Wetland soils serve as natural infiltration sinks due to their pollutant adsorption capabilities. Understanding heavy metals variations and their anthropogenic influence on wetlands soil are very crucial and important for environmental planning and sustainability. This study utilized the environmental covariates—EVI, NDVI and MNDWI with the GIS-based (Igeo and PI) techniques to assess heavy metals contamination in Ibese wetlands soil located around industrial area, Ogun state, Nigeria. A total of 30 surface soil samples were randomly clustered across different part of the area and analyzed for Cu, Zn and Cd using atomic absorption spectrophotometer. The spectral-based EVI, NDVI and MNDWI indices decreased considerably more in 2021 than in the year 2012. The sequence of occurrence of the analyzed metals is in the order: Cu, Zn and Cd and with the average concentrations of 1.39, 1.16 and 0.93 mg/kg, respectively. The results of the Igeo and PI revealed that Ibese wetlands soil pollution ranged from uncontaminated to moderately contaminate for Cu and Zn except Cd indicating moderately to heavy pollution. The uncontrolled ingestion of human activities revealed that Ibese wetlands experienced abuse of agricultural activities and poor sewage system thereby contributing to exposure and concentration of toxic metals in the area. The study suggested that adequate attention be directed to alert policymakers and stakeholders toward lessening the anthropogenic sources in the area.
Subsequently, the results of this study further suggest inclusion of agricultural practices and other natural factors such as rainfall, evapotranspiration and temperature etc., to identify the state of wetland and its potential implication on biodiversity and the environment.
Footnotes
Acknowledgements
The author is sincerely grateful to farmers (both male and female) in the area for their understanding and allowing us to carry out this study in their farms and equally thankful to the U.S Geological Survey for assisting this research with data sets and support from my undergraduate students during the field work. The works of previous authors in this important research context and the invaluable contribution and insights and resourcefulness of the editor and reviewers of this manuscript are vital to the completion of this research.
Availability of Data and Materials
The datasets of this article are available from the corresponding author on a reasonable request.
Funding
The author received no financial support for the research, authorship, and/or publication of this article.
Declaration of Conflicting Interests
The author declared no potential conflicts of interest with respect to the research, authorship, and/or publication of this article.