
Abstract
In this study, Acid Blue 25 (AB25), which is a negatively charged synthetic dye was removed from an aqueous solution by adsorption onto agricultural wastes, including banana (BP) and durian (DP) peels. The adsorption performances of AB25 were related to surface characteristics of the agricultural wastes, including their chemical functional groups, net surface charge, surface morphology, surface area, and pore volume. Parameters affecting the adsorption, including contact times, initial concentration, pH, and temperature were investigated. The results revealed that the adsorption of AB25 followed pseudo-second order kinetics, and that the adsorption process was controlled by a combination of intraparticle and film diffusion with a two-step mechanism. The equilibrium data could be simulated by the Langmuir isotherm model, suggesting that AB25 molecules are adsorbed on active sites with a uniform binding energy as a monolayer on the adsorbent surface. The adsorption process was spontaneous and exothermic, and the adsorption capacity decreased with the pH of the medium. The spent adsorbents were best regenerated by acid treatment (pH 2), and could be recycled for several adsorption-desorption processes. Under ambient conditions, the maximum adsorption capacities of AB25 on BP and DP were 70.0 and 89.7 mg g−1, respectively, which is much higher than on a large variety of reported adsorbents derived from other agricultural wastes.
Introduction
The massive scale of industrialization has delivered major technological advances to the current modern world. As a consequence, many short-term benefits have been claimed at the expense of long-term environmental damage to the air, soil, and water. In particular, water systems are contaminated by effluents containing heavy metals, synthetic chemicals, and byproducts, which are known to be toxic, mutagenic, carcinogenic, or teratogenic to various microorganisms and humans (Boretti & Rosa, 2019). The preemptive solution to this problem is to remove these pollutants from industrial wastewater before discharging it into water systems (Palani et al., 2021). Among most promising practical methods to achieve this, adsorption has received a great attention due to its simplicity and applicability (Piaskowski et al., 2018; Rafatullah et al., 2010). To date a wide range of materials, such as activated carbons (Alwi et al., 2020; Srivatsav et al., 2020), natural clays (Alshameri et al., 2019), zeolite-based composites (Zamri et al., 2021), and agricultural wastes (Zaidi et al., 2019) have been utilized as adsorbents. In particular, agricultural wastes have several obvious advantages, including their availability in large quantity at low cost, and because their surfaces contain a variety of functional groups (De Gisi et al., 2016).
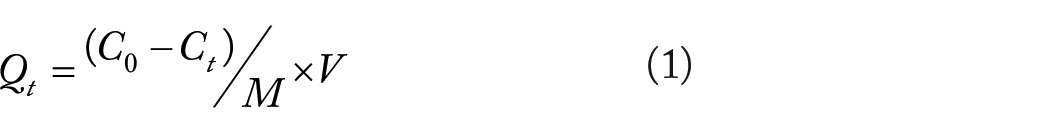
One of the synthetic dyes commonly utilized in industries and found in effluents is the negatively charged Acid Blue 25 (AB25) (Lewis, 2009). Because of this, the adsorptive removal of AB25 from an aqueous solution has been studied as a model for treatment of wastewater contaminated by acidic synthetic dyes. It has been investigated by employing various types of adsorbent, including activated carbons (Auta & Hameed, 2011; Tovar-Gómez et al., 2012), plants (Kousha et al., 2014), agricultural wastes such as cempedak durian peel (Dahri et al., 2016), pine sawdust (Ferrero, 2007), oak sawdust (Ferrero, 2007), peach seed (Kul et al., 2019), hazelnut shells (Ferrero, 2007), Ficus rasemosa powdered leaves (Jain & Gogate, 2017), Azolla pinnata (Kooh et al., 2016), soybean waste (Kooh et al., 2016), walnut sawdust (Ferrero, 2007), powdered rubber leaves (Khalid et al., 2015), Shorea dasyphylla sawdust (Hanafiah et al., 2012), rambutan seed (Lakkaboyana et al., 2018), prawn shells (Kousha et al., 2015), polymer-clay nanocomposites (El-Hamshary et al., 2020), and pectin (Shahrin et al., 2021). With this library of data, it is now possible to begin to relate the adsorption behavior of AB25 to the specific surface characteristics of each agricultural waste. Several functional surface groups are present on various agricultural wastes, that are relevant in their adsorption characteristics. For example, there can be carboxylic acid (–COOH), hydroxyl (–OH), carbonyl (–C=O), amine (–NH2), and ester (–O–) groups. In the case of carboxylic acid bound to alkyl and aromatic compounds, the typical pKa is in the range of 3.4 to 4.8 (Zeng et al., 2012). Therefore, at ambient pH, agricultural wastes with carboxylic acid groups, would have a negative net surface charge which could suppress their electrostatic attraction to the negatively charged dyes. This assumption is supported by the low adsorption capacity of AB25, for instance, on cempedak durian peel (Dahri et al., 2016), pine sawdust (Ferrero, 2007), peach seed (Kul et al., 2019), powdered Ficus rasemosa leaves (Jain & Gogate, 2017), Azolla pinnata (Kooh et al., 2016), soybean waste (Kooh et al., 2016), and rambutan seed (Lakkaboyana et al., 2018). This explanation could also apply to other negatively charged dyes such as Acid Green 25 (AG25) on durian peel (DP) (Hameed & Hakimi, 2008), Acid Violet 54 (AV54) on banana peel (BP) (Kumar et al., 2010), Congo red (CR) on BP (Mondal & Kar, 2018), and Acid violet 17 (AV17) on orange peel (Chiou & Chuang, 2006). To further test this assumption, in this study, the adsorptive removal of AB25 on BP and DP was investigated and compared with those reported other agricultural wastes. BP and DP were selected as these two agricultural wastes have been successfully applied as adsorbents for the removal of synthetic dyes (Asbollah et al., 2021; Guiso et al., 2014; Hameed & Hakimi, 2008; Jawad et al., 2018; Mohammed et al., 2012; Mondal & Kar, 2018), physical pollutant (Payus et al., 2021), and heavy metals (Deshmukh et al., 2017). Therefore, the objective of this current study is to evaluate adsorptive removal of AB25 on BP and DP in a batch system and to establish the relevant functional groups, the pH of zero charge (pHpzc), the surface morphology, and surface characteristics of the adsorbents. We aim to relate these to the adsorption behavior of AB25. The kinetics, isotherm, mechanism, maximum capacity, and thermodynamics of the adsorption of AB25 onto BP and DP were analyzed in detail based on the effects of contact time, initial concentration, pH, and temperature. The maximum monolayer adsorption capacity (
Materials and Methods
Preparation of sorbents
Both banana (Musa paradisiaca L.) and durian (Durio zibethinus M.) were obtained from a local market in Brunei. The fruits were peeled, and the peels were chopped into small pieces (less than 2 × 2 cm). They were then put in aluminum trays and dried in an oven at 40°C. After drying, they were ground into a coarse powder using a blender (Zojirushi Mill BM-RT08-GA), then sieved through a 212-μm stainless steel metal mesh to ensure that that the BP and DP have a similar particle size distribution. To prevent atmospheric water adsorption, both adsorbents were kept in sealed plastic bags before use.
Characterization of adsorbents
The functional surface groups of BP and DP were identified based on their vibrational spectra obtained using an FTIR Prestige-21 spectrometer (Shimadzu). The spectra were recorded using the KBR pellet technique over the full frequency range of the spectrometer (4000−400 cm−1) to test for the presence of all possible organic functional groups on the adsorbent surface. The surface morphology of the adsorbents was assessed by SEM imaging on a JSM-7600F microscope (JEOL) operating at 5.0 kV. Their Brunauer–Emmett–Teller (BET) surface area and Barrett-Joyner-Halenda (BJH) pore volume were determined based on multipoint adsorption-desorption of nitrogen gas using an ASAP 2020 V4.02 surface analyzer (Micromeritics). The adsorption and desorption isotherms were carried out at 77.4 K. The process included degassing and adsorption of N2 from 10−5 atm to atmospheric pressure. Finally, in order to observe the desorption isotherm process, the pressure was reduced from atmospheric pressure to high vacuum. The surface charge of the adsorbents was characterized by monitoring the change in pH of 20 mL (0.1 mol L−1) KNO3 solutions containing 200 mg adsorbent. The initial pH of the KNO3 solutions was adjusted to be in the range of 2 to 12 by adding HCl or NaOH, and their final pH was measured after shaking the suspensions for 24 hours.
AB25 adsorption
AB25 (1-amino-4-anilino-9,10-dioxoanthracene-2-sulfonate sodium salt; C20H13N2NaO5S; CAS# 6408-78-2; MW 416.38 g mol−1) was purchased from Sigma-Aldrich Co. Various concentrations of AB25 in distilled water were prepared by successive dilution of its 1 g L−1 stock solution. Prior to adsorption experiments, absorption spectra of the prepared AB25 solutions were measured in the spectral range of 200 to 800 nm in a 1 cm quartz cuvette cell using a UV-visible spectrophotometer (UV-1900, Shimadzu).
The adsorption of AB25 on BP and DP was carried out using the batch method; where 100 mg of the adsorbents was suspended in 10 mL AB25 solutions (2.40 × 10⁻⁴ mol L−1) in several conical flasks. The suspensions were shaken using an orbital water bath shaker at 100 rpm. After a desired contact time, the adsorption process was terminated, the mixture was vacuum filtered through a filter paper, and absorption spectrum of the supernatant was measured. The initial concentration (
Adsorption kinetics and isotherm
Based on the
Here,


where


where
In order to gain insight into the adsorption mechanism and the distribution of AB25 molecules adsorbed on the BP and DP surfaces, the


where,
The effect of temperature
The thermodynamics of the adsorption process were established based on the effect of temperature on the equilibrium. In this sense, the

where
Adsorbent regeneration
A 100 mL AB25 solution (2.40 × 10⁻⁴ mol L−1) containing suspensions of 1 g of BP or DP was shaken for 180 minutes at room temperature to generate adsorbent that is fully loaded with AB25. After filtration, the spent adsorbent was collected and dried. The spent adsorbent was then divided into three equal fractions, and each of them was soaked in different desorbing agents; 50 mL HCl (0.01 M, pH 2), 50 mL NaOH (0.01 M, pH 12), or 50 mL distilled water. These suspensions were then shaken for 120 minutes at room temperature. Next, the suspensions were vacuum filtrated, followed by drying. The regenerated adsorbents were then recycled and again used for the removal of AB25, following the procedures described in the previous Section. The adsorption-desorption process of AB25 was repeated and adsorption performance of the regenerated BP and DP were tested for several cycles.
Results and Discussion
Functional groups of BP and DP
Figure 1 shows the FTIR spectra of BP and DP before and after AB25 adsorption. For reference, the FTIR spectrum of AB25 is also shown. Before adsorption, the FTIR spectra of BP and DP had similar features, where the main bands were observed at 3400, 2922, 2849, 1733, and 1159 cm−1 which have been assigned to the stretching vibrations of O–H, N–H, C–H, C=O, and C–O (alcohol) or C–N groups, respectively (Dinh et al., 2019; Jawad et al., 2018; Zaidi et al., 2018). There are several low intensity bands at 1648, 1433, and 1065 cm−1 which could be attributed to non-aromatic or unconjugated C=C stretching vibration, C–H bending vibrations, and C–C vibrational modes of conjugated aromatic rings. The spectral bands at 1618 and 1381 cm−1 have been assigned to the bending vibrations of aromatic C–H group and carboxylic acid O–H group (Dinh et al., 2019; Jawad et al., 2018; Zaidi et al., 2018).

FTIR spectra of: (a) BP and (b) DP before (▬) and after (▬) AB25 adsorption, and (c) AB25 (Inset: the molecular structure of AB25).
The FTIR spectra therefore indicate that both BP and DP contain several functional groups with strong hydrogen bonding capabilities, such as COOH, OH, C=O, and NH2 groups. These functional groups on the adsorbent surface can form dipolar and H-bonding interactions with C=O, S=O, and NH2 groups of AB25, through which should make the adsorption of AB25 on the adsorbent surface very efficient. The similar spectral features of BP and DP suggested that these agricultural wastes contained the same functional groups, meaning that AB25 is probably adsorbed on both adsorbents in the same way.
The FTIR spectra of BP and DP were almost unchanged upon the adsorption of AB25, indicating that functional groups of the adsorbents remained intact. Nevertheless, several new minor peaks around 1200 to 1600 cm−1 were clearly observed which could be assigned to either the vibrational bands of AB25 adsorbed on the adsorbent surfaces or the possible peak shift of the adsorbents upon AB25 adsorption. It is also noteworthy that, upon the adsorption of AB25, the OH vibrational band of BP at 3400 cm−1 split into two bands at 3282 and 3582 cm−1 due most likely to active participation of this functional group in AB25 adsorption. Overall, the FTIR spectra indicate that the negatively charged synthetic dye could easily bind to the adsorbents via hydrogen and dipolar bonding interactions.
Surface morphology and surface charge of BP and DP
SEM images (10,000× magnification) of BP and DP are shown in Figure 2. Due to differences in the roughness of the two adsorbents different working distances (WD) were used in order to control the depth of field so that the full field was imaged without aberration. However, the WD is related to the numerical aperture and therefore the resolution of the image. Therefore, for SEM images recorded at different WDs in the range of 0.1 to 0.6 mm (see Figure 2), the pore structures on the surface of BP and DP cannot be directly compared. Nevertheless, the SEM images provide the surface morphology before and after dye adsorption, as reflected by the line profile of a horizontal line-scans passing horizontally (x-axis) through the center of the images. Since the contrast in these images is obviously following the surface topography the line-scans are taken to indicate surface roughness. From these line-scans it is clearly observed that the surface roughness of BP was reduced after AB25 adsorption while for DP it increased after AB25 adsorption. These changes in the surface morphology were also revealed by their surface characteristics, where the BET surface area and BJH pore volume of BP was reduced whereas that of DP increased, as summarized in Table 1. The plot of N2 adsorption and desorption isotherms, as shown in Supplemental Figure S1, indicated that BP and DP contained macroporous structure.

SEM images of (a) BP and (b) DP before (top row) and after AB25 adsorption (bottom row). All images were recorded at the same magnification (10,000×). The scale bars represent 3 µm. The line profiles on top of each image represent horizontal line scans from edge to edge passing through the center of the image.
The BET Surface Area and Pore Size of BP and DP Before and After AB25 Adsorption.

The surface charge characteristic of BP and DP was revealed by plotting their ∆pH versus the initial pH of KNO3 solution, as shown in Supplemental Figure S2. The x-intercept of the plots suggested that pHpzc values of BP and DP were 6.32 and 6.18, respectively, which were within the values reported for a variety of agricultural wastes (Pathak et al., 2017). This finding supports the conclusion that the adsorbents derived from agricultural wastes, in general, have similar functional groups. With respect to the pHpzc values, under the ambient experimental conditions (pH 6.7), the BP and DP surfaces will be negatively-charged due to the deprotonation of their carboxylic acid groups.
AB25 adsorption on BP and DP
Although the adsorption capacity of AB25 in the presence of BP and DP should be affected by the pH of the medium, the adsorption kinetics and isotherm of the synthetic dye were evaluated at ambient pH 6.7. Figure 3 shows the absorption spectra of AB25 solution at different contact times from 0 to 240 minutes. The decrease in absorption intensity resulted from the adsorption of AB25, as demonstrated by the time dependence of
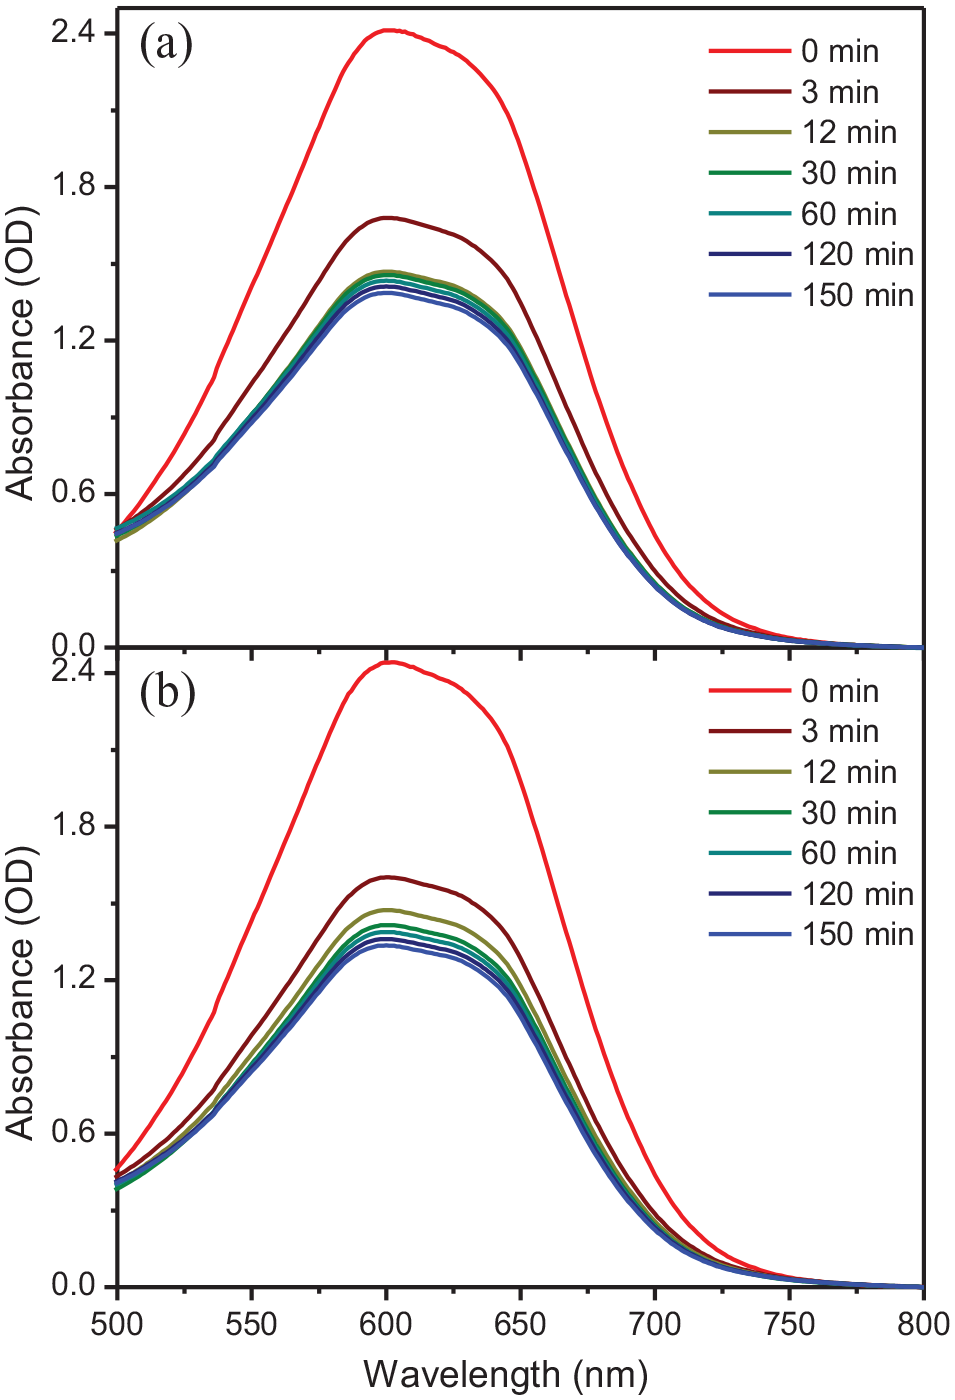
Absorption spectra of 2.40 × 10⁻⁴ mol L−1 AB25 solutions in the presence of (a) 100 mg of BP and (b) 100 mg of DP at different contact times.

Adsorption kinetic data of 2.40 × 10⁻⁴ mol L−1 AB25 solutions in the presence of 100 mg of BP (○) and DP (•) simulated with (a) the Lagergren pseudo-first order, (b) pseudo-second order, (c) the Weber–Morris, and (d) the Boyd model.
The Adsorption Kinetics Parameters of Lagergren Pseudo-First Order and Pseudo-Second Order Kinetics Models on the Experimental Data of AB25 Adsorption on BP and DP.

Figure 4(c) shows the best simulation of the Weber–Morris intraparticle diffusion model on the adsorption kinetic data. The simulation plots showed two linear trends and one breakpoint, suggesting that the adsorption of AB25 occurred in a two-step intraparticle diffusion process. For BP, at early contact times, a fast intraparticle diffusion was observed with a rate of 0.246 mg g−1 minutes−1/2 due to external mass transfer of AB25 onto the BP. This was followed by slower pore-volume diffusion at the equilibrium phase of the reaction with the rate of 0.035 mg g−1. Similarly, a two-step intraparticle diffusion was observed for DP, with the fast and slow diffusion rates being 0.368 and 0.046 mg g−1 minutes−1/2.
It is important to note that the intercept of the Weber–Morris plots deviates from the origin, suggesting the existence of boundary layer effect which could hinder the intraparticle diffusion (Fierro et al., 2008) and that the adsorption process was not solely controlled by the intraparticle diffusion (Dotto & Pinto, 2012). This conclusion was further supported by analyzing the adsorption kinetic data using the Boyd diffusion model in Figure 4(d), where the simulation plots revealed two linear trends with one breakpoint and the intercept of the simulation plots also deviated from the origin. Based on the Boyd diffusion criteria (El-Khaiary & Malash, 2011; Sharma & Das, 2013), these findings indicate that the adsorption of AB25 on BP and DP occurs with a combination of intraparticle and film diffusion mechanisms.
Adsorption isotherms
Figure 5 shows the adsorption isotherms of AB25 on BP and DP simulated using empirical isotherm models. The experimental data points were well simulated by both the Langmuir and Freundlich isotherm models (Figure 5(a) and (b)), whilst they deviated from the simulation plots of the Temkin and Dubinin–Radushkevich isotherm models (Figure 5(c) and (d)). As summarized in Table 3, the linear regression coefficient (R2) values of the fitting lines confirmed that the adsorption mechanism and distribution of AB25 molecules adsorbed on the BP and DP surfaces followed the Langmuir isotherm model. This suggests that AB25 molecules were adsorbed on active sites with homogeneous binding energy as a single monolayer on the adsorbent surface. Using the Dubinin–Radushkevich mean free energy, the average adsorption energy (

Adsorption isotherm data of AB25 solutions with the initial concentrations of 0.24 × 10⁻⁴−4.80 × 10⁻⁴ mol L−1 in the presence of 100 mg of BP (○) and DP (•), simulated with: (a) Langmuir, (b) Freundlich, (c) Temkin, and (d) Dubinin-Radushkevich isotherm models. The solid line represents the best fits of the respective isotherm model.
The Parameters of Simulation Plots of Various Empirical Isotherm Models With Two Parameters on the Experimental Data.

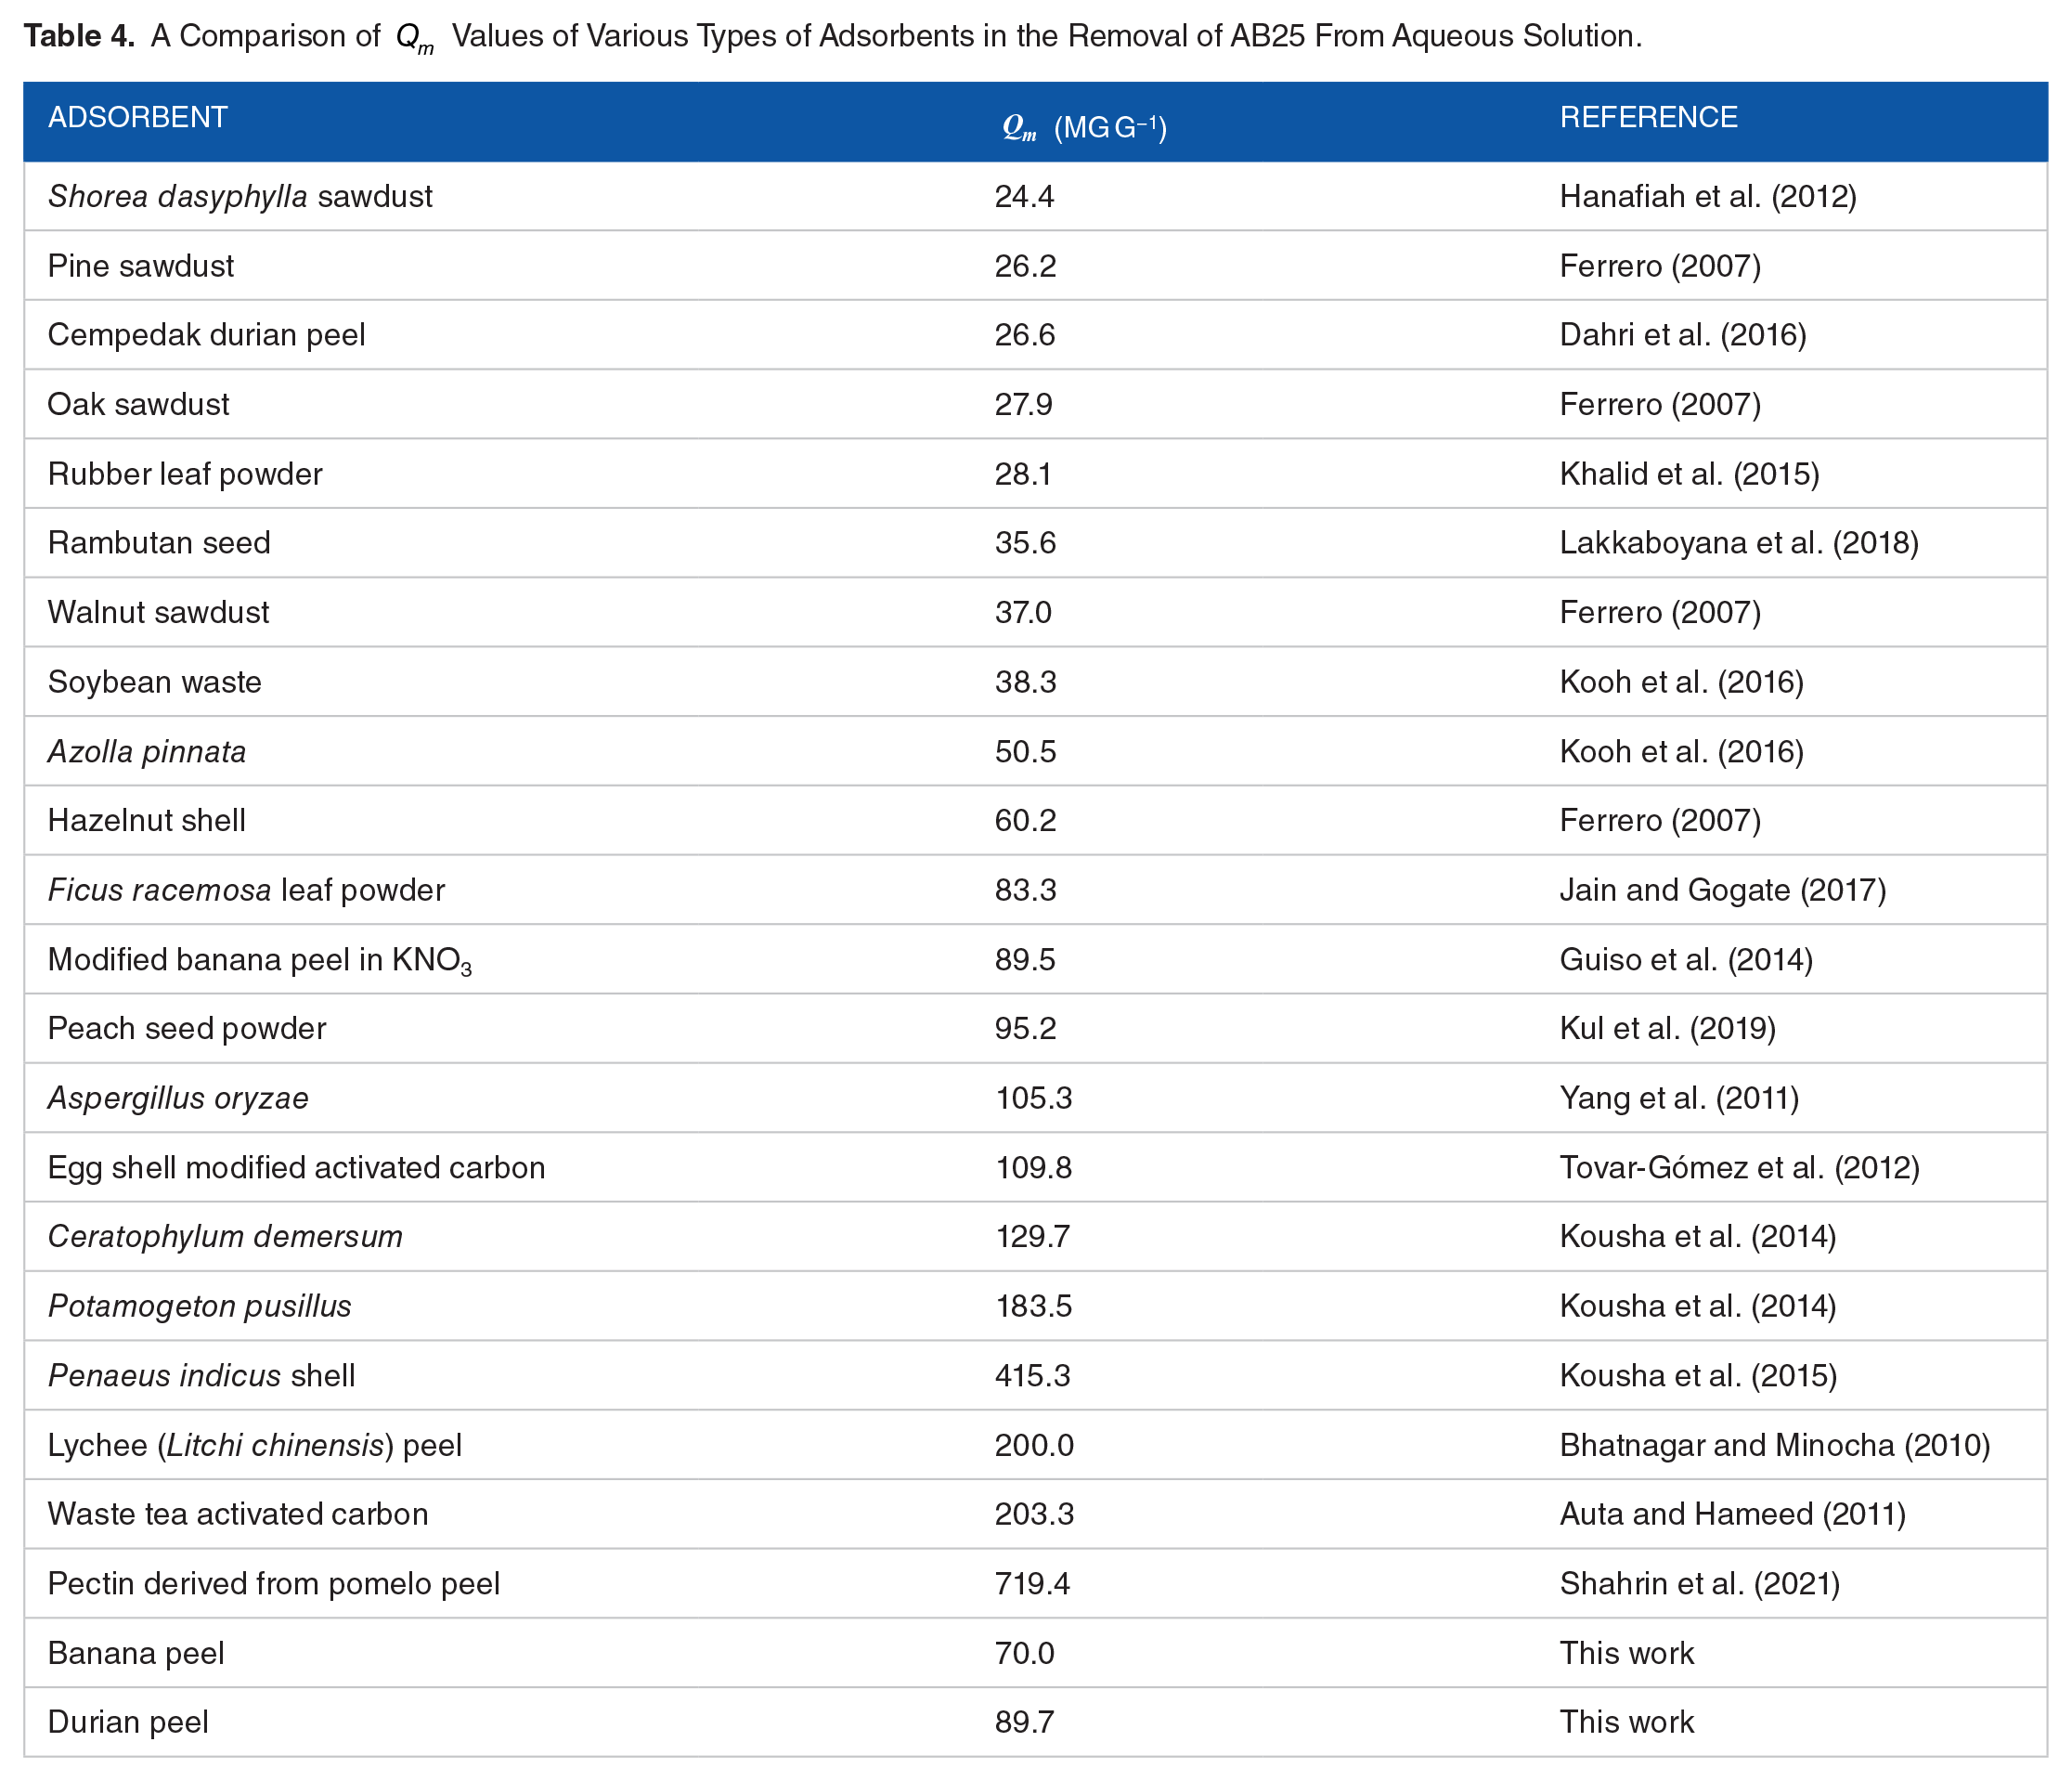
Comparison of
values for adsorption of AB25 on different adsorbents
As the adsorption behavior of AB25 should depend on the functional groups, surface area, and pore size of the adsorbents, it is interesting to compare the
A Comparison of
The effect of pH
In real application, the presence of other chemicals could change the pH of wastewater which would potentially affect the adsorption capacity of adsorbent for synthetic dyes. To simulate this condition, the effect of the pH of the medium on the adsorption of AB25 was evaluated in the range of pH 3 to 10. As shown in Figure 6, at pH 3, the

The effect of pH on the adsorption capacity (

A schematic illustration of the proposed adsorption of AB25 on agricultural wastes.
Thermodynamics of the adsorption of AB25 on BP and DP
The adsorption of AB25 on BP and DP at different temperatures revealed that the

It was found that ∆Gads values were in the range of −14.66 to −14.74 kJ mol−1 and −13.62 to −13.64 kJ mol−1 for the adsorption of AB25 on BP and DP, respectively. The negative ∆Gads values confirm that the adsorption process is spontaneous. From the linear plot of ∆Gads values against
Regeneration of BP and DP
Desorption of AB25 from the spent BP and DP was achieved by washing them in acidic, basic, and aqueous solutions. The regenerated adsorbents were recycled for the removal of AB25 for a few adsorption-desorption cycles. Figure 8 shows that washing the spent adsorbents with acid was the most effective method to regenerate BP and DP, where the

The adsorption capacity (
Conclusions
The adsorption behavior of Acid Blue 25 (AB25) in an aqueous solution onto banana (BP) and durian (DP) peels has been investigated in batch system using a range of different parameters, including contact time, initial concentration, pH, and temperature. The adsorption of AB25 on the two adsorbents showed similar features, where the kinetics was pseudo-second order and was governed by a two-step intraparticle diffusion, attributed to the external mass transfer pore-volume diffusion. The equilibrium adsorption data were well simulated by the Langmuir isotherm model, suggesting that the adsorption occurred on active sites with homogeneous binding energy on the monolayer surface of both adsorbents. The adsorption process of AB25 on BP and DP was spontaneous and exothermic in nature. Increasing the medium pH decreased the adsorption capacity of the two adsorbents, suggesting that electrostatic interactions dominated in the adsorption process. The spent BP and DP were successfully regenerated by acid treatment and they could be recycled for the removal of more AB25. The removal efficiency of AB25 on the regenerated adsorbents decreased by less than 25% after the sixth adsorption-desorption cycle, highlighting the key important role of their functional groups in the adsorption of the anionic synthetic dye. Under ambient conditions, the maximum monolayer adsorption capacity (
Supplemental Material
sj-docx-1-asw-10.1177_11786221211057496 – Supplemental material for Adsorption of Acid Blue 25 on Agricultural Wastes: Efficiency, Kinetics, Mechanism, and Regeneration
Supplemental material, sj-docx-1-asw-10.1177_11786221211057496 for Adsorption of Acid Blue 25 on Agricultural Wastes: Efficiency, Kinetics, Mechanism, and Regeneration by Junaidi H Samat, Nurulizzatul Ningsheh M Shahri, Muhammad Ashrul Abdullah, Nurul Amanina A Suhaimi, Kanya Maharani Padmosoedarso, Eny Kusrini, Abdul Hanif Mahadi, Jonathan Hobley and Anwar Usman in Air, Soil and Water Research
Footnotes
Acknowledgements
Dr. Eny Kusrini is thankful to Universitas Indonesia for PUTI Q2 Research Grant No. NKB4312/UN2.RST/HKP.05.00/2020, and Dr. Jonathan Hobley is grateful to National Cheng Kung University NCKU90 for providing his Distinguished Visiting Scientist position.
Credit Author Statement
JHS carried out the adsorption experiments, MAA involved in the sample processing, NAAS, KMP, EK, and AHM contributed in sample characterization, NNMS edited the manuscript, JH analyzed the data, reviewed, and edited the manuscript AU conceptualized, supervised the experiments, interpreted the data, and wrote the manuscript.
Declaration of Conflicting Interests
The author(s) declared no potential conflicts of interest with respect to the research, authorship, and/or publication of this article.
Funding
The author(s) received no financial support for the research, authorship, and/or publication of this article.
Supplemental Material
Supplemental material for this article is available online.
References
Supplementary Material
Please find the following supplemental material available below.
For Open Access articles published under a Creative Commons License, all supplemental material carries the same license as the article it is associated with.
For non-Open Access articles published, all supplemental material carries a non-exclusive license, and permission requests for re-use of supplemental material or any part of supplemental material shall be sent directly to the copyright owner as specified in the copyright notice associated with the article.