
Abstract
A hydrogeochemical relation has been hypothesized through the analyses of physiochemical data of a fractured volcanic rock aquifer located in the Lower Baringo Basin, Kenyan Rift. Data sets included 15 individual metrics determined in 42 dry and wet season water samples obtained from 6 boreholes in the area. Aquifer evolutionary theory was postulated using sequential principal component analysis (PCA) and hierarchical cluster analysis. To eliminate the effects of scale dimensionality, PCA decomposed the variable data into 4 factors, namely, electrical conductivity, salinity, alkalinity, and carbonate equilibrium with external pH control for the dry season and salinity, carbonate equilibrium with external pH control, alkalinity, and electrical conductivity for the wet season. The main result depicted a major shift in the variability factor from electrolytic conductivity (34.8%) in the dry season to salinity (23.5%) in the wet season. Ward’s linkage cluster analysis partitioned the aquifer into 2 spatially discrete associations; the western and the eastern entities, respectively, in spite of their shared recharge area. These agglomerative scheduling validated in an integrative approach (with groundwater flow predictions using a calibrated petrophysical groundwater model for the area) linked the 4 factors to aquifer processes and 3 pathways: fault permeability, weathering processes, and water-rock interaction. Statistical approaches are, therefore, useful in the conceptualization of pollutant sources and their attenuation for effective groundwater quality management.
Introduction
Groundwater quality deterioration is a fundamental concern world over. Its quality characteristics in sub-Saharan Africa exhibit a wide spatial and temporal variability.1,2 The high volcanic fluoride (>1.5 mg/L) according to World Health Organization 3 depicts widespread variability in groundwater aquifers of the African Rift.4,5 Continued urbanization is also rapidly causing increasingly poorer quality groundwater.1,2 However, the resource is strategically most reliable to exterminate the emergent demand. 2 Improved hydrochemical characterization of aquifers in such highly heterogeneous areas, decoupling the relation between groundwater quality and aquifer lithology, could enhance their effective management.6-8 Pazand 9 observed that sustainable development and management of the quality of groundwater resources in arid and semi-arid lands is achievable through improved understanding of geochemical evolution and groundwater processes.
The determination of groundwater evolutionary processes concerning groundwater quality in fractured confined aquifers is complex. Large field experimental and geochemical laboratory data sets require proper management, elaboration, and interpretation tools and techniques. 6 Güler et al 10 noted that the interpretation of associations exclusively based on graphical techniques is fraught with difficulties owing to the simultaneous nature of aquifer processes and their effects. Recent studies by Nwankwoala, 11 Pazand, 9 Moghimi, 12 and Rotiroti et al 6 established the value of multivariate techniques such as principal component analysis (PCA) and hierarchical clustering analysis (HCA) in the provision of quantitative measures of correlation between water quality parameters and fundamental aquifer processes. PCA is widely utilized to characterize groundwater pollution sources, 9 while HCA is used to deduce spatial variability among sampling sites. 13 An integrative application of PCA and HCA was employed by Rotiroti et al 6 and Moghimi 12 to interpret processes affecting groundwater hydrochemistry and by Yidana et al, 7 to evaluate evolutionary trends of groundwater dynamics and by Majeed et al 14 to assess spatial patterns of pollutants in water. Several investigators15,16 utilized z-score or log conversions to normalize physical and chemical data acquired from groundwater sources. However, Everitt et al 17 noted that such transformations could eliminate legitimate data values from the analysis. It is therefore suggested that Ward’s Linkage agglomeration procedure could automatically rescale metric data into a range and yield good recovery of clusters.
Despite the significance of groundwater, 2 the reported high fluoride variability,4,5 and emergent urbanization1,2 in the region, knowledge on groundwater evolution and quality remain elusive. In this study, we postulate an evolutionary trend of a fractured volcanic aquifer based on multivariate statistics of groundwater quality data of the area. These joint hydrochemical evaluations of relationships among deep groundwater wells and time-series groundwater quality variations are a fundamental step needed vis-à-vis variability in groundwater processes.
Materials and Methods
Study area
The Olbanita aquifer system is located in the lower Baringo basin of the Kenyan Rift (Figure 1). It is characterized by proximity to the equator and by its elevation which ranges from 1750 meters to 1880 meters above sea level. According to National Council for Population and Development, 18 the demographic profile for Nakuru County (wherein the Olbanita aquifer system is located) in 2009 was 1 602 637 and is projected to increase to 2 400 367 in 2030 and 3 013 869 in 2050. The city of Nakuru, situated in the upper Lake Nakuru Basin in the south, relies heavily on the 8 wells drilled in the adjacent Lower Baringo basin for potable water supply. As noted by GOK, 19 water availability problems in the greater Nakuru and Baringo basins had negatively impacted on resident communities and the regional gross domestic product. Within the city, where the abstracted water is used, high incidences of diarrhoeal infections become significant within the overall disease burden. 20

Location of Olbanita aquifer in Kenya showing sampled boreholes (blue circled dots).
The hydrogeology of the area comprises fractured and weathered volcanic rocks and lacustrine sediments. The weathered tuffs sandwiched between the Samburu basalts and the Wasagess flows (phonolites and trachytes) of the Rumuruti group form the best aquifers in Olbanita area. The near N-S trending fault systems interrupting the aquifer system at 5 sites provide groundwater high porosity pathways. At a regional semi-arid climate, the open-faulted drainage, together with the semi-arid climate, renders groundwater in the area indispensable for human subsistence. The confined aquifer in the area recharges from the high altitude areas of Bahati (east of the area) and Menengai, where ecological conditions permit households to grow coffee, tomato, and maize as high-value enterprises.
Sampling and analysis methods
The sampling design in this study involved 6 out of 8 sampling sites constituted of boreholes in the Olbanita aquifer system located in the Kenya Rift (Figure 1). The sampling sites were located using a Garmin GPSmap60CSx model. At each sampling site, 4 replicate samples were taken monthly in 250-mL high-density plastic bottles which had already been precleaned by using concentrated nitric acid and drenched in deionized water. The samples were screened through Millipore membrane filters of pore size 0.2 micrometers to remove suspended solids. Thereafter, the water samples for sulfate analysis were precipitated using 0.2 M Zn(CH3COO)2 while samples for metal analysis were acidified in concentrated HCl or
To evaluate the appropriateness of geochemical data for factor analysis, Kaiser-Mayer-Olkin (KMO) measure of sampling adequacy and Barlett’s test of sphericity were performed.22,23 The KMO index was found to be 0.6 indicating a moderate degree of correlation among the variables could be appropriately carried out. In addition, Barlett’s test of sphericity was significant (Bartlett χ2 = .570, 66 df, P < .001), confirming the suitability of factor analysis on the data collected in this study. The results of the assessment depict a lower number of variables (factors) that may be used to elucidate the variability in the hydrochemical data. The correlation matrix was further inspected for correlation coefficients greater than 0.3. 24 Statistically significant correlations in physical-chemical data sets for each season were identified through the application of the Spearman’s rho for nonnormally distributed data. Most of the correlation coefficients are over 0.3 indicating that factor analysis may be utilized to provide significant reductions in data dimensionality. Helsel 25 and Rangeti et al 26 warn about the dangers of such simplified substitutions for nondetectable concentrations (by using numerical surrogates such as one-half the detection limit). Data were, therefore, automatically rescaled for HCA (because each predictor variable adopted a different scale of measurement), though exempted data sets for PCA. The laboratory geochemical data sets were utilized for PCA considering that the bottom-line correlation matrix (based on the Spearman rank) has the effect of standardizing the variable data. 27 Therefore, it is a more robust estimation technique that is less responsive to outliers compared with the widely used Pearson correlation matrix. 27
Groundwater quality data were further subjected to PCA and HCA. All statistical computations were executed using of MS Excel spreadsheet and SPSS software version 20.0. For the PCA matrix, orthogonalization of factors was based on the rotated varimax method (with significant eigenvalue loadings > ±0.5) and a derived scree plot (with the criterion of eigenvalues >1) was inspected for purposes of extracting varifactors. 28 For HCA, the software’s algorithm utilized Euclidean distances and “sum of squared errors” to minimize the criterion function.
Results and Discussion
General consideration of data sets
Based on the test of skewness which uses the arithmetic mean and standard deviation, the physical-chemical parameters such as total dissolved solids (TDS), pH, electrical conductivity (EC), and the ions such as Cl−, Na+, F−, Ca2+,
Descriptive statistical data for all the parameters for the sampling period (n = 6, N = 42).

Units: ppm (except for pH and EC. EC in μS/cm).
To offset the effects on mineral dissolution caused by dilution by meteoric waters from the analyses, seasonal data sets were analyzed independently. The initial step in the analysis was to account for the extent of mutual variability between individual pairs of water quality variables during the separate seasons. The inter-item correlation matrix of the measured parameters during the dry season and the wet season is provided in Tables 2 and 5, respectively.
Spearman rank correlation coefficients of the physicochemical parameters of groundwater for the dry season (November 2017–February 2018).

The strong correlations between variables are specified by coefficients in bold fonts.
Correlation is significant at α = 0.05 level (2-tailed).
Correlation is significant at α = 0.01 level (2-tailed).
Generally, the rotated component matrix was found to contain both positive and negative loadings (Tables 4 and 7). The work of Liu et al 30 as enumerated in Mohapatra et al 31 observed that eigenvalue loadings near ±1 designate a strong association between a variable and a principal component (PC); eigenvalues exceeding ±0.75 represent strong correlation, eigenvalues between ±0.5 and ±0.74 represent moderate correlation and those approaching 0 depict weak correlations. Each PC was attributed to a process owing to which the corresponding variables are probably linearly linked. The underlying processes occurring within the aquifer as construed from the consequent eigenvalue loadings are presented in Tables 4 and 7 where significant eigenvalue loadings are indicated by using the * mark.
Dry season water quality parameters
For the dry season data, the pairs pH-F, TDS-EC, TDS-CO2, TDS-HCO3, EC-CO2, EC-HCO3, Cl-SO4, Ca-K, Ca-NH4, F-NH4, CO2-HCO3, as well as HCO3-CO3 showed strongly significant relationships. The pairs pH-Na, pH-Ca, pH-H2CO3, pH-NH4, TDS-Na, EC-Na, K-Cl, Cl-CO2, Cl-HCO3, Na-F, Na-HCO3, S04-CO2, S04-HCO3, Ca-F, NH4-H2CO3, and HCO3-H2S depicted moderate correlations (Table 2).
Principal components extracted
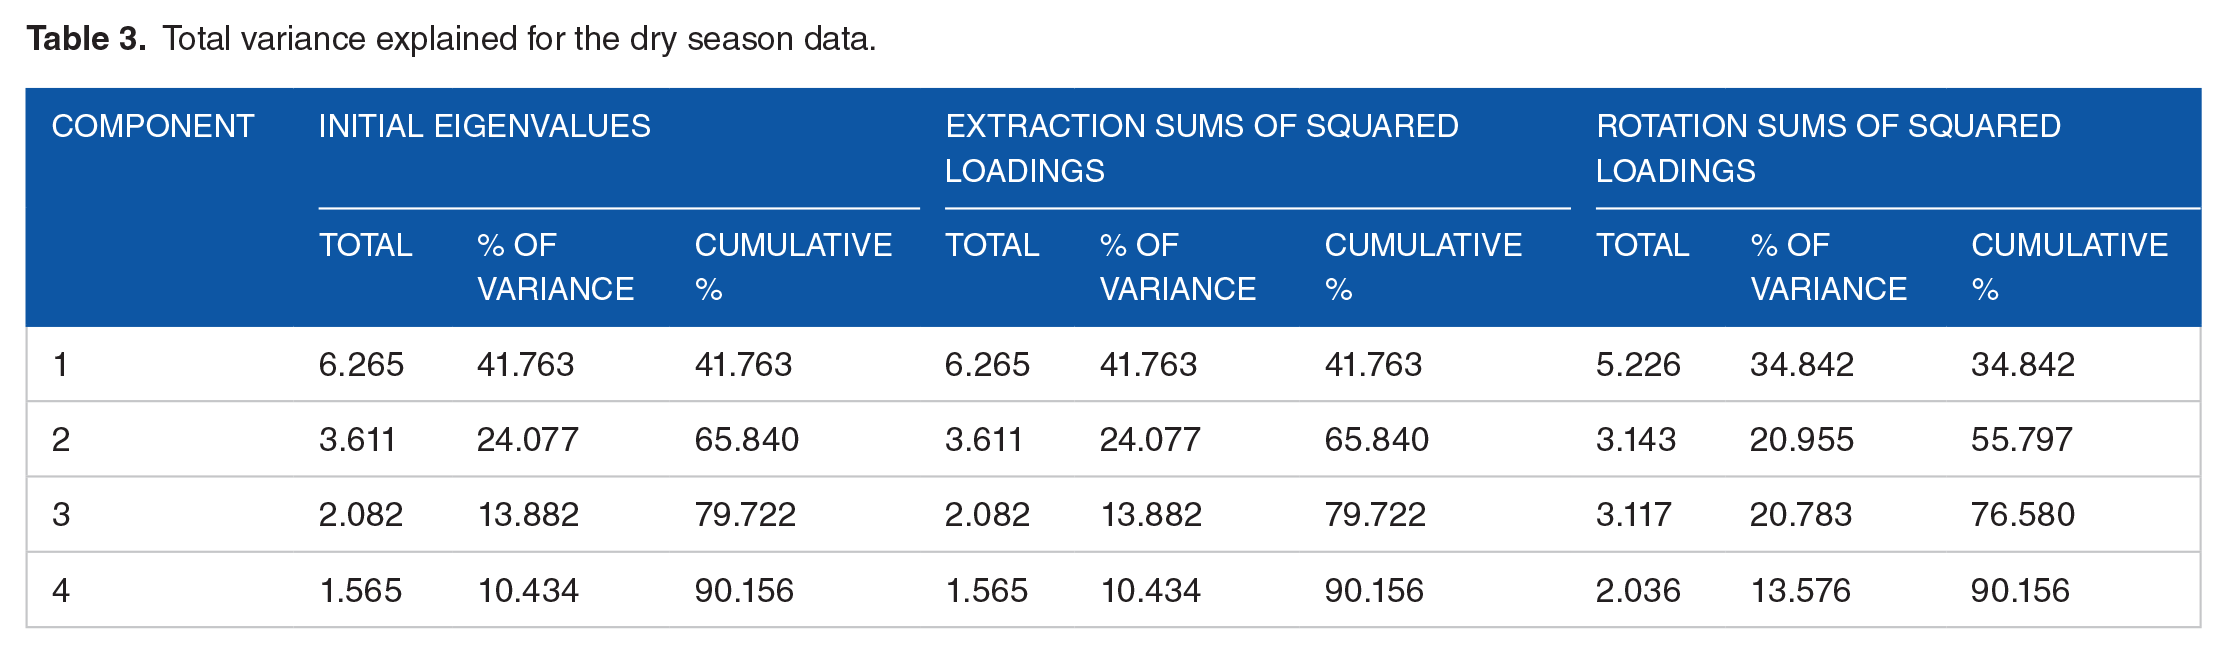
Based on the eigenvalues > 1 criterion, 4 principal components explained variability in groundwater quality at the site (Figure 2). Based on the cumulative variance of the rotation sums of squared loadings of the dry season, the retained latent constructs account for 90.1% of the variance in the data set (Table 3). PC1 with the largest eigenvalue accounted for a maximum of the total variability (34.8%). PC 2 accounted for the total variation of 21%. The third PC explained 20.8% of the total variance, whereas final PC explained 13.6% of the remaining variation in the data. Observed eigenvalue decomposition corresponds to earlier observations by Hossain et al 32 that after the first PC, the second PC explains the greatest of the residual variance and so forth.

Cattel scree plot with eigenvalues > 1 criteria.
Total variance explained for the dry season data.
Extracted factor loadings of the measured parameters during the dry season which suited the provisions of orthogonal varimax rotation.

Note: Significant eigenvalue loadings are indicated by using the * mark.
The first principal component, PC1 (the conductivity component), is associated with significantly high concentrations of electrolytic ions indicated by TDS, EC, Na+, Cl−,
The second principal component, PC 2 (the salinity component), is depicted mainly by Cl−,
The third principal component, PC 3, is the alkalinity component indicated by pH, and Na+, F−, H2CO3, and
The fourth PC represents carbonate equilibrium with exogenic pH control. The external factor controlling pH is H2S. Sulfide in borehole waters is probably due to inorganic and bacterial changes in the deep aquifer under low dissolved oxygen, optimum growth range in pH (between 5.5 and 8.5) and optimum temperature (between 24°C and 42°C). Besides the authigenic derivation, meteoric waters may also leach agricultural
Wet season water quality parameters
During the wet sampling season, the pairs pH-F, pH-H2CO3, pH-CO3, TDS-EC, Na-F, F-H2CO3, F-CO3, CO2-H2CO3, and H2CO3-CO3 showed strong positive correlations at α = 0.01 (Table 5). The pairs pH-Na, pH-NH3, TDS-Cl, TDS-Na, TDS-F, EC-Cl, EC-Na, Cl-Na, K-Cl, Na-CO3, SO4-CO2, SO4-HCO3, SO4-H2S, Ca-F, Ca-CO2, and Ca-NH4 depicted moderate correlations at α = 0.01.
Spearman rank correlation coefficients for physiochemical parameters of groundwater for the wet season (March-May 2018).

The strong correlations between variables are specified by coefficients in bold fonts.
Correlation is significant at the .05 level (2-tailed).
Correlation is significant at the .01 level (2-tailed).
Principal components extracted
Based on the cumulative variance of the rotation sums of squared loadings of the wet season, the retained latent constructs account for 91.1% of the variability of the data set (Table 6).
Cumulative variance explained for the wet season data.

PC1 with the largest eigenvalue accounted for the maximum of the total variability (23.5%). PC 2 accounted for the total variation of 22.8% and corresponds in concept to the first PC. The third and fourth PCs explained 22.8% and 22% of the total variance, respectively. Cattel’s scree test plot is presented in Figure 2.
The first principal component, PC1 (the salinity component), is depicted mainly by K+, Ca2+, Cl−,
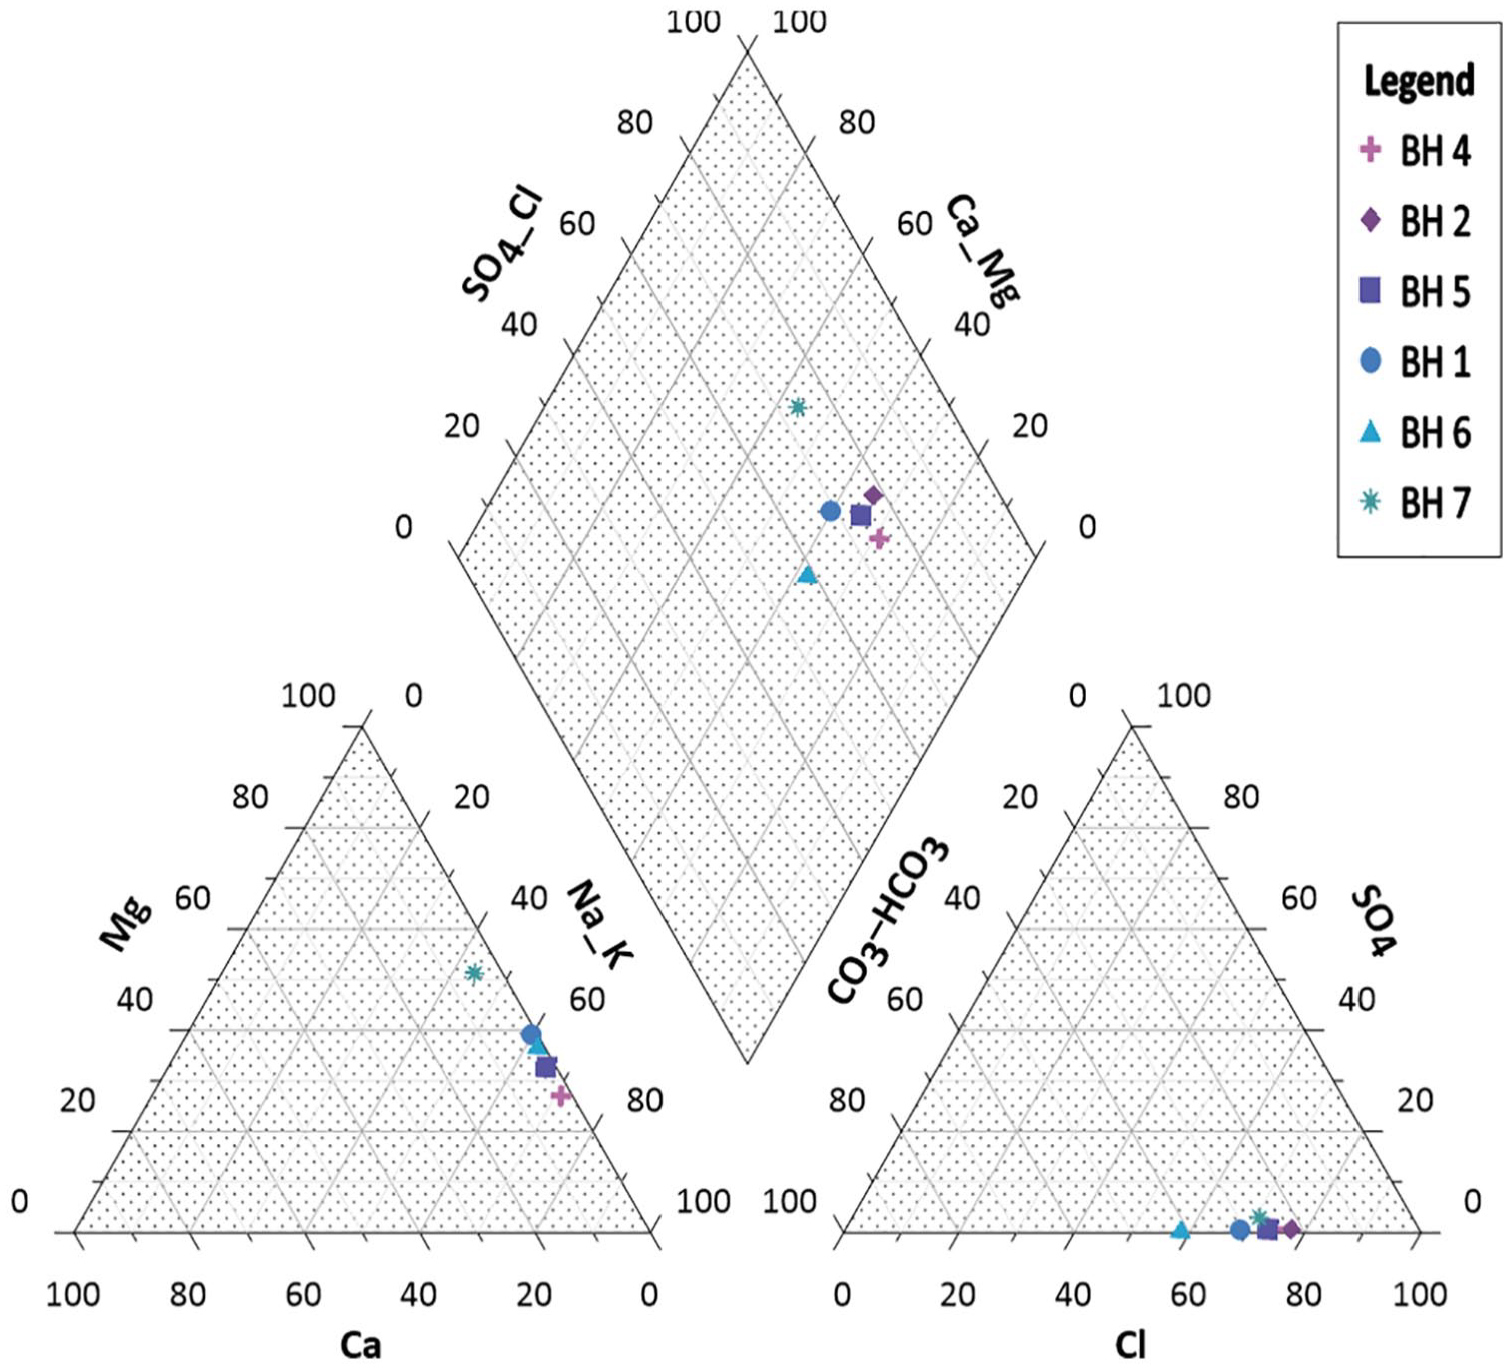
Major composition in groundwater during the wet season.
The factor loadings of the measured parameters during the wet season which suited the provisions of orthogonal varimax rotation.

Note: Significant eigenvalue loadings are indicated by using the * mark.
The second principal component, PC 2, depicts carbonate equilibrium with external pH control. The external factors controlling pH are
The third principal component, PC 3, is the alkalinity component as indicated by pH,
The fourth PC is the electrolytic conductivity component which is associated with significantly high concentrations of electrolytic ions indicated by TDS, EC, Na+, and F−. Statistical analyses (eg, Pazand 9 ) associate F− with weathering of the fluoro-apatite and silicate mineralogy, whereas Moghimi 12 linked Na+ with the dissolution or weathering of sodium-rich plagioclases (clay mineralogy) or the dissolution of halide. The strong correlation observed between Na+ and F− (+ 0.9) and the weak association between Na+ and Cl− (–0.6) supports weathering plagioclase feldspars as the chief source as opposed to the dissolution of halide. Na and F ions are the intrinsic constructs responsible for electrolytic conduction, as supported by their strong correlations with TDS. Within the hydrogeological framework, the pattern and, therefore, the provenance of weathering can be accounted for by the roughly N-S fracture-fissure zones. The component accounts for the lowest variability because of the reduced residence time of groundwater during the wet season exerting substantial reduction in TDS.
The dry to wet seasonal shift in variability from electrolytic conduction to low alkali salinity, respectively, is probably due to differential seasonal rates of weathering, flow and dilution processes in the aquifer. Significant correlations (at α = 0.01) in the pairs Cl-SO4, Ca-K, Ca-NH3, F-NH3, CO2-HCO3, HCO3-CO3, Na-F, and F-H2CO3 indicate that the water is alkaline to mildly acidic which are a manifestation of authigenic and to a lesser scale anthropogenic imprints. Key groundwater evolutionary trends suggest that silicate, carbonate, and/or accessory mineral apatite dissolution, as well as ion exchange at sorption sites with the clay-water interface, are the central sources of variability in the groundwater chemistry of the aquifer. Protracted mobility of oxygen-saturated water in the wet season, probably conditioned seasonal by
Spatial variability between sampling sites
The results of hierarchical clustering procedures were discrete clusters presented graphically in the form of a dendrogram by an averaging algorithm (Figure 4).

Dendrogram for clustering of groundwater sampling sites using the Euclidean distance metric (Ward’s method).
Based on rescaled Euclidean distances and the “sums of squared errors,” 2 main borehole clusters are conspicuous in the area. {Where to “prune” the tree (eg, using the continuous bold lines) is a vital factor in interpreting the results of the analysis. The within-cluster medium depict translational invariance in sample composition. Alternate shading was thus introduced to facilitate review}. The first cluster (forming the left-hand group) consists of the western zone cases (boreholes 2, 3, 4, 5 and 6), whereas the second cluster (forming the right-hand group) consists of the eastern zone borehole cases (boreholes 1, 7, and 7A). The former boreholes were deciphered to be hydraulically connected by a major inferred north west – south east fault which corresponds to a calibrated transmissivity-formation resistivity model for the aquifer. Intrinsic permeability was empirically elevated along major fracture traces, consequently increasing yields of the affected boreholes. In addition, some wet season samples obtained from boreholes 4 (sample Nos. 27 and 33), 5 (sample Nos. 28, 34 and 40), and 6 (sample Nos. 29, 35 and 41) formed a mini-cluster within the former main group. The samples represent the effects of a high permeability fault/fracture structure which accentuates deep circulation of oxygen-saturated waters from recent precipitation events coupled with dilution within the corresponding season. We suggested low residence times of groundwater in the zone. Worth noting was the strong indication of low-carbonate alkali to mildly acidic mixed waters in the western zone at BH 6, which transits to become Ca-Mg sulfate and/or chloride water types of at BH 7 in the eastern periphery in the wet season.
The latter cluster contains boreholes located in the eastern compartment of the aquifer. Elevated values of Cl−,
Conclusions
PCA and HCA are robust methods for establishing aquifer evolutionary structures. In this study, the PCA technique condensed multidimensional data into factors that explained seasonal variability in groundwater aquifer trends and quality. The dry to wet seasonal shift in variability from electrolytic conduction to salinity, respectively, is probably due to differential seasonal rates of weathering, flow, and dilution processes in the aquifer. The authors believe that key groundwater evolutionary trends, water-rock interactions, as well as ion exchange at sorption sites with the clay-water interface are the central restrictions of groundwater chemistry variability. HCA partitioned the aquifer into 2 discrete spatial associations, in spite of their indicated shared recharge area. These agglomerative scheduling validated in an integrative approach (with groundwater flow predictions using a calibrated petrophysical groundwater model for the area), linked each aquifer compartment to aquifer spatial heterogeneities and processes. The authors incontrovertibly deciphered groundwater residence periods for each compartment, diminutive for the western zone and protracted for the eastern zone. It is convincingly essential, therefore, based on pH shifts per season to design a groundwater quality monitoring plan and policy that reduces the number of measured parameters purposely to provide an opportunity cost in terms of resources for measurements elsewhere. A sustainable alternative would be to measure (as surrogates for the presence of the remaining parameters) EC during the dry season and K+, Ca2+, and Cl− during the wet seasons. The additional analyses may be required during extended dry periods accompanied by an upward trend in EC measurements.
Footnotes
Funding:
Declaration of Conflicting Interests:
The author(s) declared no potential conflicts of interest with respect to the research, authorship, and/or publication of this article.
Author Contributions
Conceptualization, B.S. and A.G.; methodology, B.S. and A.G.; software, B.S.; validation, B.S., A.G., S.M. and J.B.; formal analysis, B. S. and A.G.; investigation, B.S.; resources, A.G., S.M. and J.B.; data curation, B.S. and A.G.; writing, B.S.; writing—review and editing, B.S., A.G., S. M., and J.B.; visualization, B.S. and A.G.; supervision, A.G., S.M., and J.B.; project administration, B.S. and S.M.; funding acquisition, A.G., S.M., and J.B.
Data availability
The data sets used and generated in this study are available upon request to