
Abstract
Background:
Circulating rare cells participate in breast cancer evolution as systemic components of the disease and thus, are a source of theranostic information. Exploration of cancer-associated rare cells is in its infancy.
Objectives:
We aimed to investigate and classify abnormalities in the circulating rare cell population among early-stage breast cancer patients using fluorescence marker identification and cytomorphology. In addition, we sought to determine the dependency of these markers on the presence of tumors.
Design:
We evaluated the validity of a multi-rare-cell detection platform and demonstrated the utility of a specific rare cell subset as a novel approach to characterize the breast cancer system. Sampling was conducted both before and after tumor resection.
Methods:
Linearity of the Rarmax platform was established using a spike-in approach. The platform includes red blood cell lysis, leukocyte depletion and high-resolution fluorescence image recording. Rare cell analysis was conducted on 28 samples (before and after surgery) from 14 patients with breast cancer, 20 healthy volunteers and 9 noncancer control volunteers. In-depth identification of rare cells, including circulating tumor cells, endothelial-like cells, erythroblasts, and inflammation-associated cells, was performed using a phenotype and morphology-based classification system.
Results:
The platform performed linearly over a range of 5 to 950 spiked cells, with an average recovery of 84.6%. Circulating epithelial and endothelial-like cell subsets have been demonstrated to be associated with or independent of cancer with tumor presence. Furthermore, certain cell profile patterns may be associated with treatment-related adverse effects. The sensitivity in detecting tumor-presence and cancer-associated abnormality before surgery was 43% and 85.7%, respectively, and the specificity was 100% and 96.6%, respectively.
Conclusion:
This study supports the idea of a cancer-associated rare cell abnormality to represent tumor entities as well as systemic cancer. The latter is independent of the apparent clinical cancer.
Keywords
Introduction
Early-stage breast cancer patients undergo treatment with curative intent that commonly includes surgery in combination with adjuvant radiotherapy, chemotherapy, targeted therapy as well as endocrine therapy, when indicated. 1 Although treatment outcomes are generally excellent, a small yet significant fraction in the patient group suffers from cancer recurrence in the long-term. Recurrence rates after curative treatment for breast cancer in long term follow-up greater 5 years may vary from 6% to 22%.2,3 In comparison, the breast cancer incidence in the general population is approximately 0.18% per year. 4 A lack of proven theories for mechanisms behind recurrence in early-stage breast cancer survivors hinders accurate prediction as well as the development of effective strategies to prevent recurrence.5 -7 The systemic or spectrum theory of breast cancer has explanatory value and suggests tumor cell dissemination taking place as early as the onset of the malignancy yet, without causing overt metastasis. 8 The theory is strongly supported by the frequent detection of disseminated tumor cells (DTC) in the bone marrow of early-stage patients, often occurring years prior to clinically significant recurrence.9,10 The theory is reinforced by murine model bone marrow experiments, 11 as well as recent discoveries involving tumor-derived circulating tumor cells (CTC), cell-free circulating tumor DNA, immunological responses, and systemic inflammation in cancer survivors. 6 ,12 -16 In this context, early-stage breast cancers could be defined by loco-regional disease and a chronic systemic cancer component that is either dormant or indolent. This systemic cancer component apparently has the ability to persist independently of the primary tumor and may then be responsible for, or at least promotes, cancer recurrence.
Despite the substantial work, there remains significant potential for further and deeper investigations into the systemic cancer component. Further progress could be made through investigating the circulating rare cell population. 17 This population may include blood-circulating cellular entities that represent localized tumor growth, such as CTC, tumor-associated circulating endothelial cells (CEC), or fusion products between tumor cells and immune cells.18 -23 It also may include nonlocalizable cancer-associated cell types, such as cancer inflammation-related cells, 24 circulating epithelial cells of unknown origin in follow-up25,26 or circulating erythroblasts. 27 Acknowledging the systemic and localized features of circulating rare cells, the idea is gaining traction to assess the overall cancer burden through a comprehensive analysis of these cells referred to as systemic cytology. 28 This method could prove valuable for monitoring treatment responses—particularly postsurgery—tracking chronic systemic cancer during follow-ups, and predicting recurrence at the earliest possible stage. However, investigations into rare cells other than CTC and CEC as well as into their association with cancer or tumor growth are sparse thus, necessitating intensified marker validation and methodological innovation prior to the realization of before mentioned diagnostic potentials. The primary objective of this proof-of-concept study was to present a method and markers for the comprehensive characterization of rare cell populations in early-stage breast cancer patients. We demonstrated that combining fluorescence markers with cytomorphological analysis enhances cellular subtyping and advances the concept of systemic cytology. A liquid biopsy platform designed for detailed analysis of rare cell morphology has been validated. It uses negative selection for enrichment and a staining method that preserves cell viability, all aimed at capturing the most accurate blood-native morphological status. A study design of testing patients before and after surgery was chosen to evaluate the tumor-association of each rare cell marker. Our findings led to the proposition of a specific cancer-associated rare cell panel that was herein denoted as cancer associated systemic abnormality (CASA).
Materials and Methods
Study sample
All methods were performed in accordance with the relevant guidelines and regulations. Histopathology grading followed Bloom-Richardson system. Blood samples were obtained from 20 healthy individuals, denoted as the healthy cohort, 9 noncancer but ill individuals, denoted as noncancer cohort, and 14 predominantly early-stage breast cancer patients, denoted as the cancer cohort. Summarized characteristics of cancer patients are presented in Table 1. Patient-individual data are listed in Supplementary Table S1. A total of 28 blood samples from 14 breast cancer patients were drawn 2 weeks before and 2 to 3 weeks after surgery. All breast cancer patients were therapy-naïve at the time of surgery. The noncancer control cohort comprised a heterogeneous group of 9 individuals with some clinical condition or vague illness without evidence of cancer, including 1 woman with “unwell feeling” and early night-time fatigue; a type II diabetic patient; a man with an unhealthy lifestyle showing slight rare cell abnormality; a 41-year-old man recovering from an acute infection of unknown diagnosis; a 77-year-old man with several comorbidities including type II diabetes, kidney failure requiring hemodialysis, and hypertension; a 73-year-old woman with symptoms of osteoporosis, a 38-year-old woman with chronic pain in the lower spine and showing rare cell abnormality; a 67-year-old obese nondiabetic woman with gout-like symptoms, and a 38-year-old man recovering from mild acute respiratory illness. The healthy control cohort comprised 10 volunteers with an average age of 31.5 years for this study and 10 from a previous study. 24 Healthiness was defined as being free from known medical conditions, not having any illnesses in the past 2 months, and not taking any medications.
Clinicopathological characteristics of patients.

Patient with combination of in situ carcinoma (left) and invasive ductal carcinoma (right).
Cell preparation and spiking
Low passage (<15 rounds of subculture at lab site) colon cancer cell line HCT116 and breast cancer cell line MCF-7 were cultured in fresh flasks containing RPMI 1640 supplemented with 10% fetal calf serum and containing low glucose Dulbecco Modified Eagle Medium supplemented with 10% fetal bovine serum, 2 mM glutamine, 0.01 mg/mL insulin, and 1% penicillin/streptomycin mix, respectively, and were incubated at 37°C in an atmosphere of 5% CO2. Cell suspensions following trypsinization were accepted for use in case of single cell suspensions and viability greater 90%. The antibody staining capacity by anti-EpCam-FITC (clone MH99, Invitrogen) for positive identification and anti-CD45-PE (clone 2D1, Invitrogen) for counter staining was tested prior to spiking. Spike-in counts were assessed depending on the targeted amount. Exactness of spiking concentration for the lowest count of 5 cells was achieved by micro-manipulation as described previously. 29 In brief, model tumor cells were stained using CFSE dye (Cell Division Tracker Kit, BioLegend) diluted to roughly 2 cells per 10 µL in a well of a flat bottom 96-well plate and aspirated under microscope vision at 20× magnification. Exactness of higher spiking concentrations was achieved by respective dilution series and by imitating spike-in sample preparation in at least 3 repeats, then used as counting controls. The model tumor cells were then spiked into 5 to 7 mL whole blood, followed by the normal rare cell enrichment and analysis procedure. Experiments were conducted at different days per each data point, thus incorporating variability in blood specimens as well as tumor cell conditions. Experiments were conducted at least in duplicates. For linearity and sensitivity experiments, the spiking levels were intended to measure 5, 100, 500, and 1000 tumor cells.
Rare cell enrichment
For systemic abnormality analysis, the Rarmax cell-based liquid biopsy platform (Premise Biosystems Co., Ltd., Version 2.2) was used as previously described following the principle of negative selection. 24 In brief, whole blood nucleated cells were preenriched by removing bulk red blood cells and desired rare cells were enriched by removing bulk white blood cells (WBC). The analysis was conducted by automated fluorescence microscopy. In detail, peripheral blood was taken by venous puncture collecting 10 mL in a green-top BD Vacutainer blood collection tube containing sodium heparin. The blood sample was kept at room temperature (RT) in the dark and processed at most 3 hours after phlebotomy. Standard chemical lysis buffer (154 mM NH4Cl, 10 mM NaHCO3, 2 mM EDTA) treatment was applied to remove red blood cells from 7 mL whole blood. The cell suspension was incubated twice at RT for a maximum of 3 to 5 minutes following centrifugation at 300g for another 5 minutes each. The final cell pellet was resuspended in 0.5 mL phosphate-buffered saline (PBS), supplemented with 0.5% bovine serum albumin and allowed resting for 15 minutes at RT. The cell numbers of nucleated cells subsequent to red blood cell lysis were determined by hemocytometer (Neubauer) and subjected to enrichment. In brief, peripheral blood rare cell isolation was carried out by automated CD45 positive cell depletion assay (Walderbach II, SanoLibio Co., Ltd.) following the manufacturer’s description. The automated assay processed leukocyte suspensions ranging from 5 to 100 million cells concentrated in 500 µL samples. It offered leukocyte depletion rates of 1, 3, and 5 log based on 1, 2, or 3 depletion cycles, respectively. We chose 3 log depletion as adequate for our analysis due to processing time and optimal cell recovery. The enrichment process uses anti-CD45 magnetic particles to separate CD45-positive cells in a magnetic field. In the 3 log configuration, the assay took approximately 1 hour and outputs an enriched sample in a volume of approximately 30 µL. Subsequent to enrichment, the sample was split into halves and immediately stained for subsequent analysis by fluorescence microscopy using conjugated monoclonal antibodies anti-CD45-PE (clone 2D1, Invitrogen), anti-EpCam-FITC (clone MH99, Invitrogen) in 1 panel, and anti-CD44-Superbright645 (clone IM7, Invitrogen), anti-CD24-PE (clone SN3, Invitrogen), anti-CD71-FITC (clone OKT9, Invitrogen) and anti-CD45-PercPCy5.5 (clone 2D1, EXBIO) in the second panel, for each using 0.5 µL undiluted dye solution and incubating at RT in the dark for 25 minutes. A washing step followed by diluting the cell suspension with 1 mL PBS, supplemented with 0.5% bovine serum albumin prior to pelleting by centrifugation at 200g for 3 minutes and resuspending in 120 µL using PBS. Nucleus staining followed using 0.5 µL Hoechst 33342 DNA staining (ThermoFischer).
Image acquisition and analysis
The enriched and stained cell suspensions (panel 1 and 2) were aliquoted into 2 flat bottom wells per panel of a 384 well ViewPlate-black plate (PerkinElmer) and monolayered by centrifugation at 80g for 2 minutes which was followed by high-resolution image acquisition at 40× magnification using the Operetta high content imaging system (PerkinElmer). A standard acquisition protocol was used for all samples allowing intra-patient and inter-patient sample comparability. Images were recorded in a bright field channel, and channels according to the fluorescent color choices at optimized and fixed exposure times. Columbus analysis software served as a screening and image analysis tool. Sample analysis followed 2 reader assessments with the first person conducting an image screening step according to a standardized protocol and the second person conducting rare cell identification. Image records per sample comprised 117 fields (color z-stack) per well. Rare cell marker positive cells were identified by a cell-like round formation, specific morphologies as detailed in the “Results” section, positive staining of Hoechst, CD326-FITC or CD71-FITC and/or CD44-SB645 in the absence of the typical ring formation or membrane staining as a consequence of positive CD45-PE or CD45-PerCy5.5 staining. The hematopoietic origin was excluded in case of CD45 signal at background noise level and PE-autofluorescence as identified by dim positive fluorescence signal inside the cellular event and the absence of membrane staining (see Figure s1 in Supplementary Material for clarification). Sample read-out followed the list of cell types as shown in results (Table 2) starting the analysis with EpCam-positive events. The high baseline concentration of CEE in healthy donors sufficed reading of 2 × 20 fields out of the 117 fields then extrapolating the concentration to 3.5 mL per panel and finally normalizing to our standard of 5 mL. All other cells were read through the entire collection of fields. For the assessment of positivity of epithelial events as lead markers, the maximum fluorescence emission needed to exceed 2× standard deviation (SD) levels above averaged background noise (statistically significant number of pixels probed at “empty space” nearby the object) and being visible strictly within boundaries of the bright field appearance. Consequently, dim fluorescence emission ranged in signal to background ratio between 1.05 and 1.5, low fluorescence between 1.5 and 1.8 and high fluorescence emission ranged greater 1.8. Endothelial-like cells were recognized by the CD45-negative cell status and significance in morphology. The significance was linked to sizes larger than the diameters of WBC, which exceed 11 µm. The targeted cell shapes displayed typical characteristics such as a cobblestone-like appearance, clusters, spindle shapes, or sheet-like structures (see Figure S2 for more details). Nuclei were variably located relative to the cell center, characterized by large nuclei that often appeared oval rather than round, with some showing elongated or bean-shaped configurations. The ratio of nucleus to cytoplasm may not surpass 0.6. Blast cell-like cell shapes were excluded. Image analysis of inflammation-mediated cells followed previous descriptions. 24 In brief, each circulating inflammatory cell (CIC) was attributed with a value of the morphological index. A value greater than 35 was found to be attributable to malignant disease formerly termed CD44i35; hence, the classification of findings with the CD44/24 phenotype as normal (nCIC) and tumor-associated or abnormal CIC (aCIC). Image analysis of CD71 followed descriptions made previously. 27
Cancer-associated systemic abnormality (CASA) panel.

Endothelial cell identification was based on CD31-positive status prior to clinical study conduct and was replaced by endothelial-specific morphology recognition.
Statistical analysis
For linearity, sensitivity, and accuracy assessment of the Rarmax rare cell detection platform, the NCSS2023 Statistical Software Linear regression and correlation analysis tool was used. Diagnostic performance of the rare cell panel in diagnosing breast cancer was measured using sensitivity, specificity, and predictive values, for abnormality cutoffs of each rare cell type, as defined by the limit of detection equation Limit of Detection (LOD) = mean (limit of blank) + (1.68-2) × SD. The receiver operating characteristic (ROC) curve analysis was performed using the Stata v. 14 statistical software (Stata Corp, College Station, Texas, USA), and the area under the curve (AUC) was calculated along with the 95% confidence interval (CI). Supplementary Tables 2 and 3 contain raw data as source for all calculations of AUC and diagnostic performances as presented in Tables 4 to 6, respectively. Conclusions about differences in concentration between the cancer-naïve and surgically treated cohort as well as between cancer and noncancer cohorts were based on the 1-tailed open paired t test and was calculated using Excel Microsoft. A P-value < .05 was considered statistically significant. The association between each rare cell type and surgical intervention was defined in terms of the response rate, which was defined as the reduction in cell concentration, in percent, after surgery as compared with before surgery. The response was set to 100% if the postsurgery concentration was lower than the cutoff level for that rare cell type, and set as no response if the concentration after surgery was higher than or equal to that before surgery.
Results
Platform reliability
The spike-in experiment outcome was the number of spiked HCT116 or MCF-7 cells in range of 5 to 950 plotted against the recovered number of tumor cells in the healthy donor samples (n = 9). The ratio between the number of observed and the number of expected tumor cells produced a regression slope of 0.89 [95% CI, 0.85-0.94], an intercept of −5.3 (95% CI, -26.8-16.1) (accumulated across 9 data points), and a correlation coefficient (R 2 ) of 0.997. The coefficient of variation remained stable as the number of spiked cells decreased, measured as the standard deviation of recoveries across all spike levels, which was calculated to be 7.61%. The average recovery rate of spiked cells was 84.6% across all spiking levels, with a range from 78% to 92.6%. The precise spiking of very low cell numbers through micro-manipulation performed in triplicate enabled the determination of the lower limit of detection. At the spiking level of 5 to 6 tumor cells, all 3 data points showed a consistent loss of 1 cell into the process implying a near-zero standard deviation for the low-spike. Nonspiked samples were negative resulting in a mean value of zero for the limit of blank. Consequently, the average coefficient of variation across the 9 spiking points was used, which was 7.61% and corresponds to a standard deviation of 0.38 cells per 5 mL at the 5-cell spike level. The LOD was then calculated as 2×SD resulting in a LOD value of 0.76 cells per 5 mL or 1 cell per 6.6 mL. In practical terms, at a given restriction of initial WBC count of 8 × 10⁷ WBC per run due to technical limitations (corresponds to 6.5-20 mL whole blood) and the recovery of 85% on average, the reliable detection of at least 1 tumor cell may require a minimal concentration of 1 cell per 5.6 mL of whole blood. The enrichment platform was configured to 3 log, achieving 2.89 log or 776× depletion on average. Depending on the donor’s WBC count, the maximum was limited to 8 × 10⁷ WBC per sample, suggesting a carryover count of 10 000 to 52 000 WBC. At given performance, the detection of desired cells would be well supported for the retrieval of meaningful diagnostic information in afflicted individuals with an expected concentration range from 1 to several hundred cells per 10 mL. A coarse measure of sustained high sensitivity and platform functionality over the course of test runs was represented by the detection of normoblasts that occur within a detectable concentration range (>1 cell per 5 mL) under healthy physiology with 100% certainty. 30 Therefore, repeated failure to detect normoblasts would predict a platform error. All healthy individuals (n = 10) as measured on occasions throughout the course of clinical sample testing were positive for normoblasts in range of 1 to 21 cells per 5 mL. Platform-related sampling error was measured and expected not to exceed 7%. In practice, 1 error was recorded during clinical study conduct until final drafting comprising 102 sample runs and was ascribed to an operator error while using the same platform version and operator within the same setting.
CASA panel
The CASA denotes the detection of circulating rare cell abnormalities by this platform at concentrations significantly exceeding baseline levels observed in a healthy cohort, as well as the de novo emergence of rare cells or the presence of cytomorphological alterations in these cells (Table 2). The CASA may be related to both physiological and pathological processes 17 and will require further characterization in terms of its relationship with clinical cancer status as well as its presence in healthy individuals. For the purposes of this article, we refer to rare cells in the CASA panel detected in cancer patients whose cancer is present as “cancer-present CASA,” in those with absent clinical cancer after curative surgery as “cancer-absent CASA,” and in noncancer subjects as “cancer-naïve CASA.”
The negative selection method of enrichment elicited a heterogeneous mixture of rare cell types, characterized by phenotypic overlaps among different cell types, especially prevalent at low fluorescence emission levels. For instance, positive EpCam signals are expected to be specific to circulating epithelial cells; however, these signals can also result from co-expression in endothelial cells 21 or from auto-fluorescence in inflammatory or activated cells.31,32 Therefore, the inadequacy of rare cell classification based on phenotyping alone has led us to look deeper into cellular morphology.
Morphological considerations allowed us to identify 6 classes of circulating epithelial cells as shown in Figure 1 and described in Table 3. We use the common term “CTC” in the following to refer to blast-like circulating epithelial cells with the basic EpCam+/CD45−/Hoechst+ phenotype commonly found in cancer patients. Given the noncanonical identification, we consider these cells an abnormality likely related to cancer and investigated their potential tumor origin relative to morphological class. Accordingly, this classification supported distinction between cancer-present and cancer-absent, which appear as “tumor” and “systemic,” respectively, in Table 3 in the row labeled “Cancer association.” A gallery further illustrating the CTC classes can be found in Supplementary Figure S3. It was found useful to classify cellular events with the EpCam+/CD45−/Hoechst+ phenotype that did not meet the morphological criteria of CTC classification as CEE (Table 3).
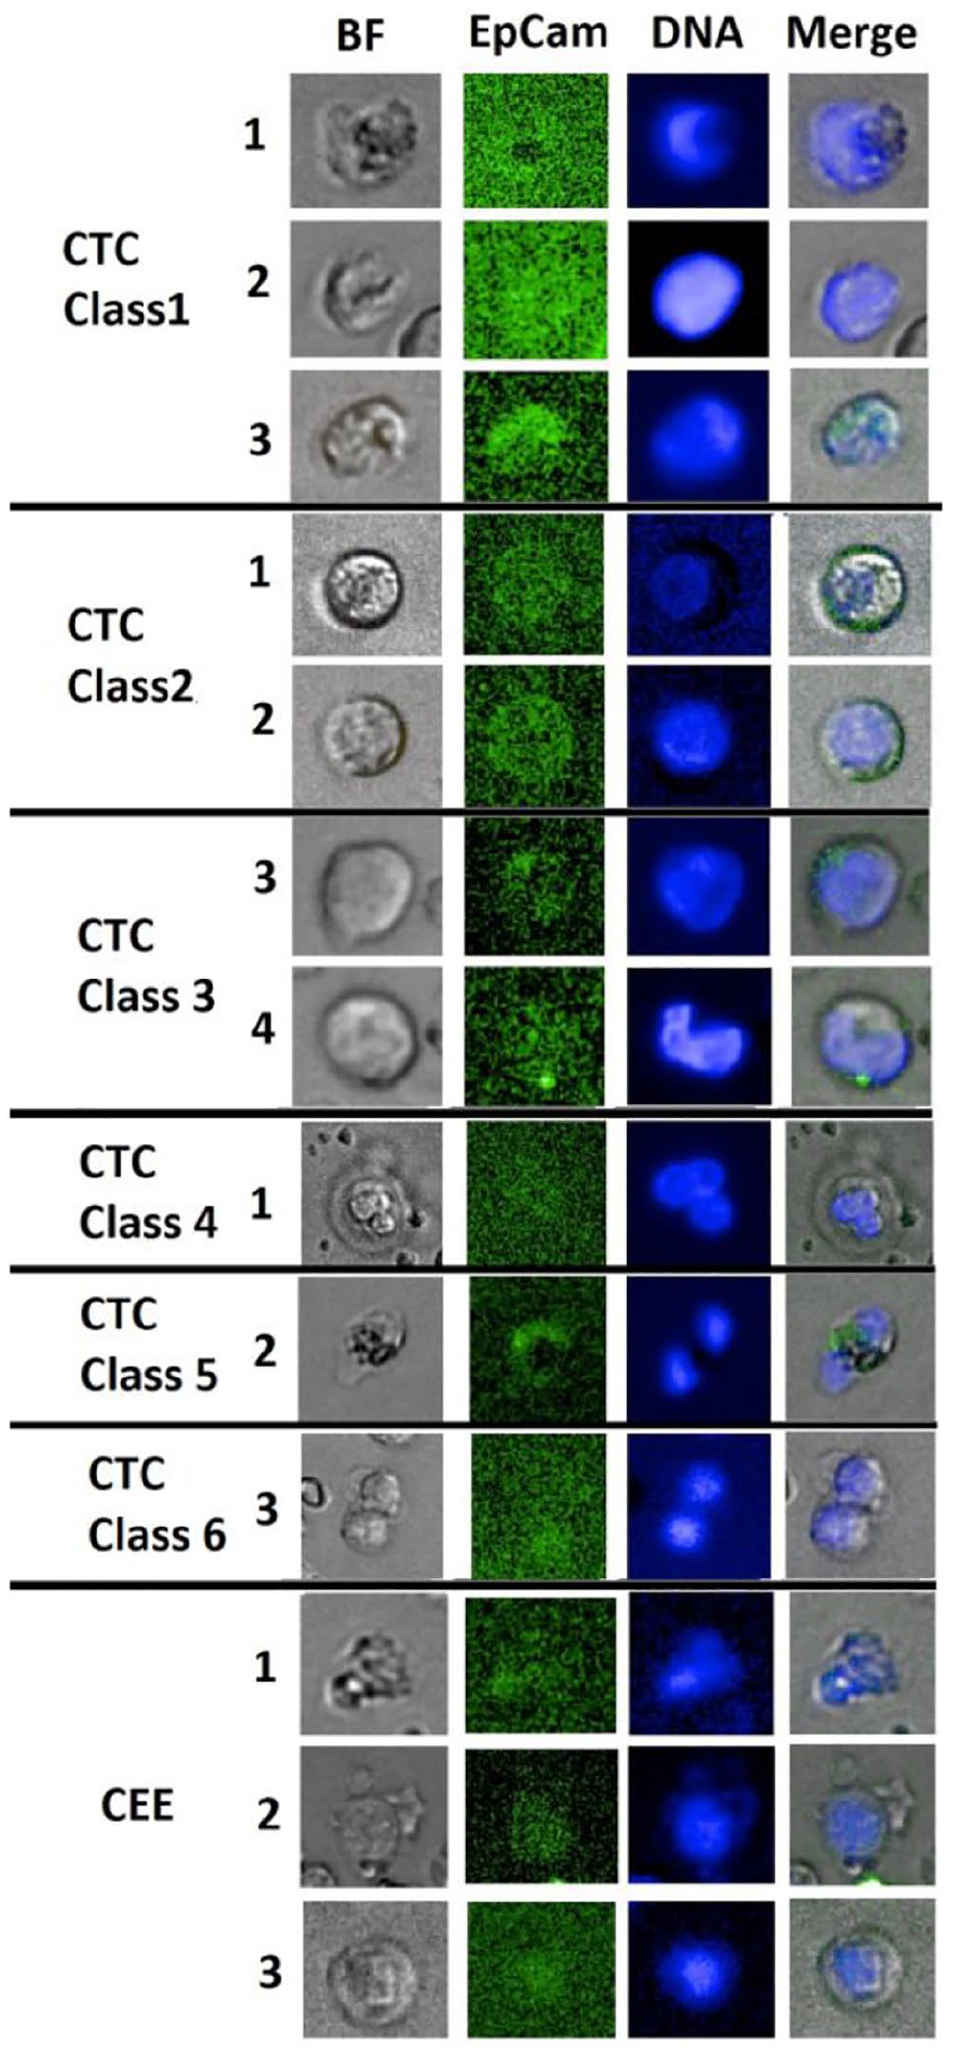
Gallery of circulating cellular epithelial-like events found in the cancer cohort. Cell images 1 to 3 denote class 1 CTC with dim-to-low EpCam signal, N/C ratio greater 0.8, major diameters measuring 13.2, 11.8, and 10.7 µm and less round to oval cell shapes. Cell images 4 to 5 denote class 2 CTC of round cellular shape with low membrane staining, dim-to-low Hoechst intensity, N/C ratio from 0.5 to 0.8, and major diameters 12.9 and 11.2 µm. Cell images 6 to 7 denote class 3 CTC with low EpCam signal patches, N/C ratio of 0.5 to 0.8 and major diameters 12.1 and 10.7 µm. Cell image 8 denotes a class 4 large round CTC with dim EpCam signal, low N/C ratio, nuclear abnormality and a major diameter of 22.3 µm. Cell image 9 denotes a class 5 CTC with bi-nucleation and a low EpCam patch with a major diameter of 15.2 µm. Cell image 10 denotes a class 6 CTC representing mitotic cell pairs or clusters with dim EpCam signal and a major diameter of 17.3 µm. Cell images 11 to 12 denote CEE of various shapes showing dim-to-low EpCam signal overlaps in parts with nuclear location and measuring in major diameter 9.8, 16.6, and 11.8 µm. BF = bright-field.
Morphological identification criteria for circulating epithelial-like cells.

Cell dimension of the complete object (largest diameter).
Positive EpCam signal must not overlap at 100% or be located within the area of Hoechst signal except CTC1 and CEE when both signals are merged.
Pixel intensity description of dim, low and high in the Hoechst channel was defined in ranges by signal to background ratio between 1.05 and 1.5, between 1.5 and 6, and greater 6, respectively.
EpCam signal in rare cells was usually dim or low with intra-cellular or partial membranous distribution and most EpCam-positive cells would not stand out from a background of WBC. A careful and time-consuming inspection of these images would be required for their identification.
The morphology of class 1 CTC was described in literature and herein found distinct enough to classify as a subtype 33 (Figure 1 and Table 3). The identification of a convex shape lends support to the notion of a natural, full-cell nucleus; since an artifactual full nucleus may have been incurred by physical force due to repeated centrifugation prior to imaging analysis. An epithelial event with a full nucleus but with weak and declining Hoechst signal from the center toward the membrane would be considered a necrotic cell and were classified as CEE. Larger cells with an irregular convex shape and clear rims under bright-field microscopy are distinct from cellular artifacts, and were also classified as CEE (see Figure 1). Class 1 CTC events in size range of 7 to 10.5 µm were classified as class 3 CTC. The cutoff in diameter denoted a reader estimation and yielded sufficient specificity as will be shown in the following. The naturally occurring full-cell nucleus could be explained by a cellular process of nucleus expansion, which would increase cellular stability as a counter-measure to increased shear force in the circulation 33 denoting a morphological adaptation to a new and rough environment upon egress from the tumor. This implies that class 1 CTC are included in cancer-present CASA and supports the interpretation as tumor-derived CTC. Evidence for this is provided by the high response rate of over 90% to surgical intervention in 9 out of 14 cancer patients (see Figure 3 and Supplementary Table S3). The difference between pre- and postconcentration levels was significant (P = .005). Additional evidence shows that a class 1 CTC cutoff of 2 cells per 5 mL effectively distinguishes between cancer-present individuals and those who are cancer-absent (surgically removed) or cancer-naïve, demonstrating 64% sensitivity and 98% specificity (AUC = 0.90; 95% CI: 0.79 to 0.99).
Class 2 CTC may correspond to the classic CTC morphology with similarities to those reported by the Cell-Search system and thus deemed suitable for subtyping (Figure 1 and Table 3). Class 2 CTC were frequent in cancer subjects both before and after surgery, but not in noncancer and healthy control cohorts. Thus, class 2 CTC are both cancer-present and cancer-absent CASA, suggesting cancer-associated processes partly independent of the primary cancer.
Class 3 CTC denoted a class that comprehended circulating epithelial cells of all other morphological variations and might benefit from further subtyping in future investigations (Figure 1 and Table 3). Class 3 CTC can be found in cancer subjects both before and after surgery, but can also be found in cancer-naïve subjects. However, the difference between cancer and noncancer control cohorts was significant (P = .006).
Classes 4, 5, and 6 CTC include extremely large, multinucleated cells or seen in pairs or clusters, respectively. These cells were extremely rare in this study and were detected only before surgery. Although this finding seems to be a part of cancer-present CASA and may imply CTC status, the limited data preclude any definitive interpretation.
Based on prior findings, classes 2, 3, and 5 CTC were classified and grouped as cancer-absent CASA. The markers showed variable changes in cell concentration after surgery, averaging 43.8% ± 37.7 in 14 positive patients (without a cutoff). The concentration ranged from 1 to 41 cells, with a median of 7.5 cells per 5 mL before surgery and 6 cells per 5 mL after surgery (P = .075). The relative low significance in difference in concentration levels may suggest usefulness as diagnostic indicators of cancer status, even in the absence of cancer, functioning as cancer-absent CASA (see Figure 3 and Supplementary Table S3). The optimal cutoff at the cell concentration ⩾ 4 cells per 5 mL provides a sensitivity of 71% and a specificity of 93% [AUC = 0.92; 95% CI: 0.85-0.99] when tested against healthy and noncancer subjects.
The CEE exhibit a wide range of cellular and nuclear morphologies (see Figure 1 and Table 3). In cancer patients, CEE includes cells that may not fit into the previously defined CTC classes. Due to this heterogeneity, the specific cell types that make up CEE remain unidentified. Assuming that the EpCam signal is genuine, or caused by auto-fluorescence, nonepithelial cell types with dim or co-expressing EpCam such as endothelial cells and platelets are most likely to be the major cell type in CEE. 21 CEE were detected in all subjects and were indifferent between cancer and noncancer subjects (P = .2) (Supplementary Table S2). The cell concentration in healthy subjects ranged between 41 and 268 cells per 5 mL (average 106.1 cells per 5 mL), in noncancer subjects between 60 and 657 cells per 5 mL (average 295.4 cells per 5 mL), and in cancer subjects before surgery, between 93 and 474 (average 231.9 cells) cells per 5 mL (Figure 3). The usefulness of CEE as a marker of systemic abnormality in general may be indicated by the higher cell concentration above the normal range. The cutoff for the determination of abnormal status regardless of disease severity was estimated using data from the healthy cohort. Using the LOD criterion, which is defined as a minimum of 1.68 × SD, the LOD in healthy subjects was determined to be 223 cells per 5 mL. Therefore, a cutoff of 225 cells per 5 mL was employed in this study and detected abnormality in 6 of the 14 breast cancer subjects before and in 3 of 14 subjects after surgery, respectively, at up to twice the cutoff value showing an overall weak decrease of 55.7% ± 42.8% in CEE concentration after surgery (Supplementary Table S3). Nevertheless, CEE elevation is likely cancer-associated in a cancer patient, given a strong response to surgery in 4 of 6 cancer subjects with elevated CEE concentration before surgery, decreasing to within the normal range after surgery. A follow-up, longitudinal study of an unhealthy, noncancer individual seems to show stable CEE concentration with time (within 1 month), supporting the notion of CEE as a marker of chronic abnormality (data not shown). We therefore declared CEE as cancer-present CASA in the setting of cancer subjects.
The CEC encompass diverse cell subtypes in terms of function and origin. 21 ,34 -37 Some subsets of CEC may originate from a tumor or merely be observed in the context of cancer. The CEC can also derive from bone marrow as part of tissue damage and repair processes, or from lymph nodes, liver or vascular lesions elsewhere in the body. Due to the limited specificity for any particular disease, establishing a direct link between CEC and breast cancer may necessitate extensive understanding of patient comorbidities, detailed cancer characteristics, and possibly identification of single-cell genetic changes typically associated with cancers. 38 The herein proposed morphological classification of CEC aims to enhance cancer specificity in microscopy analysis. We excluded CEC subtypes that matched blast cell or leukocyte morphology (see Supplementary Figure S2), instead identified morphologically distinct cells in enriched blood samples, obviating the need for CD31 staining. Endothelial-like cells were categorized as normal (nCEC), abnormal (aCEC) or aberrant (tCEC) (Figure 2). Normal CEC status was indicated by the presence of 1 nucleus per cell. Abnormalities in CEC (aCEC and tCEC) were characterized by multinucleation or nucleus segmentation in 1 cell underpinned by endomitosis or in form of cell clusters. Abnormal CEC were classified as having regular nuclei of similar shape and texture.38,39 In contrast, tCEC status was defined by variability in nuclear shape and texture between nuclei in a cell or cell cluster, indicative of cancer-related disruption of nuclear morphology control (Figure 2).38,40 nCEC were frequently found in control subjects (2 of 10 in healthy and 6 of 9 in noncancer subjects) (Figure 3, Supplementary Tables S2 and S3). Also, 8 of 14 cancer subjects before surgery were nCEC positive in the range 1 to 67 cells per 5 mL, and in 9 of 14 subjects after surgery, showing a decrease of 63.8% ± 46.0% with de novo appearance in 3 of 9 postsurgery positive subjects. It seems that nCEC may be related to surgery-induced vascular damage. Abnormal CEC were detected in 5 of 14 cancer subjects before surgery. After surgery, 4 subjects tested positive, including 2 with de novo positive CEC status. The average reduction was 50% ± 50% and seems to argue against cancer-association of aCEC (Supplementary Table S3). Also, aCEC was observed in 3 noncancer subjects (Supplementary Table S2). Increasing cellular pathology correlates with higher likelihood of cancer presence.20,41 Therefore, aberrant CEC or tCEC were of special interest suspecting greater cancer-specificity. Accordingly, the statistical difference between values of the treatment-naive cancer cohort and the noncancer control cohort was significant for tCEC (P = .014) and indifferent for aCEC (P = .17) and nCEC (P = .44). All tCEC positive subjects before surgery (5 of 14) were negative for this cell type after surgery, but de novo emergence occurred in 1 subject after surgery and may be attributed to surgery-inflicted vascular damage or adverse reaction. The average reduction was 83.3%± 37.3%, a significant association with surgical intervention and would corroborate previous findings 42 and increased cancer-specificity when compared with aCEC and nCEC (Supplementary Table S2). The combination aCEC and tCEC in association with cancer status, points to an abnormality cutoff of 1 cell per 5 mL.

Gallery of circulating endothelial-like cells (CEC) derived from breast cancer patients. Cell images 1 to 4 demonstrate aberrant CEC (tCEC) measuring 28.3 µm, 23.5 µm, 43 µm and 13.2 µm in major diameter with highly irregular nuclear morphology and polyploidy. Cell images 5 to 8 demonstrate bi-nucleated CEC (aCEC) measuring 34.4, 28.4, 16.1, and 29.3 µm in major diameter with relatively normal nuclear morphology or aggregation (image 5). Cell images 9 to 11 demonstrate normal CEC (nCEC) showing 1 nucleus per cell with oval-shape morphology measuring in diameter 13.1, 18, and 14.6 µm. These latter include bone-marrow derived progenitor cells, with round to oval shapes.

Summarized test results for samples 1 to 14 per marker type in situations of pre- and postsurgery. The marker denotation “pre” indicates a test 2 weeks before surgery and “post” 2 to 3 weeks after surgery. CTC were summarized into a category CTC146 comprising classes 1, 4, and 6 CTC and a category CTC235 comprising classes 2, 3, and 5 CTC. Other marker nomenclature remained as used in the text. Difference in pretest and posttest medians: CTC146: P = .0084, CTC235: P = .075, CEE: P = .032, CECall: P = .26, aCEC: P = .5, tCEC: P = .22, CEBall: P = .023, aCEB: P = .067, nCIC: P = .5 and aCIC: P = .32. The horizontal line represents the median concentration per category. The absence of the line denotes a median of zero. A circle represents the cell type concentration per patient.
The CEB are classified as having normal or abnormal morphology according to our previous work 27 and shown in Supplementary Figure S4. These cells are highly sensitive in predicting bone marrow pathology referred to as BMD and may provide insight into cancer behavior and response to treatment. The detection of, in particular, aCEB is diagnostic of defective erythropoiesis and may indicate cancer-presence when invasion of tumor cells into the bone marrow has occurred. 27 As can be expected in early-stage breast cancer without prior systemic treatment, only 4 of 14 cancer subjects showed mild BMD as indicated by the presence of aCEB in the range of 1 to 4 cells per 5 mL.
The CIC have been previously linked to the presence of cancer-associated inflammation, correlating with morphological abnormality. 24 Normal CIC (nCIC) showed a nonspecific disorder correlation above a concentration cutoff of 5 cells per 5 mL. CIC positive for CD44i35 (aCIC) correlated with residual breast cancer status, demonstrating an 87% positive predictive value. Representative images are shown in Supplementary Figure S4. The combined abnormality frequency of CIC, defined by elevated nCIC or presence of aCIC, was around 78%, and was corroborated in this study detecting 11 and 12 out of 14 cancer cases in pre- and postsurgery samples, respectively. However, the presence of aCIC alone was lower in this study cohort, with 6 and 5 cases (total 7 patients) out of 14 subjects in pre- and postsurgery, respectively, Figure 3 and Supplementary Table S3. Furthermore, we confirmed no response to treatment by nCIC and aCIC to surgery, with an average decrease of 25.2% ± 33.0% by nCIC (P = .5) and 53.6% ± 51% by aCIC after surgery (P = .32). Three subjects saw aCIC return to normal levels, 4 did not, including 2 cases with de novo abnormality. These findings support the presumption of a systemic cancer component that is independent of the primary cancer as well as supporting the former conclusion that CIC abnormality is not predictive of response to treatments relating to adjuvant chemotherapy or surgery.
Reproducibility of the CTC classification
Reproducibility was demonstrated regarding inter-reader variability. The study tested agreement among 3 image analysts with varying skill levels (moderate, experienced, and expert) after a 30-minute briefing held by the expert analyst (analyst 3) on CTC class identification based on the analysis guide (as supplemented). Analysts 1 and 2 (moderate and experienced skill) were unfamiliar with the classification system prior to the briefing. Agreement levels were assessed as percentages, with a target of over 80% to demonstrate skill transferability. Each analyst independently evaluated a set of unseen images containing 20 to 40 objects of interest. Initially, agreement was low, measuring 58%, 67%, and 42% between analysts 1 and 3, 1 and 2, and 2 and 3, respectively. Within 3 iterations comprising steps of guideline adaptation, 15-minute seminar, image analysis, and analysis review, agreement between readers 2 and 3 reached 81%, between readers 1 and 3 increased to 71%, and between analysts 1 and 2 increased to 62%, respectively.
Diagnostic performance
We examined the association between cell types in the CASA panel and breast cancer status regardless of surgical status, as well as their association with breast cancer presence, before surgery, and absence after surgery purposed to leverage breast cancer specific CASA marker combinations. In addition, we gained insight into possible surgery-related systemic side effects. In Supplementary Table S3, cancer-present CASA panel includes 3 cell categories: CEE, CTC classes 1, 4 and 6 denoted tumor-derived CTC (tCTC), and the aberrant CEC cells denoted tCEC. In the same table, cancer-absent CASA panel includes 5 categories: CTC classes 2, 3 and 5 denoted systemic CTC (sCTC), nCIC, aCIC, aCEB, and aCEC, as defined previously. Panel of cells associated with side effects could be defined as those least associated with cancer but showing elevation after surgery. It was found that the combinations of normal and abnormal CEB, CEC, and CIC (CEBall, CECall, CICall), respectively, in Supplementary Table S3 were strongly associated with surgical status, but not with cancer, and hence were candidate panels for side effects. The diagnostic performance of markers and combinations therefore specific to tumor-presence was of further interest. Cancer-present subjects were those with the presence of primary tumor before surgery, of whom there were 14. Cancer-absent subjects were those without the primary tumor after surgery, which included the same 14 subjects with breast cancer. Cancer-naïve subjects included 20 healthy and 9 noncancer subjects with some form of illness, as previously described. We used tCTC as the lead marker. We paired tCTC with 1 other marker, either tCEC or CEE. We selected 2 cutoff values for tCTC, at 1 and 2 cells per 5 mL, for detailed examination. The cutoff for tCEC was set to 1 cell per 5 mL, as in most patients only 1 cell per 5 mL was detected. The cutoff for CEE was 225 cells per 5 mL, as described previously. We chose the tCTC cutoff at 2 cells per 5 mL, as the combined tCTC at this cutoff paired with either tCEC or CEE has a specificity as well as a positive predictive value of 100%, as shown in Table 4. The results may support a reasonable prediction of tumor-presence at given marker combinations.
Sensitivity, specificity and predictive values for cancer presence at various tCTC cutoffs.

All are in units of cells/5 mL; PPV: positive predictive value; NPV: negative predictive value.
In a similar manner, the diagnosis of cancer regardless of the presence or absence of the primary tumor can be done using sCTC as the lead marker, alone or paired with any one of aCEC, aCIC or aCEB. The cutoff for sCTC was set to 3 cells per 5 mL if at least 2 sCTC cell types were detected, and to 4 cells per 5 mL if only class 3 CTC cells were detected. The cutoff for all other markers aCEC, aCEB and aCIC was set at 1 cell per 5 mL, as none of these cells were detected in healthy subjects (Table 5). The results may support a reasonable prediction of cancer at given marker combinations.
Sensitivity, specificity, and predictive values for cancer status, regardless of presence of tumor.

Cutoff at 3 cells/5 mL when detecting at least 2 of the class 2, 3, or 5 CTC; cutoff at 4 cells/5 mL when detecting class 3 CTC only.
All are in units of cells/5 mL; PPV: positive predictive value; NPV: negative predictive value.
Another interesting diagnostic approach would be to use the combination of sCTC and tCTC to diagnose primary cancer prior to surgery, as both are useful markers for cancer presence. Using the previous recommended cutoffs, the specificity and negative predictive value (NPV) for cancer remained high, but now the sensitivity and NPV for cancer was further increased, as can be seen in Table 6. Interestingly, the 2 false-negative cancer subjects in Table 6 were actually positive for cancer according to the markers tCEC and aCIC.
Sensitivity, specificity, and predictive values for the presence of cancer.

Cutoff at 3 cells/5 mL when detecting at least 2 of the class 2, 3, or 5 CTC; cutoff at 4 cells/5 mL when detecting class 3 CTC only
All are in units of cells/5 mL; PPV: positive predictive value; NPV: negative predictive value.
Moreover, these cellular markers and their combinations when achieving 100% specificity (see Table 4 and 5) may represent an important hematological characteristic of early-stage breast cancer and can be described as a disorder that is represented beside the known fact of a heterogeneous population of epithelial cells, by findings of systemic inflammation mediated by CD44+ cells (12 positives out of 14), endothelial damage (7 out of 14) and defective erythropoiesis (4 out of 14).
We used all detectable rare cells in the categories denoted CEBall, CECall, CICall as the panel for the side effects of surgery, shown in Supplementary Table S3. The overall average relative increase of 2.8 times suggests that surgery negatively affects homeostasis of the rare cell population, as can be expected due to repair and recovery mechanisms still taking place after 2 weeks. The CEB panel is highly sensitive to any kind of interference to bone marrow homeostasis as has been reported previously. In this study, 13 of 14 cancer subjects showed CEB elevation after surgery, with an average relative increase of 3.2 times (Supplementary Table S3). The changes in CEC levels, which should represent vascular damage, were highly variable, with only 3 subjects showing an increase, 5 remaining stable, and the rest did not have detectable CEC after surgery. Similarly, changes in CIC levels after surgery were highly variable, with 6 of 14 showing elevation and the rest showed decreased levels. We classified the “response to surgery” as complete, strong, partial, or no response based on the average percentage of effect values (see Supplementary Table S3). We defined a complete response as a decrease in the concentration of tumor-present CASA and systemic CTC after surgery, bringing both levels below the cutoff or to normal ranges. Complete responses were seen in 5 of 14 subjects after surgery. Responses to surgery other than “complete” were rated according to the response average. Seven out of 14 subjects were rated as strong or partial responders with an average response rate in range of 25% to 70% (strong response: >65%). Finally, 2 subjects were rated as nonresponders with an average response rate lower than 25%.
Finally, all epithelial events including CTC and CEE were found unrelated to cancer stage. Furthermore, levels of both CIC types in subjects before surgery were found unrelated to the Systemic Immune-Inflammation Index (see Supplementary Table S1) (nCIC: R 2 = 0.005 and aCIC: R 2 = 0.14). However, we observed a correlation between heightened CASA abnormality, in CEB and/or CEC (cutoff > 0), and Her-2+ and/or triple negative breast cancer subtypes wherein 4 out of the 5 patients with hormone positive status showed CEB/CEC negative profiles and all 9 patients with hormone negative status showed CEB/CEC positive profiles.
Discussion
Comprehensive marker analysis is much needed in cell-based liquid biopsy, 43 which could address challenging issues such as tumor heterogeneity12,44 as well as diagnostic interpretation.45,46 Traditional approaches for CTC identification focused on phenotyping and genotyping, perhaps for the advantage of standardization, comparability and the access to the markers. Another, additional, approach for rare cell subtyping can be based on cellular morphology representing a potentially viable solution for the widely accepted yet technologically challenging task of multimarker analysis in microscopy for liquid biopsy. A platform is proposed facilitating comprehension of a wider range of cellular markers based on the combination of fluorescence marker and cytomorphological analysis denoting a compromise between unambiguous identification of cell (sub)type and holistic marker analysis. The platform recommends minimizing staining to the lowest feasible level where morphology remains distinguishable. This consideration was especially pertinent for endothelial cells, which exhibit a spectrum of morphologies that includes morphological uniqueness but also ubiquitous blast cell morphology. This platform excluded nondistinct progenitor endothelial cells, eliminating the need for an additional fluorescence channel for their identification. Concerns may be hinged on the subjectivity in reading and interpreting rare cell identity, underpinned by ambiguous identification criteria, resulting in disagreements even among skilled analysts that challenge reproducibility and standardization. We aimed to demonstrate reproducibility of the proposed CTC classification system and achieved greater 80% agreement between the experienced and expert readers after 4 testing and review iterations. While this suggests skill-dependency and the need for improvement in skilled interpretation for diagnostic applications, it underscores the reproducibility of the classification criteria. Nonetheless, this situation advocates for exploring computational pathology as a potential solution for improvement. It is important to recognize that the comprehensive rare cell analysis and proposed marker panel classification may be more technologically limited compared with existing CTC analysis methods, which provide broader options. This classification necessitates a systematic approach to maintain cell morphology as closely as possible to that of native blood, involving selective removal of red and WBCs, staining in solution, and employing advanced microscopy for prompt high-resolution imaging of viable cells. Moreover, technological optimization and expertise play a crucial role in determining normality cutoffs. It appears that only a handful of groups have focused on the analysis of CTC based on cytomorphological imaging as to unlock information about function and pathology. 44 ,47 -51 This proof-of-concept study employs a similar identification approach yet expands marker analysis to circulating rare cells associated with general disorder herein referred to as CASA for the purpose of breast cancer characterization based on its concurrent systemic abnormalities.
Traditionally, canonical CTC are assumed to be tumor-derived. 19 With further studies however, it became clear that canonical and noncanonical CTC as well as circulating tumor DNA also exist in the absence of detectable tumors12,25 which is corroborated in this study. Findings were traditionally explained by excessive tumor cell shedding as a consequence of surgical resection and the week-long or months-long persistence of such cells. 25 The theory was considered less helpful in the understanding of what could be denoted as systemic cancer and ignores evidence of nesting and dormancy, CTC half-life, immune response, and cell clearance activity. The theory of occult distant and dormant CTC shedding micro-metastases that are concurrent with the primary tumor and in a state of proliferation and apoptotic equilibrium is gaining more popularity.6,8,12 Such CTC without known origin would be best denoted as systemic CTC and could hypothetically re-nest to become DTC for example in the bone marrow and sufficing the idea of a widespread systemic CTC-DTC cycle. However, given the relative high frequency of epithelial-like cells in the noncancer control cohort, false-positive identification as systemic CTC is likely and reduces the certainty of interpretation. False positives may not represent mere artifacts but genuine rare cells with the most likely pathological underpinning of tissue inflammation. 52 In consequence, interpretation of CTC by our platform to represent cancerous micro- and macro lesion needs caution rather supporting the idea to measure the extend of systemic cancer burden. Description and classification of CTC morphology are in congruence with our finding, yet have never been explicitly associated with cancer presence or absence. 49 It shall be noted at this point that the study and platform design are insufficient to draw similar conclusions for the canonical tumor-derived epithelial Cytokeratin + CTC that may seem to fall into either category of class 2 or 3. Unexpectedly, only circulating epithelial-like cells classified as class 1 CTC correlated with tumor-presence. The class 1 morphology also seems consistent with recent reports of CTC adapting to shear stress in the blood stream by nuclear expansion. 33 A classification of CEE other than CTC was necessary since most epithelial events were of uncertain nature. This rare cell subset may be sourced by a tumor or occult inflammation, 52 comprise immature platelets, and additionally may be elevated upon dysfunctional or impaired cell removal by the organs involved. The composition of these tumor-associated cell entities in cancer is most likely dominated by endothelial cell types, as reported in 2 recent articles.21,53 Nonetheless, the results suggested the presence of tumor-associated CEE subpopulations and infers usefulness as co-factor along with class 1 CTC and tCEC to monitor intervention response in particular in subclinical cancers.
The diagnostic performance of our liquid biopsy platform when leveraging the information about tumor-derived and systemic rare cell markers in the CASA system should be of practical interest. For the CTC panel, the cell concentration in subjects before surgery was low, ranging from 2 to 64 cells per 5 mL with a median of 9.5 CTC per 5 mL, but events were consistently found in all subjects. These findings are comparable with those of previous work.47 -49 Consequential to the stratification of markers into tumor-derived or systemic, we identified CEE, tCTC, and tCEC as markers to potentially predict cancer-presence (Table 4) and warrants deeper investigations into relapse prediction, a so far challenging feature in liquid biopsy applications. In contrast, class 2, 3 and 5 CTC, aCEB, aCEB, and aCIC were found sensitive to cancer yet, insignificantly correlated to tumor presence and thus, warrants investigation for use as surveillance and monitor marker panel in largely subclinical systemic chronic cancer disease during adjuvant chemotherapy or in follow-up. The overall capacity of detecting cancer was demonstrated when combining all CTC subtypes having measured a sensitivity of 86%, with 2 out of 14 false-negative findings (Table 6). This false-negative identification is likely due to a limitation of the system of morphological classification, suggesting that CTC positive signal could have been lost into the CEE class. At this point further technological and methodological improvements are likely to play out in increased functional sensitivity. However, we may point out that the biology of early-stage cancer simply has its limits in shedding relevant signal sufficient to be detectable in a volume of the herein used 3.5 mL whole blood. In addition, we were not able to identify any factor of similarity between false-negative samples as identified in Table 6 suggesting that tumor-derived cell shedding may be independent of prognostic staging rather suggesting an individual dependency.
More importantly, the diagnostic performance was used to leverage information about the breast cancer character based on 100% specificity of CASA marker combinations (see Tables 4 and 5). Our findings may support the notion of an inflammatory disorder accompanying tumor-presence which is herein characterized by vascular and bone marrow damage yet, most frequent represented by detection of the CD44+ rare cell phenotype and class 3 CTC. The study results suggest that in particular the inflammatory disorder may persist after tumor resection and is worth investigation as risk factor of relapse. In this vein, a positive correlation of CEB/CEC with negative hormone status has been identified suggesting an overall greater cancer associated inflammation burden in triple negative or Her-2 positive breast cancer warranting further investigation.
In addition, our preliminary investigation does not suggest an association between CASA cells and cancer stage, which might be due to the dominance of cancer-absent CASA in the circulation.
The influence of the surgical intervention on the inflammatory disorder is corroborated by our response data of the cancer absent-CASA markers, showing a heterogeneous development in systemic disorder over the stretch of the 2 measurements. A minority of patients showed a significant reduction in abnormality (response > 50%) suggesting that this patient subgroup generated a low systemic chronic disease burden in the first place. Perhaps worth mentioning is the case of BR13 that showed de novo emergence of aCEC and tCEC after surgery highlighting the possibility of greater damage in some patients. The adverse reaction is perhaps also indicated by severe inflammation having detected an increase in CIC concentration by a factor of 4.3. Since systemic inflammation 16 and CTC26,54 are known risk factors if not hallmarks for cancer recurrence, the patient might be at higher risk of relapse when compared with her peer group.5,55
We have also looked at the so-called circulating tumor micro-emboli events that are usually considered to be clustered CTC and are reported to be relatively common, but we were not able to clearly identify such events. Although cellular aggregation was detected frequently in cancer patients, the presence of autofluorescence and leukocytes within such clumps made identification of CTC impossible. On the other hand, clusters with dim EpCam signal were found in rare cases, which were at given regular nuclear morphology of alleged endothelial origin and consequently, categorized as aCEC. Specificity to malignancy is not supported by previous literature 39 as well as similar findings in a case with benign adrenal gland tumors (data not shown). Another to be expected herein unlisted cell type is the fibroblast-like cell that was found to be extremely rare and also present in the noncancer cohort. Therefore, the introduction of an additional subtype for circulating fibroblast-like cells as described in our previous work 17 was meaningless for the purpose of investigating association and behavior in cancer.
Of further note is our decision to design a mixed gender and “open disorder” control cohort thus, focusing on marker specificity and not subject homogenicity given fact that the CASA markers are not gender and breast cancer specific (benign and malignant). The idea was to decrease bias and increase interpretation power. The study was conducted with a relatively low number of test subjects, yet sufficed statistical significance to reveal statistically relevant differences between circulating epithelial cells when tested before and after in the same patient.
Major limitations of this study include a very small control sample size, the subjective nature of current morphological classification, and the purely speculative nature of much of the discussion. Further investigations in a larger and more varied sample of breast cancer patients are already underway, as well as follow-up studies of patients in this study. An artificial intelligence (AI) approach to morphological analysis will be developed as well.
Conclusions
The study aimed to investigate the presence and behavior of various circulating rare cell types, such as epithelial, endothelial, and inflammation-associated cells, in breast cancer patients, supporting the concept of multiparametric liquid biopsy. This multimarker approach emphasized breadth rather than detailed cytopathological features of single markers, aiming to gain deeper insights into the systemic cancer component in breast cancer patients. The association of cancer-associated rare cell abnormalities or CASA with breast cancer was validated by marker response to surgery and in relation to cancer-naïve controls. Findings suggest a hematologic representation of breast cancer dominated by circulating rare cells associated with inflammatory processes, largely independent of tumor presence. The CASA marker panel demonstrated sufficient sensitivity and cancer specificity, potentially improving disease burden assessment and prognostication. Specific combinations of rare cell markers, particularly circulating epithelial and endothelial cells alongside abnormal erythroblasts, show promise for predicting tumor presence and assessing systemic cancer burden. The study also highlighted the benefits of cell morphology analysis in liquid biopsy, revealing significant variation in specificity among epithelial cell subtypes concerning tumor presence. Epithelial cells with full nucleation were relatively specific to tumors, while cells with irregular blast characteristics were found to be independent of tumor presence. In addition, the research provided new insights into surgery-related side effects, which are often overlooked but may affect patient prognosis. This proof-of-concept study does not support using this liquid biopsy platform for cancer screening or diagnosis in healthy individuals.
Supplemental Material
sj-docx-1-bcb-10.1177_11782234241310596 – Supplemental material for Rare Cell Population Analysis in Early-Stage Breast Cancer Patients
Supplemental material, sj-docx-1-bcb-10.1177_11782234241310596 for Rare Cell Population Analysis in Early-Stage Breast Cancer Patients by Stefan Schreier, Prapaphan Budchart, Suparerk Borwornpinyo, Lakkana Adireklarpwong, Prakasit Chirappapha, Wannapong Triampo and Panuwat Lertsithichai in Breast Cancer: Basic and Clinical Research
Supplemental Material
sj-docx-2-bcb-10.1177_11782234241310596 – Supplemental material for Rare Cell Population Analysis in Early-Stage Breast Cancer Patients
Supplemental material, sj-docx-2-bcb-10.1177_11782234241310596 for Rare Cell Population Analysis in Early-Stage Breast Cancer Patients by Stefan Schreier, Prapaphan Budchart, Suparerk Borwornpinyo, Lakkana Adireklarpwong, Prakasit Chirappapha, Wannapong Triampo and Panuwat Lertsithichai in Breast Cancer: Basic and Clinical Research
Footnotes
Acknowledgements
We thank Dr. Khachen Kongpakwattana and Nextmed Co., Ltd. for their essential role in the CRO work, and Ms. Yada Phengsalae from Ramathibodi Hospital for her great support in patient recruitment. Their contributions were crucial to the success of this study.
Declarations
Supplemental material
Supplemental material for this article is available online.
References
Supplementary Material
Please find the following supplemental material available below.
For Open Access articles published under a Creative Commons License, all supplemental material carries the same license as the article it is associated with.
For non-Open Access articles published, all supplemental material carries a non-exclusive license, and permission requests for re-use of supplemental material or any part of supplemental material shall be sent directly to the copyright owner as specified in the copyright notice associated with the article.