
Abstract
Diabetes accelerates cancer cell proliferation and metastasis, particularly for cancers of the pancreas, liver, breast, colon, and skin. While pathways linking the 2 disease conditions have been explored extensively, there is a lack of information on whether there could be cytoarchitectural changes induced by glucose which predispose cancer cells to aggressive phenotypes. It was thus hypothesized that exposure to diabetes/high glucose alters the biomechanical and biophysical properties of cancer cells more than the normal cells, which aids in advancing the cancer. For this study, atomic force microscopy indentation was used through microscale probing of multiple human breast cancer cells (MCF-7, MDA-MB-231), and human normal mammary epithelial cells (MCF-10A), under different levels of glycemic stress. These were used to study both benign and malignant breast tissue behaviors. Benign cells (MCF-10A) recorded higher Young’s modulus values than malignant cells (MCF-7 and MDA-231) under normoglycemic conditions, which agrees with the current literature. Moreover, exposure to high glucose (for 48 hours) decreased Young’s modulus in both benign and malignant cells, to the effect that the cancer cells showed a complete loss in elasticity with high glucose. This provides a possible insight into a link between glycemic stress and cytoskeletal strength. This work suggests that reducing glycemic stress in cancer patients and those at risk can prove beneficial in restoring normal cytoskeletal structure.
Introduction
According to the Centers for Disease Control and Prevention, both cancer and diabetes are among the leading causes of death in the United States (second and seventh, respectively). 1 Mortality rates are consistently rising in diabetic patients who are subsequently diagnosed with cancer. 2 The incidence of patients with concurrent diabetes and cancer has been reported by clinicians for decades, and a link between diabetes and cancer has been postulated for nearly 80 years.3,4 However, it is only within the past decade that significant epidemiological evidence has been compiled to suggest a causal link.5,6 Risk for several cancer types, including cancers of the liver, pancreas, colorectum, urinary tract, breast, and female reproductive organs, is increased in diabetic patients.4,5 Moreover, diabetes increases metastasis, recurrence, and mortality of cancer.3,4 Aberrant glucose metabolism in cancer cells is a result of preferential aerobic glycolysis, referred to as the Warburg effect. 7 Thus, hyperglycemia promotes rapid cancer cell proliferation and contributes to rewiring of metabolic pathways for cell growth and survival.4,7 Currently, diabetes-cancer link has primarily been hypothesized to rely on hormonal (insulin and insulin-like growth factor 1), inflammatory, and metabolic (hyperglycemia) characteristics of diabetes. 8
A recent retrospective study showed that colorectal cancer patients with diabetes had higher local tumor malignancy than those with normal glucose. 9 Clinically, glycemic control through diet and exercise has been shown to reduce the incidence and improve the chance of survival in pancreatic cancer patients.10,11 Diabetes and obesity have also been linked to higher incidence of breast cancer. 12 Insulin receptor and insulin-like growth factor receptor are over-expressed in breast cancer which accounts for breast cancer proliferation and tumorigenesis in type 2 diabetic patients. Survival of patients having diabetes and breast cancer is very poor owing to different factors including delay in diagnosis, less intensive therapeutic regimen, and diabetes-related comorbidities. 13 It is likely that hyperglycemic conditions are detrimental to cellular structure that increases the propensity of cancerous states. However, there is a lack of information currently on whether diabetes changes cell structure and function which predisposes cancer cells to an aggressive phenotype. We thus hypothesize that diabetes/hyperglycemic conditions induce changes in cytoskeletal structure of breast cancer cells which accelerates breast cancer progression, and can possibly be used as a diagnostic marker.
Atomic force microscope (AFM) can be used for imaging biological cells and tissues, and has been used to measure surface forces between the AFM tip and sample surface. 14 One of the valuable features of AFM for biological applications is the ability of investigating morphology of biological tissues/cells.15-19 Biomechanical properties including cellular hardness, modulus of elasticity, and adhesion have been widely investigated using AFM.20,21 Atomic force microscope has also been used to distinguish cancer cells from normal cells based on their stiffness, growth, mechanics, and morphology.22-26 Optical and confocal microscopies are also used for imaging cells, but they cannot detect cells’ stiffness, mechanics, ultra-structure, and interaction between cells. The biomechanical properties of cancer cells have also been investigated.27-30 Lincoln and colleagues22,24 measured stiffness of human breast epithelial cells and breast cancer cells using optical stretcher and they showed normal cells are 5 times stronger than the cancer cells. Lekka et al23,31 investigated the modulus of elasticity of normal cells and cancer cells using AFM and they found higher modulus of elasticity for normal cells than breast cancer cells.
Cytoskeletons are internal polymer networks that not only give cells their shape and mechanical strength, but through their changes, especially their ability to withstand external and internal pressure, can also indicate the health of the cells. The cytoskeleton is a dynamic structure that changes through differentiation of cells and their division, making it useful to study a variety of diseases. 32 Here we aim to measure cytoskeletal elasticity among different cancer cells and normal cells. Our study can indicate targets for cancer therapeutics as well as provide a source for diagnostic markers in staging cancer progression. In this article, we have used AFM with Bruker’s Sharp Microlever (MSNL) with conical probes to investigate the mechanical changes in cell architecture of benign epithelial cells (MCF-10A) and those representing non-invasive, hormone-dependent breast cancer cells (MCF-7) and invasive, hormone-independent breast cancer cells (MDA-MB-231). These cells were exposed to normoglycemic (5 mM) or hyperglycemic/diabetic (25 mM glucose) concentrations. Differences in mechanical cell responses were measured using modulus of elasticity. It is hoped that this work may shed further light on the physiology of tissues in patients with concurrent cancer and diabetes.
Materials and Methods
Cell culture and treatment
All cell lines (MCF-7, MDA-MB-231, and MCF-10A) were purchased from ATCC. Mammary epithelial cells (MCF-10A) were grown in Dulbecco’s Modified Eagle Medium (DMEM)/F12 supplemented with 5% horse serum, 20 ng/mL epidermal growth factor (EGF), 0.5 μg/mL hydrocortisone, 100 ng/mL cholera toxin, 10 ug/mL insulin, 100 IU/mL penicillin, and 100 ug/mL streptomycin. Breast cancer cell lines (MCF-7 and MDA-MB-231) were grown in DMEM/F12 media supplemented with 5% Foetal Bovine Serum (FBS), 100 IU/mL penicillin, and 100 ug/mL streptomycin. Cells were grown in an incubator set at 37°C with a 5% CO2 air environment.
Cells were grown in chambered glass slides for microscopy and on 80% confluency, they were starved for 1 hour using phenol red-free, serum free media. The cells were then treated using the same media supplemented with different glucose treatment—normal glucose (5 mM), high glucose (25 mM). The 5-mM glucose treatment in all 3 cell lines was used as the control treatment to compare with all other treatments. Cells were incubated for 48 and 72 hours to monitor cell structure. In the “Results” section, the cells, MCF-7, MCF-10A, and MDA-MB-231, are labeled as C7, C10, and C231 in the resulting figures.
Preparation of samples for microscopy
After the incubation period, cells were washed with cold 1× PBS (Phosphate-buffered saline), and then incubated with 4% w/v formaldehyde solution (prepared in PBS) for 15 minutes at room temperature. Fixative solution was removed and cells were again washed 3 times with PBS. Cell mounting solution was added before placing coverslips on the wells and then the cells were imaged using microscopy.
Atomic force microscopy
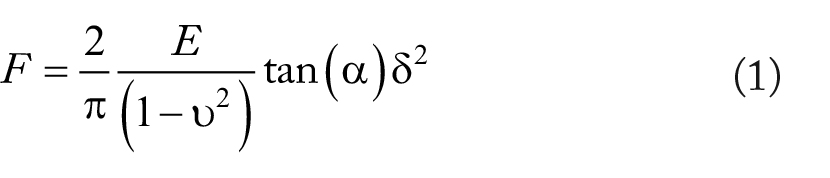
Atomic force microscope MFP-3D (Oxford Instruments, Santa Barbara, California) equipped with MSNL silicon nitride AFM probes (Bruker, Santa Barbara, CA) was used to scan the cells. These AFM probe have several cantilevers. For imaging, contact mode was applied for cell imaging, and for force data collection, MSNL-F probes were used. The spring constant was calculated via the thermal method prior to each experiment and found to be 0.6 N/m. The cantilever’s resonance frequency was between 85 and 155 kHz. Atomic force microscopy probe calibrations were made via indentation mode versus a PDMS gel sample acquired from Bruker (PDMS-SOFT-1-12M, Bruker) prior to experimentation. This sample has a known Young’s modulus (2.5 MPa). Atomic force microscopy was used to image 3 different line of cells and also indentation was performed above the cell surface. To analyze the indentation, the Igor Pro 6.23 software package was used, by which the Sneddon model was used to fit the force versus indentation curves. For both the PDMS reference samples and the cells, their Young’s modulus were recorded. Equation 1 is known as Sneddon model; where F is the force, E is Young’s modulus, α is half angle of the intender, ν is the Poisson ratio, and δ is the indentation depth.
General data acquisition
Around 150 data points were collected, and 100 to 130 force curves were analyzed from them after filtration. The loading force used was in the range of 0.5 to 2 nN. Atomic force microscopy probe approach/retract rate was constant at 300 nm/s in all experiments. Indentation was performed for more than 3 cells in each cell line. Arrows in the force map images below detail the location of measurement on the cells, which is in the center of the cell. Multiple Force Map measurements were carried out on different cells of the same sample and also with changing parameters (eg, trigger value). The differences observed are statistically significant based on the standard error (SE) values in each condition. Height measurements and roughness analysis were executed via FemtoScan.
Fluorescence microscopy
Cells were grown in chambered glass slides and processed for fluorescence microscopy for F-actin staining. After treatment, the media was removed, cells washed with PBS, and then incubated with 4% (w/v) formaldehyde solution for 15 minutes at room temperature. Fixative was then removed, washed again, and reincubated with 0.5% Triton X-100 (v/v) for permeabilization. After incubation for 15 minutes at room temperature, cells were washed again and stained with Actin Green 488 Ready Probes reagent. Cells were counterstained with DAPI (4′,6-diamidino-2-phenylindole) for nucleus staining. Slides were incubated for 30 minutes, protected from light on which cells were again washed and then imaged with excitation/emission at 540/565 nm for actin staining using fluorescence microscopy.
Statistics
For statistical data analysis, t-test was performed for different cell lines with normal and high glucose treatment. A P value less than .05 indicates significance between treatments.
Results
For mechanical characterization, height map imaging was used to generate a picture of the cells. The morphologies of different cells at the time of analyses (48 hours) are shown in Figure 1. C10 (normal mammary epithelial) cells (Figure 1—top, right) display a round, rather smooth surface, and are in clumps. The middle, top image in Figure 1 shows a height map of C7 cells (non-invasive breast cancer cells). A zoom-in below that figure shows the heterogeneous height of these cells, giving a rather crumpled appearance. Similar observation was noted for C231 (invasive breast cancer cells) cells in the height map (Figure 1—top, left). The zoomed-in region depicts nanometer non-uniformity along the surface. These tumorigenic breast cell lines (C231) represent hormone-independent breast cancer cells. In contrast, C7 cells display irregular cell shapes and rough, overly porous, and non-uniform exteriors. An overall height map is given for each type in Figure 2. Respectively, the roughness values of MDA-MB-231, MCF-7, and MCF-10A cells in these images are 148.2, 113.5, and 345.4 nm, respectively (Figure 2). The maximum height was 1100 nm for MDA-MB-231 cell line, 1800 nm for MCF-7 cell line, and 4300 nm for MCF-10A cell line. These indicate substantial differences between each cell type, and by virtue of what the cancers or lack of cancer that they model, differences in disease state. This demonstrates and supports research that suggests surface and mechanical differences in states of malignancy.33-35
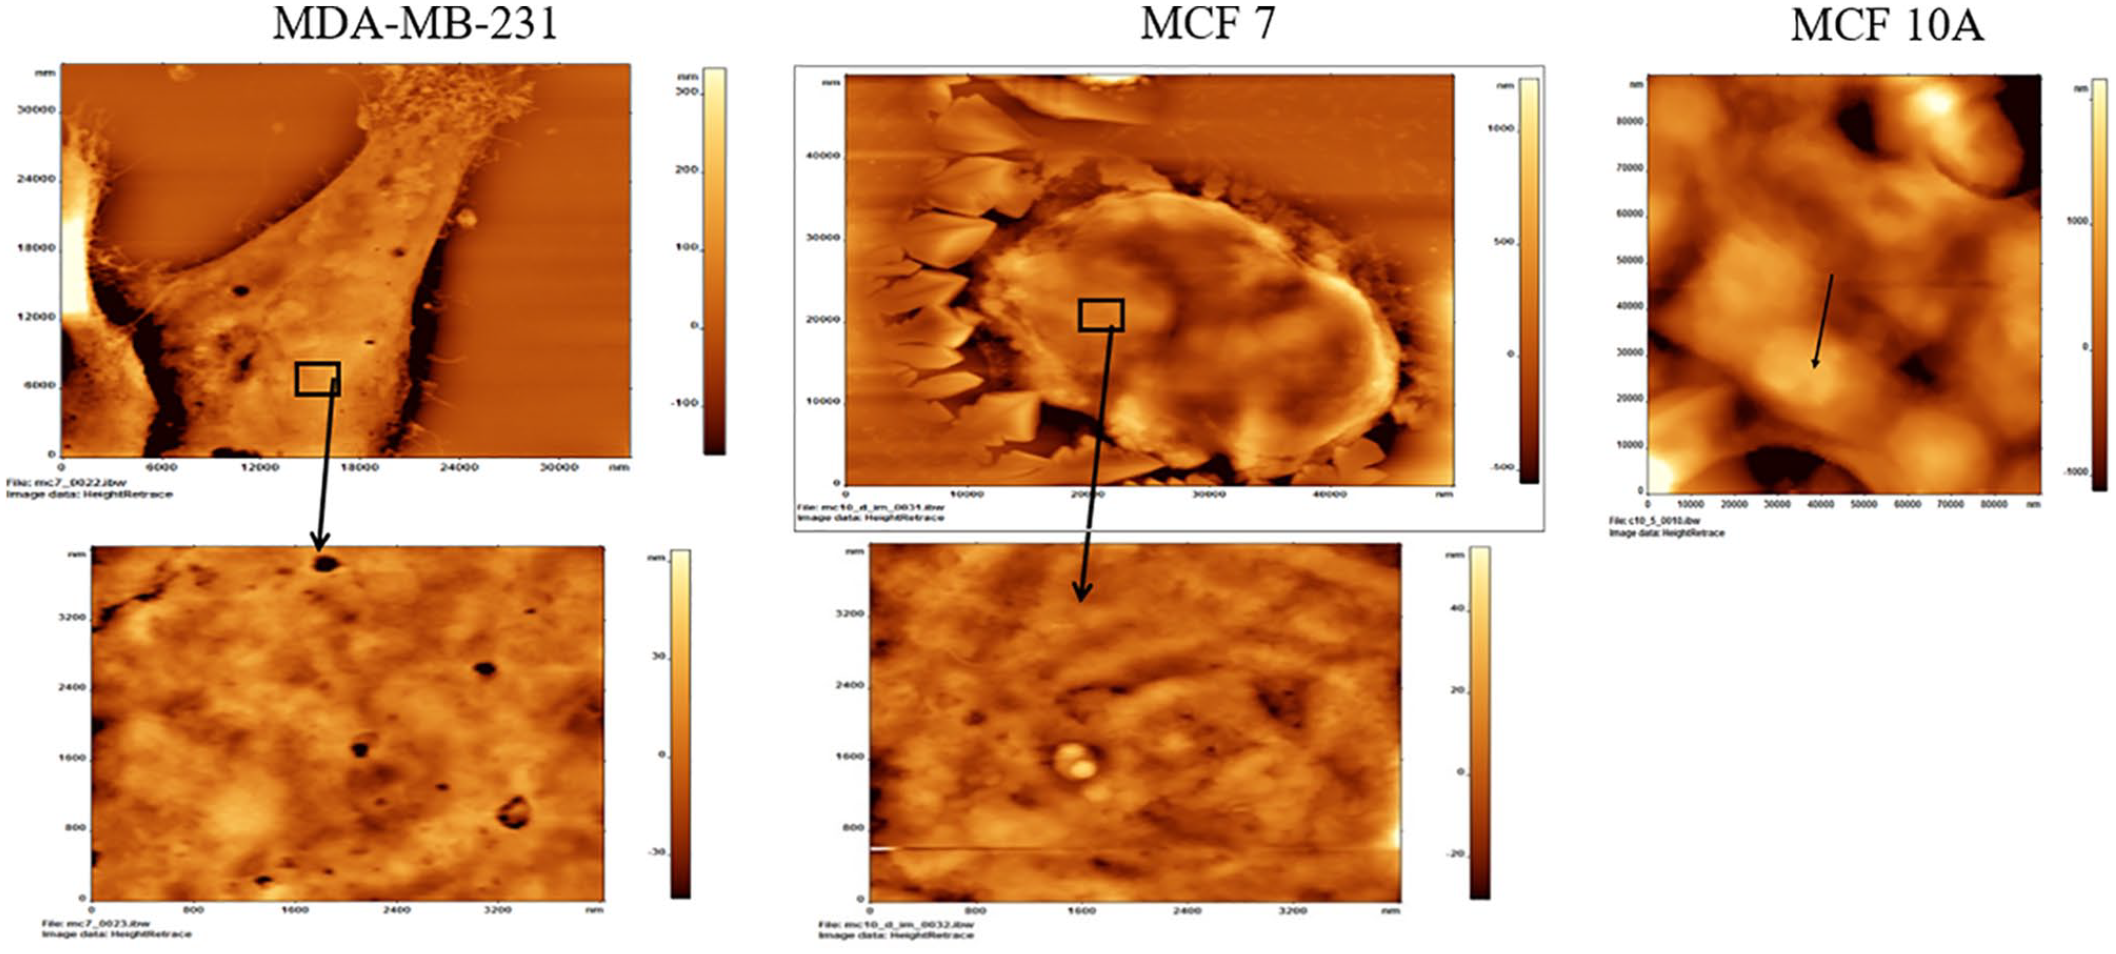
Atomic force microscopy of normal mammary epithelial cells (MCF-10A), non-invasive breast cancer cells (MCF-7), and invasive breast cancer cells (MDA-MB-231). The figures in the second row show a zoomed-in region, which depict nanometer non-uniformity along the surfaces. More than 10 cells were imaged using atomic force microscopy in each cell line.
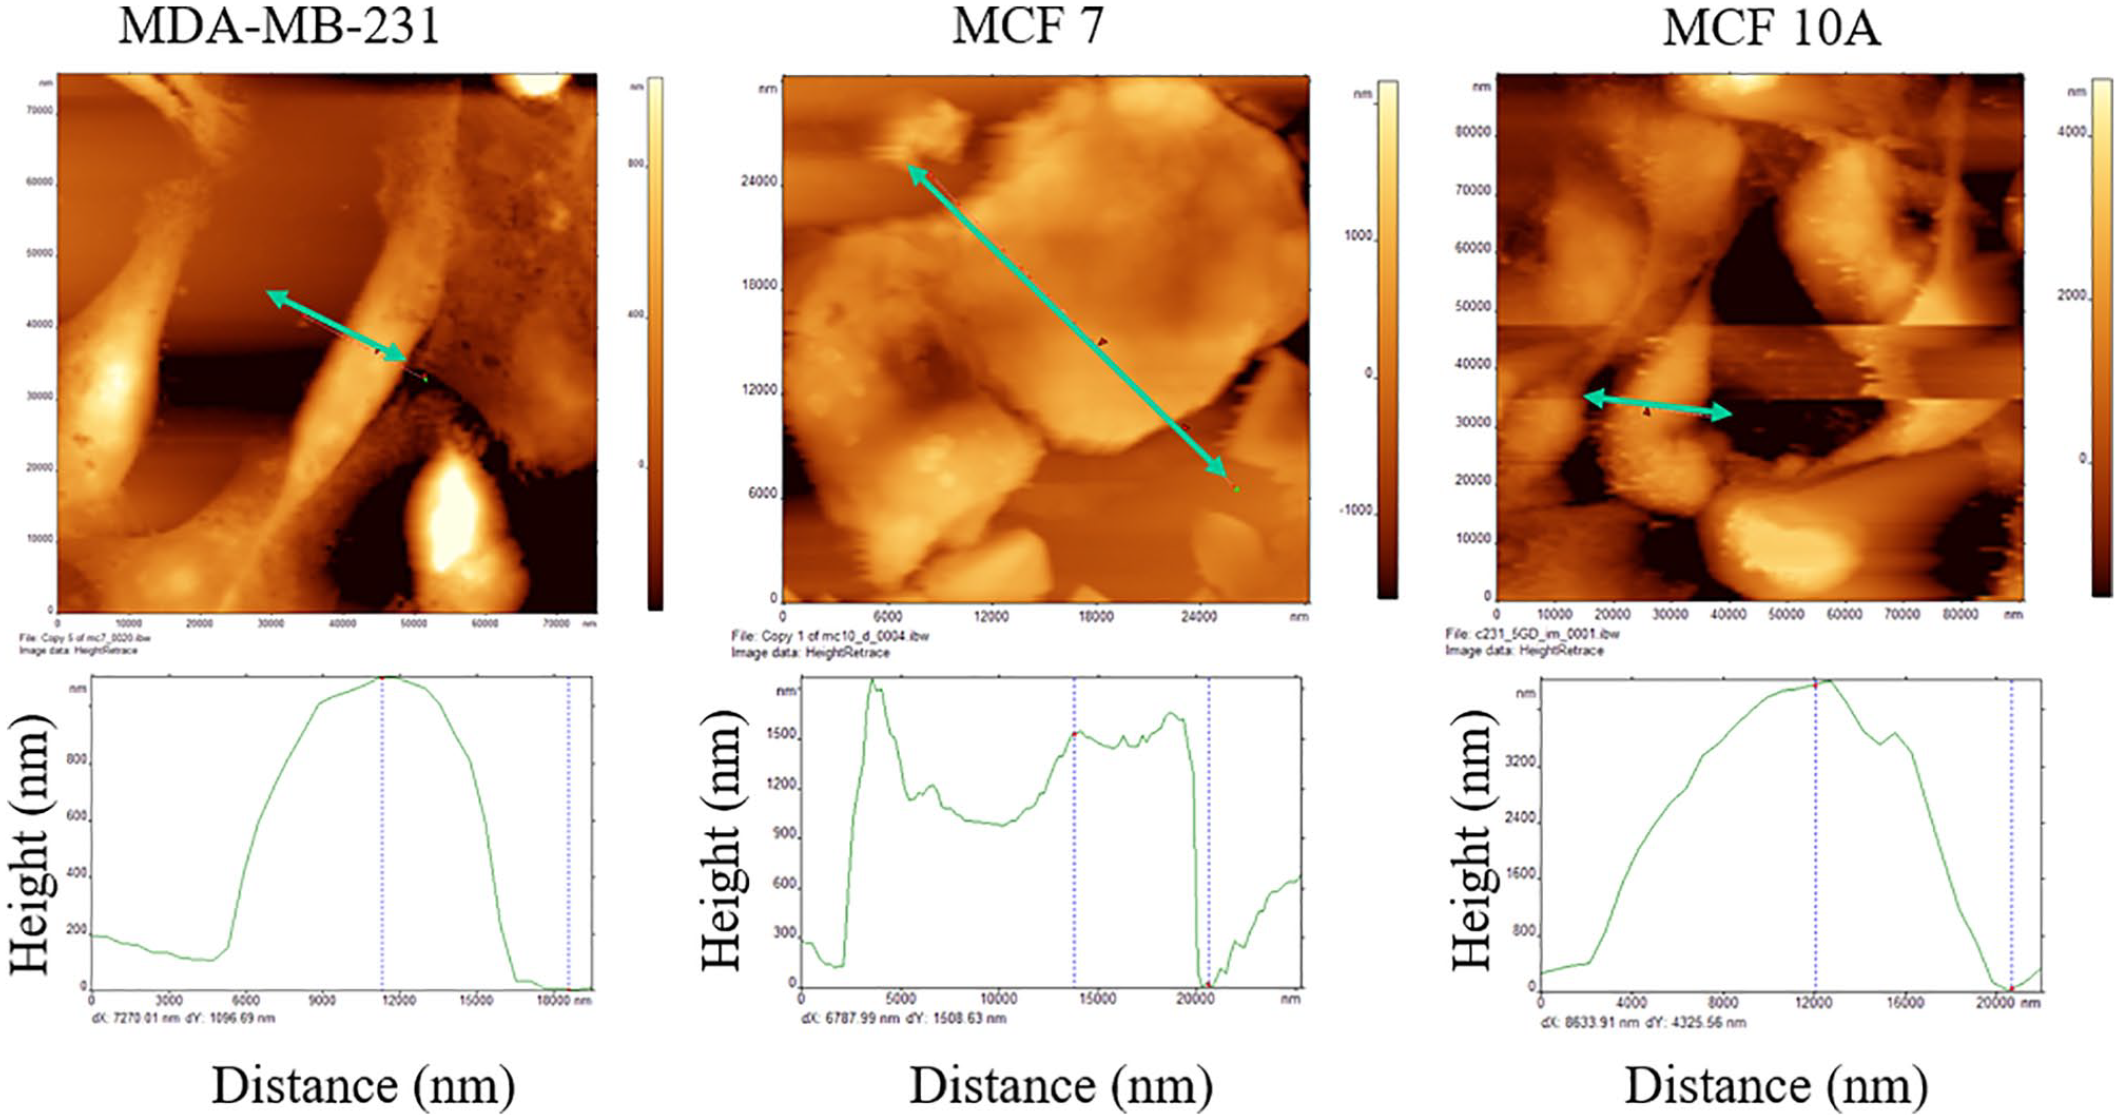
Height mapping of MDA-MB-231, MCF-7, and MCF-10A cells.
On comparing the modulus of elasticity among the 3 cell types, the invasive cancer cells (C231) were found to be the least elastic while the normal cells (C10) were the most elastic (Figure 3). After 48 hours normal dose glucose (5 mM) treatment, a differential modulus of elasticity can be observed with an increase in malignancy. The most striking difference was observed between the C10 and C231. The variance between non-invasive cancer cells (C7) and invasive cancer cells (C231) was much less. Further incubation (72 hours) in normal glucose magnified the difference in elasticity among the cell types, with C231 being the least elastic (Figure 4). Treatment with high glucose decreased elasticity in all cell types at 48 hours (Figure 3) with almost negligent values in cancer cells. At 72 hours, however, the cancer cells appear to show a slight increase in elasticity, which could be due to their highly proliferative nature in presence of glucose.

Comparison of modulus of elasticity measurement obtained using atomic force microscopy for all cell types. MDA-MB-231 (C231), MCF-7 (C7), and MCF-10A (C10), in normal glucose (5 mM, NG) treatment and high-dose glucose (25 mM, HG) treatment at 48 hours (n = 3, *P < .05).

Comparison of modulus of elasticity measurement obtained using atomic force microscopy for all cell types. MDA-MB-231 (C231), MCF-7 (C7), and MCF-10A (C10), in normal glucose (5 mM, NG) treatment and high dose glucose (25 mM, HG) treatment at 72 hours (n = 3, *P < .05).
All cells, regardless of malignancy, exhibited higher modulus of elasticity values with normal doses of glucose at 72 hours (Figure 4). In the case of cancer cells, C231 and C7, normal and high glucose dosing regimens showed differences of nearly 3.22 and 1.88 times the modulus of elasticity, respectively. The difference in C10 under normal and high doses were nearly 0.65 times the modulus of elasticity. Interestingly, normal doses of glucose yielded higher modulus of elasticity values for C10 cells but not for cancer cells. At 48 hours, C231 and C7 exhibited large differences in responses between normal and high glucose dosing regimens (Figure 3). At high glucose, the difference between C231 and C7 was marginal. At normal level of glycemic stress, modulus of elasticity values for the cells was reasonably high, but they showed a gradient with decreasing elasticity from normal status to increasing malignancy. This trend was exacerbated over 72 hours, with the normal cell displaying a high modulus while those of the cancerous cells dropped drastically (Figure 4). The hyperglycemic regimen yielded different results—only the normal cells had a high modulus at 48 hours. However, by 72 hours, the modulus for both cancerous cell types appear to decrease.
Fluorescent staining of actin filaments (Figure 5) depicts there is a clear decrease in actin with high glucose treatments at 48 hours in all cell types. Interestingly, on longer incubation (72 hours) only a slight decrease in actin staining was observed in MDA-MB-231 and MCF-7, although MCF-10A cells display no change/slight increase.

F-actin staining in different cell types: MDA-MB-231 (C231), MCF-7 (C7), and MCF-10A (C10) in normal glucose (5 mM, NG) treatment and high glucose (25 mM, HG) treatment at 48 and 72 hours (n = 3, *P < .05). White arrows indicate actin fibers (red) and blue stained structures are the nuclei. Each image is representative of 5 independent experiments.
Discussion and Conclusions
Based on the results, we support our initial hypothesis that diabetes affects the cytoarchitecture and thus tensile strength far more in cancerous mammary epithelial cells in comparison with normal mammary epithelial cells. Through both control and hyperglycemic regimens, cancerous cells exhibited far lower modulus of elasticity at 48 and 72 hours time points. Our results show that mechanical properties (elasticity) of breast cancer cells are quite distinct from normal epithelial cells and are further affected by diabetes. This was further supported by mechanical tests in which the modulus of elasticity of cells was decreased, contrasted with increased state of malignancy of cancer cells, regardless of glucose levels. In each case, the modulus of elasticity was much higher for benign cells. However, under control regimens, the modulus of elasticity of C231 and C7 decreased between 48 and 72 hours while the reverse occurred for normal cells under hyperglycemic regimens. This suggests that the relationship contains complexities, which require further study.
Elasticity can affect how cells differentiate and divide, which has implications in the overall function of affected tissues and organs. One family of diseases in particular that could be affected by changes in cytoskeletons and thus cellular strength is cancer, a group of diseases that stem from the aberrant and uncontrolled division of cells. With changes that occur due to this affliction, the cytoskeleton can undergo many changes in its ability to withstand pressure. Prior research has indicated that the cytoskeleton plays a role in intracellular glucose metabolism.36,37 We believe that differing external glycemic stresses may impart a significant disruption of internal glucose metabolism leading to changes in cytoskeletal strength.
Atomic force microscopy images revealed heterogeneously organized surfaces, possibly reflecting sub-membrane cytoskeletal changes induced by diabetic stress. These changes suggest sporadic changes which need to be targeted for effective therapies. Remarkably, this could be observed under a relatively short period of time. Fluorescence microscopy data also corroborate our Young’s modulus observation, that in general, the cancerous cells have lower actin (thus lower Young’s modulus of elasticity), and high glucose exposure further decreases actin and elasticity. These characteristics will be further explored to design a microfluidic device to segregate different cell types, which can provide a novel, rapid, and economical diagnostic tool in diabetic oncology. Diagnostic tools examining patients who concurrently have cancer and diabetes can benefit from consideration of how their mechanism of more pliable cells and tissues factor into treatment. This benefit may be improved as more 3-dimensional systems are adapted in the future.
Future Work
As a preliminary work, this article demonstrates at the least that one can probe structural changes in breast cells in response to changes in glucose levels across a system. To deliver more deep, substantial conclusions, experiments will need to assay cell and cell-cell properties in increasingly biomimetic conditions that extend from the cell outward to its environment and interactions with proximal cells. This entails moving up to the organoid, and eventually the organ system level. This work will be helpful as the research community works upward.
Footnotes
Funding:
The author(s) disclosed receipt of the following financial support for the research, authorship, and/or publication of this article: The project described was supported by grants from the UNK Undergraduate Research Fellows Program (J O-R), grants from the National Center for Research Resources (NCRR; 5P20RR016469) and the National Institute for General Medical Science (NIGMS; 8P20GM103427), a component of the National Institutes of Health (NIH) (SC). Use of AFM facility at Nanoimaging Core Facility at University of Nebraska Medical Center (UNMC, Omaha, NE) was supported by Nebraska Research Initiative (NRI) grant, Atomic Force Microscope AFM UNL/UNMC, NRI-5132103200 (DD). Cell culture facility and fluorescence microscopy facilities at UNK were supported by grants from the National Institute for General Medical Science (NIGMS) (5P20GM103427), a component of the National Institutes of Health (NIH), as well as Nebraska Research Initiative.
Declaration of conflicting interests:
The author(s) declared no potential conflicts of interest with respect to the research, authorship, and/or publication of this article.
Author Contributions
DD designed and the performed research, analyzed data, and contributed to the manuscript. X-LP analyzed data and contributed to the manuscript. JO-R was involved with cell culture, glucose treatments, and preparing samples for AFM. VB was involved with the cell culture and preparing samples for AFM. IGD contributed to the manuscript. SC designed the research, supervised the work, and contributed to the manuscript.