
Abstract
Background:
Utilizing a 1-year chart review as the data, Furo et al. conducted a research study on an association between buprenorphine dose and the urine “norbuprenorphine” to “creatinine” ratio and found significant differences in the ratio among 8-, 12-, and 16-mg/day groups with an analysis of variance (ANOVA) test. This study expands the data for a 2-year chart review and is intended to delineate an association between buprenorphine dose and the urine “norbuprenorphine” to “creatinine” ratio with a higher statistical power.
Methods:
This study performed a 2-year chart review of data for the patients living in a halfway house setting, where their drug administration was closely monitored. The patients were on buprenorphine prescribed at an outpatient clinic for opioid use disorder (OUD), and their buprenorphine prescription and dispensing information were confirmed by the New York Prescription Drug Monitoring Program (PDMP). Urine test results in the electronic health record (EHR) were reviewed, focusing on the “buprenorphine,” “norbuprenorphine,” and “creatinine” levels. The Kruskal–Wallis H and Mann–Whitney U tests were performed to examine an association between buprenorphine dose and the “norbuprenorphine” to “creatinine” ratio.
Results:
This study included 371 urine samples from 61 consecutive patients and analyzed the data in a manner similar to that described in the study by Furo et al. This study had similar findings with the following exceptions: (1) a mean buprenorphine dose of 11.0 ± 3.8 mg/day with a range of 2 to 20 mg/day; (2) exclusion of 6 urine samples with “creatinine” level <20 mg/dL; (3) minimum “norbuprenorphine” to “creatinine” ratios in the 8-, 12-, and 16-mg/day groups of 0.44 × 10⁻⁴ (n = 68), 0.1 × 10⁻⁴ (n = 133), and 1.37 × 10⁻⁴ (n = 82), respectively; however, after removing the 2 lowest outliers, the minimum “norbuprenorphine” to “creatinine” ratio in the 12-mg/day group was 1.6 × 10⁻⁴, similar to the findings in the previous study; and (4) a significant association between buprenorphine dose and the urine “norbuprenorphine” to “creatinine” ratios from the Kruskal-Wallis test (P < .01). In addition, the median “norbuprenorphine” to “creatinine” ratio had a strong association with buprenorphine dose, and this association could be formulated as: [y = 2.266 ln(x) + 0.8211]. In other words, the median ratios in 8-, 12-, and 16-mg/day groups were 5.53 × 10⁻⁴, 6.45 × 10⁻⁴, and 7.10 × 10⁻⁴, respectively. Therefore, any of the following features should alert providers to further investigate patient treatment compliance: (1) inappropriate substance(s) in urine sample; (2) “creatinine” level <20 mg/dL; (3) “buprenorphine” to “norbuprenorphine” ratio >50:1; (4) buprenorphine dose >24 mg/day; or (5) “norbuprenorphine” to “creatinine” ratios <0.5 × 10⁻⁴ in patients who are on 8 mg/day or <1.5 × 10⁻⁴ in patients who are on 12 mg/day or more.
Conclusion:
The results of the present study confirmed those of the previous study regarding an association between buprenorphine dose and the “norbuprenorphine” to “creatinine” ratio, using an expanded data set. Additionally, this study delineated a clearer relationship, focusing on the median “norbuprenorphine” to “creatinine” ratios in different buprenorphine dose groups. These results could help providers interpret urine test results more accurately and apply them to outpatient opioid treatment programs for optimal treatment outcomes.
Keywords
*In order to differentiate components in urine from those not in urine, the former is expressed using quotation marks as “buprenorphine” in urine versus buprenorphine medication, without quotation marks.
Introduction
Buprenorphine is a partial opioid agonist and one of the 3 Food and Drug Administration approved medications for opioid use disorder. 1 It binds to the mu opioid receptor with a higher affinity compared to full opioid agonists. Further, it has a safer profile compared to full opioid agonists in the event of overdose because of the “ceiling effect,” which, however, can be removed with combined administration of benzodiazepine or other central nervous system depressants. 1 Therefore, it is often used in office-based opioid treatment (OBOT) clinics for OUD patients, where the treatment progress is regularly monitored with urine tests. The Substance Abuse and Mental Health Services Administration (SAMHSA) recommends monthly urine tests during the maintenance phase, but more frequently in any unstable phase, during the OUD treatment course to monitor treatment progress. 2
Buprenorphine is predominantly metabolized by the cytochrome enzyme P450 3A4, but, to some extent, it is also metabolized by other P450 such as 2C8. 3 It is first metabolized to free “buprenorphine,” which is further metabolized to “buprenorphine-3-glucuronide (Bup-G)” by uridine 5′-diphospho glucuronosyltransferase (UGT) and to “free norbuprenorphine” by P450 3A4. “Bup-G” and “free norbuprenorphine” are further metabolized to “norbuprenorphine-3-glucuronide (Norbup-G)” by P450 3A4 and UGT, respectively. 4 Confirmatory quantitative tests measure “buprenorphine” and “norbuprenorphine” levels, and the “buprenorphine” levels in these tests include free “buprenorphine” and “Bup-G” levels, while the “norbuprenorphine” levels include free “norbuprenorphine” and “Norbup-G” levels.5,6
Various factors can affect “buprenorphine” and “norbuprenorphine” levels. In general, patients on daily buprenorphine have lower “buprenorphine” levels than “norbuprenorphine” levels, while those on intermittent buprenorphine do not show this pattern. This is because “buprenorphine” can be detected for 1 to 7 days, while “norbuprenorphine” can be detected up to 14 days. 1 In addition, “norbuprenorphine” level can supersede the “buprenorphine” level approximately 7 hours after buprenorphine intake. 7 Therefore, if urine is collected within 7 hours after buprenorphine intake, the “buprenorphine” level is expected to be higher than the “norbuprenorphine” level. Also, some medications, such as rifampin, function as P450 3A4 inducers and speed up the buprenorphine metabolism. Conversely, other medications, such as atazanavir and ritonavir, act as P450 3A4 inhibitors and increase buprenorphine concentration in the body, thereby decreasing the metabolite levels in the urine. 8 Furthermore, because buprenorphine is metabolized mainly in the liver and because P450 is primarily found in the liver, a malfunctioning liver due to various illnesses can affect the metabolism of buprenorphine, thus affecting the levels of “buprenorphine” and “norbuprenorphine.” 9
Additionally, “buprenorphine” and “norbuprenorphine” levels can be manipulated by adulteration of urine samples. One form of adulteration involves dipping or spiking buprenorphine film directly into a urine sample, which can significantly alter “buprenorphine” and “norbuprenorphine” levels. Many previous studies have discussed this form of manipulation in relation to the ratio between “buprenorphine” and “norbuprenorphine.” For example, Accurso et al. 10 reported that all urine samples with suspected adulteration have a “buprenorphine” to “norbuprenorphine” ratio >50:1. Donroe et al. 11 found that adulterated urine samples have “buprenorphine” levels >700 ng/mL, while Suzuki et al. 12 argued that adulterated urine samples may have “buprenorphine” levels >2000 ng/mL, with much lower “norbuprenorphine” levels, showing an average of 11.9 ng/mL. Thus, these studies have revealed that observing “buprenorphine” to “norbuprenorphine” ratio can help detect possible adulteration of urine samples.
Another form of urine manipulation is dilution, namely, adding water to urine sample to reduce the urine concentration, which results in the metabolite concentration of any substances to fall below the lower limit of detection for the assay and, consequently, makes them undetectable in the urine sample. This form of manipulation can be detected by closely monitoring “random urine creatinine” levels, which should normally be above 20 mg/dL. 13 However, various factors can lower urine “creatinine” levels, including patients’ age and sex, 14 and certain medications 15 and illnesses, such as kidney disease and polydipsia due to diabetes insipidus. 16 In addition, excessive hydration can reduce urine “creatinine” level. For example, patients with OUD on buprenorphine can develop urinary retention, although it is rare 17 and presents with reduced urine “creatinine” levels, resulting from excessive hydration to overcome this side effect of buprenorphine. These factors should be taken into consideration when monitoring “creatinine” levels of patients with OUD. Due to fluctuating “buprenorphine” and “norbuprenorphine” levels as a result of patients’ hydration status, the “creatinine” level is important in standardizing the “buprenorphine” and “norbuprenorphine” levels, as pointed out by Weigand. 18 Therefore, “creatinine” levels should be measured both to detect any manipulation in urine samples and to monitor OUD treatment progress.
Although monitoring “buprenorphine,” “norbuprenorphine,” and “creatinine” levels are important to detect any manipulation or non-compliance of OUD patients, no studies have systematically investigated these levels in relation to buprenorphine dose, except the previous study by Furo et al., 19 to our knowledge. Using the previous study as a baseline and employing an expanded data set, this study was aimed at exploring an association between buprenorphine dose and urine test results, focusing on “buprenorphine,” “norbuprenorphine,” and “creatinine” levels. This study was conducted with a hypothesis that there would be an association between buprenorphine dose and urine test results. The results of this study should confirm those of the previous study 19 in order to deepen the understanding of the association between buprenorphine dose and urine test results, which can help providers of OUD patients better interpret urine test results and apply it to patient care in OBOT programs.
Materials and Methods
Settings
This study employed a retrospective chart review. After obtaining approval from the Institutional Review Board (Protocol ID: 20-HELI-101), the data sets were extracted from the EHR at an urban OBOT clinic in New York. The requirement for obtaining informed consent from the participants was waived because this study only reviewed charts in the EHR, and thus no human interactions occurred in data collection.
Participants
The EHR charts were retrospectively reviewed for patients living in halfway houses, which were residential settings for people recovering from substance use disorder. Most patients had been staying in the halfway houses after completing detoxification and/or inpatient programs; therefore, most patients were stable in their recovery process. The patients included in this study had been diagnosed according to the criteria in the Diagnostic and Statistical Manual of Mental Disorders, fifth edition (DSM-5) and treated in an OBOT buprenorphine program. In the halfway houses, staff monitored the patients’ medications carefully and observed their intake individually, resulting in the residents being more likely to comply with the buprenorphine treatment than those who were not living in monitored settings. At the OBOT clinic, providers collaboratively worked with patients to adjust buprenorphine doses, as needed; taking into consideration their substance use histories and recent symptoms. Urine tests were predominantly performed to monitor patients’ treatment compliance. Most, if not all, urine sample collections were observed. This intense level of supervision increased the reliability of the data, with little possibility for medication non-compliance or urine manipulation.
In the previous study by Furo et al., 19 EHR charts from July 1, 2017 to June 30, 2018, were reviewed. This current study reviewed charts from July 1, 2017 to June 30, 2019, expanding the dataset to a 2-year period. The inclusion criteria of the current study were the same as those in the initial study; (1) history of OUD diagnosis according to the DSM-5; (2) residency in one of the halfway houses for more than 6 days, ensuring that their urine samples reflected the monitored buprenorphine intake because the half-life of buprenorphine is approximately 25 to 70 hours20,21; (3) current buprenorphine product intake, verified by both EHR and the New York PDMP; and (4) available quantitative levels of “buprenorphine,” “norbuprenorphine,” and “creatinine” in urine samples. Based on these inclusion criteria, 61 patients were included for this study.
Chart review
This study obtained the following demographic information of 61 patients from the EHR: age, sex, race/ethnicity, number of days in the halfway house program, body mass index (BMI), employment status, marital status, educational level, smoking status, veteran status, and buprenorphine dose. Buprenorphine doses were also recorded to analyze the dose distribution among the patients. When the dose was adjusted during the study period, the maximum buprenorphine dose was used for the analysis. The buprenorphine dose and date of prescribing/dispensing of buprenorphine were verified in the New York PDMP, enabling us to link the urine test dates and the buprenorphine dose at the time of urine collection.
Urine “buprenorphine,” “norbuprenorphine,” and “creatinine” levels were collected from the EHR. Laboratory tests were performed at Quest Diagnostics. The test results reported only “buprenorphine” and “norbuprenorphine” as the buprenorphine metabolites, without any others being noted, such as “Bup-G” or “Norbup-G.” Moreover, “naloxone” and naloxone metabolite levels were not available in the EHR, even though all patients were on generic sublingual buprenorphine/naloxone film, confirmed by the New York PDMP. While “naloxone” levels can suggest urine adulteration22,23 and, therefore, be used to interpret urine test results, this study focused only on “buprenorphine” and “norbuprenorphine” levels.
Urine samples
This study included 378 urine samples from 61 patients after applying the inclusion criteria. Exclusion criteria in this study were applied as follows: (1) urine samples containing other substances, and (2) the “creatinine” level <20 mg/dL to exclude the possibility of any urine manipulation.
After applying these 2 exclusion criteria to the 378 urine samples, 7 were removed. Namely, this study excluded 1 urine sample because of a positive tetrahydrocannabinol (THC) result, which is a potential P450 3A4 inhibitor and can lower the urine “buprenorphine” metabolite levels.24,25 All other urine samples had only “buprenorphine” and its metabolites, without any other substances detected. In addition, the other 6 urine samples were excluded because of “creatinine” levels <20 mg/dL. The mean “creatinine” level of the 6 excluded urine samples was 13.7, ranging from 7 to 19mg/dL, and 3 of these urine samples were from the same patient, with creatinine levels of 7, 8, and 13.6 mg/dL, which suggested the presence of a medical condition or intake of a medication that could have reduced the “creatinine” levels. In summary, 371 urine samples from 61 patients were included in this study.
Data analysis
Data sets were stored and tabulated in Microsoft Excel, and descriptive statistics were applied. First, the demographic information of the 61 patients was reviewed. Next, the dose distribution of buprenorphine was examined among the 61 patients, and an association between the buprenorphine dose and distribution across the 371 urine samples was determined. Finally, an association between the buprenorphine dose and the “norbuprenorphine” to “creatinine” ratio was examined, using Microsoft Excel and IBM SPSS statistics software applications.
All tests were performed at the Quest Diagnostics laboratory. Urine “buprenorphine” and “norbuprenorphine” levels were measured in ng/mL, while the “creatinine” level was measured in mg/dL. Finally, “buprenorphine” to “creatinine” and “norbuprenorphine” to “creatinine” ratios were calculated with 10−4 for improved clarity. The upper limit of quantification for “buprenorphine” and “norbuprenorphine” detection assays was 2000 ng/mL, and all “buprenorphine” and “norbuprenorphine” levels >2000 ng/mL were regarded as 2000 ng/mL in the data analyses.
There were 3 urines samples with “buprenorphine” levels >2000 ng/mL, which were obtained from 2 patients, who were both on 12 mg/day of buprenorphine. There were 22 urine samples with “norbuprenorphine” levels >2000 ng/mL, including 1 urine sample from 1 patient on 6 mg/day of buprenorphine, 1 sample from 1 patient on 8 mg/day of buprenorphine, 16 samples from 5 patients on 12 mg/day of buprenorphine, and 4 samples from 4 patients on 16 mg/day of buprenorphine.
Results
Demographic information
The participants included 55 (90.2%) men and 6 (9.8%) women, with a mean age of 35.3 years. Most participants were white (90.2%), single (85.2%), smokers (83.6%), and non-veterans (97.2%). None of the participants were employed because residents of the halfway houses were not allowed to work, so that they could focus on their recovery from substance use disorder. All participants were engaging in intensive group/individual therapies, with some taking educational courses, such as courses to prepare for the GED Test or to become peer support workers. Table 1 summarizes the demographic information of the 61 patients.
Demographic information of the 61 patients.

Abbreviations:BMI, body mass index; GED, General Educational Development; SD, standard deviation.
Dose
All 61 patients were on generic sublingual buprenorphine/naloxone products, confirmed in the New York PDMP. Although their medications included naloxone in the combined formulation, this study focused on the effects of buprenorphine because sublingual administration of naloxone exerts minimal clinical effects26,27 and because data on naloxone levels were unavailable in the EHR.
To explore the dose distribution among the 61 patients, the dose of each patient was reviewed, recorded, and analyzed using Microsoft Excel. Figure 1 shows the dose distribution among all participants.

Number of patients taking buprenorphine at doses of 2, 4, 6, 8, 10, 12, 14, 16, and 20 mg/day. The x-axis shows the buprenorphine dose, and the y-axis shows the number of patients. Blue bars show the number of men, and orange bars show the number of women. The numbers inside the bars are the counts in each dose category.
The doses ranged from 2 to 20 mg/day as follows: 2 mg/day (n = 1), 4 mg/day (n = 2), 6 mg/day (n = 3), 8 mg/day (n = 19), 10 mg/day (n = 1), 12 mg/day (n = 17), 14 mg/day (n = 1), 16 mg/day (n = 16), and 20 mg/day (n = 1). The most common doses were 8-, 12-, and 16-mg/day, taken by 19, 17, and 16 patients, respectively. This might be due to the fact that generic buprenorphine/naloxone films are available in 2 mg/0.5 mg, 4 mg/1 mg, 8 mg/2 mg, and 12 mg/3 mg formulations. 1
Urine samples
A total of 371 urine samples from 61 patients were examined. Figure 2 demonstrates the buprenorphine dose distribution among the patients from whom urine samples were obtained. The urine samples were grouped by buprenorphine dose.

Distribution of urine samples by the buprenorphine dose. The x-axis shows the buprenorphine dose, and the y-axis shows the number of urine samples. The numbers on the bars are the urine sample counts in each dose category.
Figure 2 shows the 3 most common buprenorphine doses from which urine samples were obtained: 133 samples came from the patients who were on 12 mg/day, 82 samples from 16 mg/day, and 68 samples from 8 mg/day.
The 3 most common buprenorphine dose groups
The urine “norbuprenorphine” to “creatinine” ratio can indicate patient compliance with the buprenorphine treatment. 28 The ratio was examined in the 3 most common buprenorphine dose groups as in our previous study. 19 Figure 3 shows the box plots of the 3 groups in relation to the respective “norbuprenorphine” to “creatinine” ratios.

“Norbuprenorphine” to “creatinine” ratio distribution in the 3 most common dose groups (8-, 12-, and 16-mg/day). Data inside the boxes are expressed as median (interquartile range), indicated by the lines in the boxes, and as mean, indicated by the symbol “×.” The chart shows the mean, median, and lowest values in each group.
The minimum “norbuprenorphine” to “creatinine” ratios in the 8-, 12-, and 16-mg/day groups were 0.4, 0.1, and 1.3, respectively. These results were consistent with those of our previous study, except for the minimum “norbuprenorphine” to “creatinine” ratio in the 12-mg/day group, which was 1.6 in the previous study. 19 This discrepancy was explored by further analyzing the data in this study. In the 12-mg/day group, the “norbuprenorphine” to “creatinine” ratio showed 2 outliers (0.1 and 0.3), which came from the same patient. Figure 4 shows the distribution of the “norbuprenorphine” to “creatinine” ratio, which reveals the 2 lowest outliers.

Distribution of the “norbuprenorphine” to “creatinine” ratio in the 12-mg/day group. The x-axis shows the “norbuprenorphine” to “creatinine” ratios of the urine samples in the 12-mg/day group (×10−4), while the y-axis shows the frequency of the samples. Two lowest outliers from the range are found. After excluding these outliers, the minimum ratio is 1.6.
After excluding the 2 outliers, the lowest “norbuprenorphine” to “creatinine” ratio was 1.6 × 10⁻⁴, consistent with the previous study’s results (1.6 × 10⁻⁴). 19
Urine test results for each dose group
Urine samples came from patients who were on 2-, 4-, 6-, 8-, 12-, 14-, 16-, and 20-mg/day of buprenorphine. They were grouped separately and compared. Table 2 summarizes the “buprenorphine,” “norbuprenorphine,” and “creatinine” levels as well as the ratios of “buprenorphine” to “norbuprenorphine,” “buprenorphine” to “creatinine,” and “norbuprenorphine” to “creatinine” in relation to buprenorphine dose. The table includes range and mean ± standard deviation (SD). The ratios of “buprenorphine” to “norbuprenorphine,” “buprenorphine” to “creatinine,” and “norbuprenorphine” to “creatinine” were analyzed using the correlation coefficient (r). The median values were noted in the ratios between “norbuprenorphine” and “creatinine” levels to exclude the effect of outliers.
Summary of descriptive statistics comparing the buprenorphine dose to urine test results.
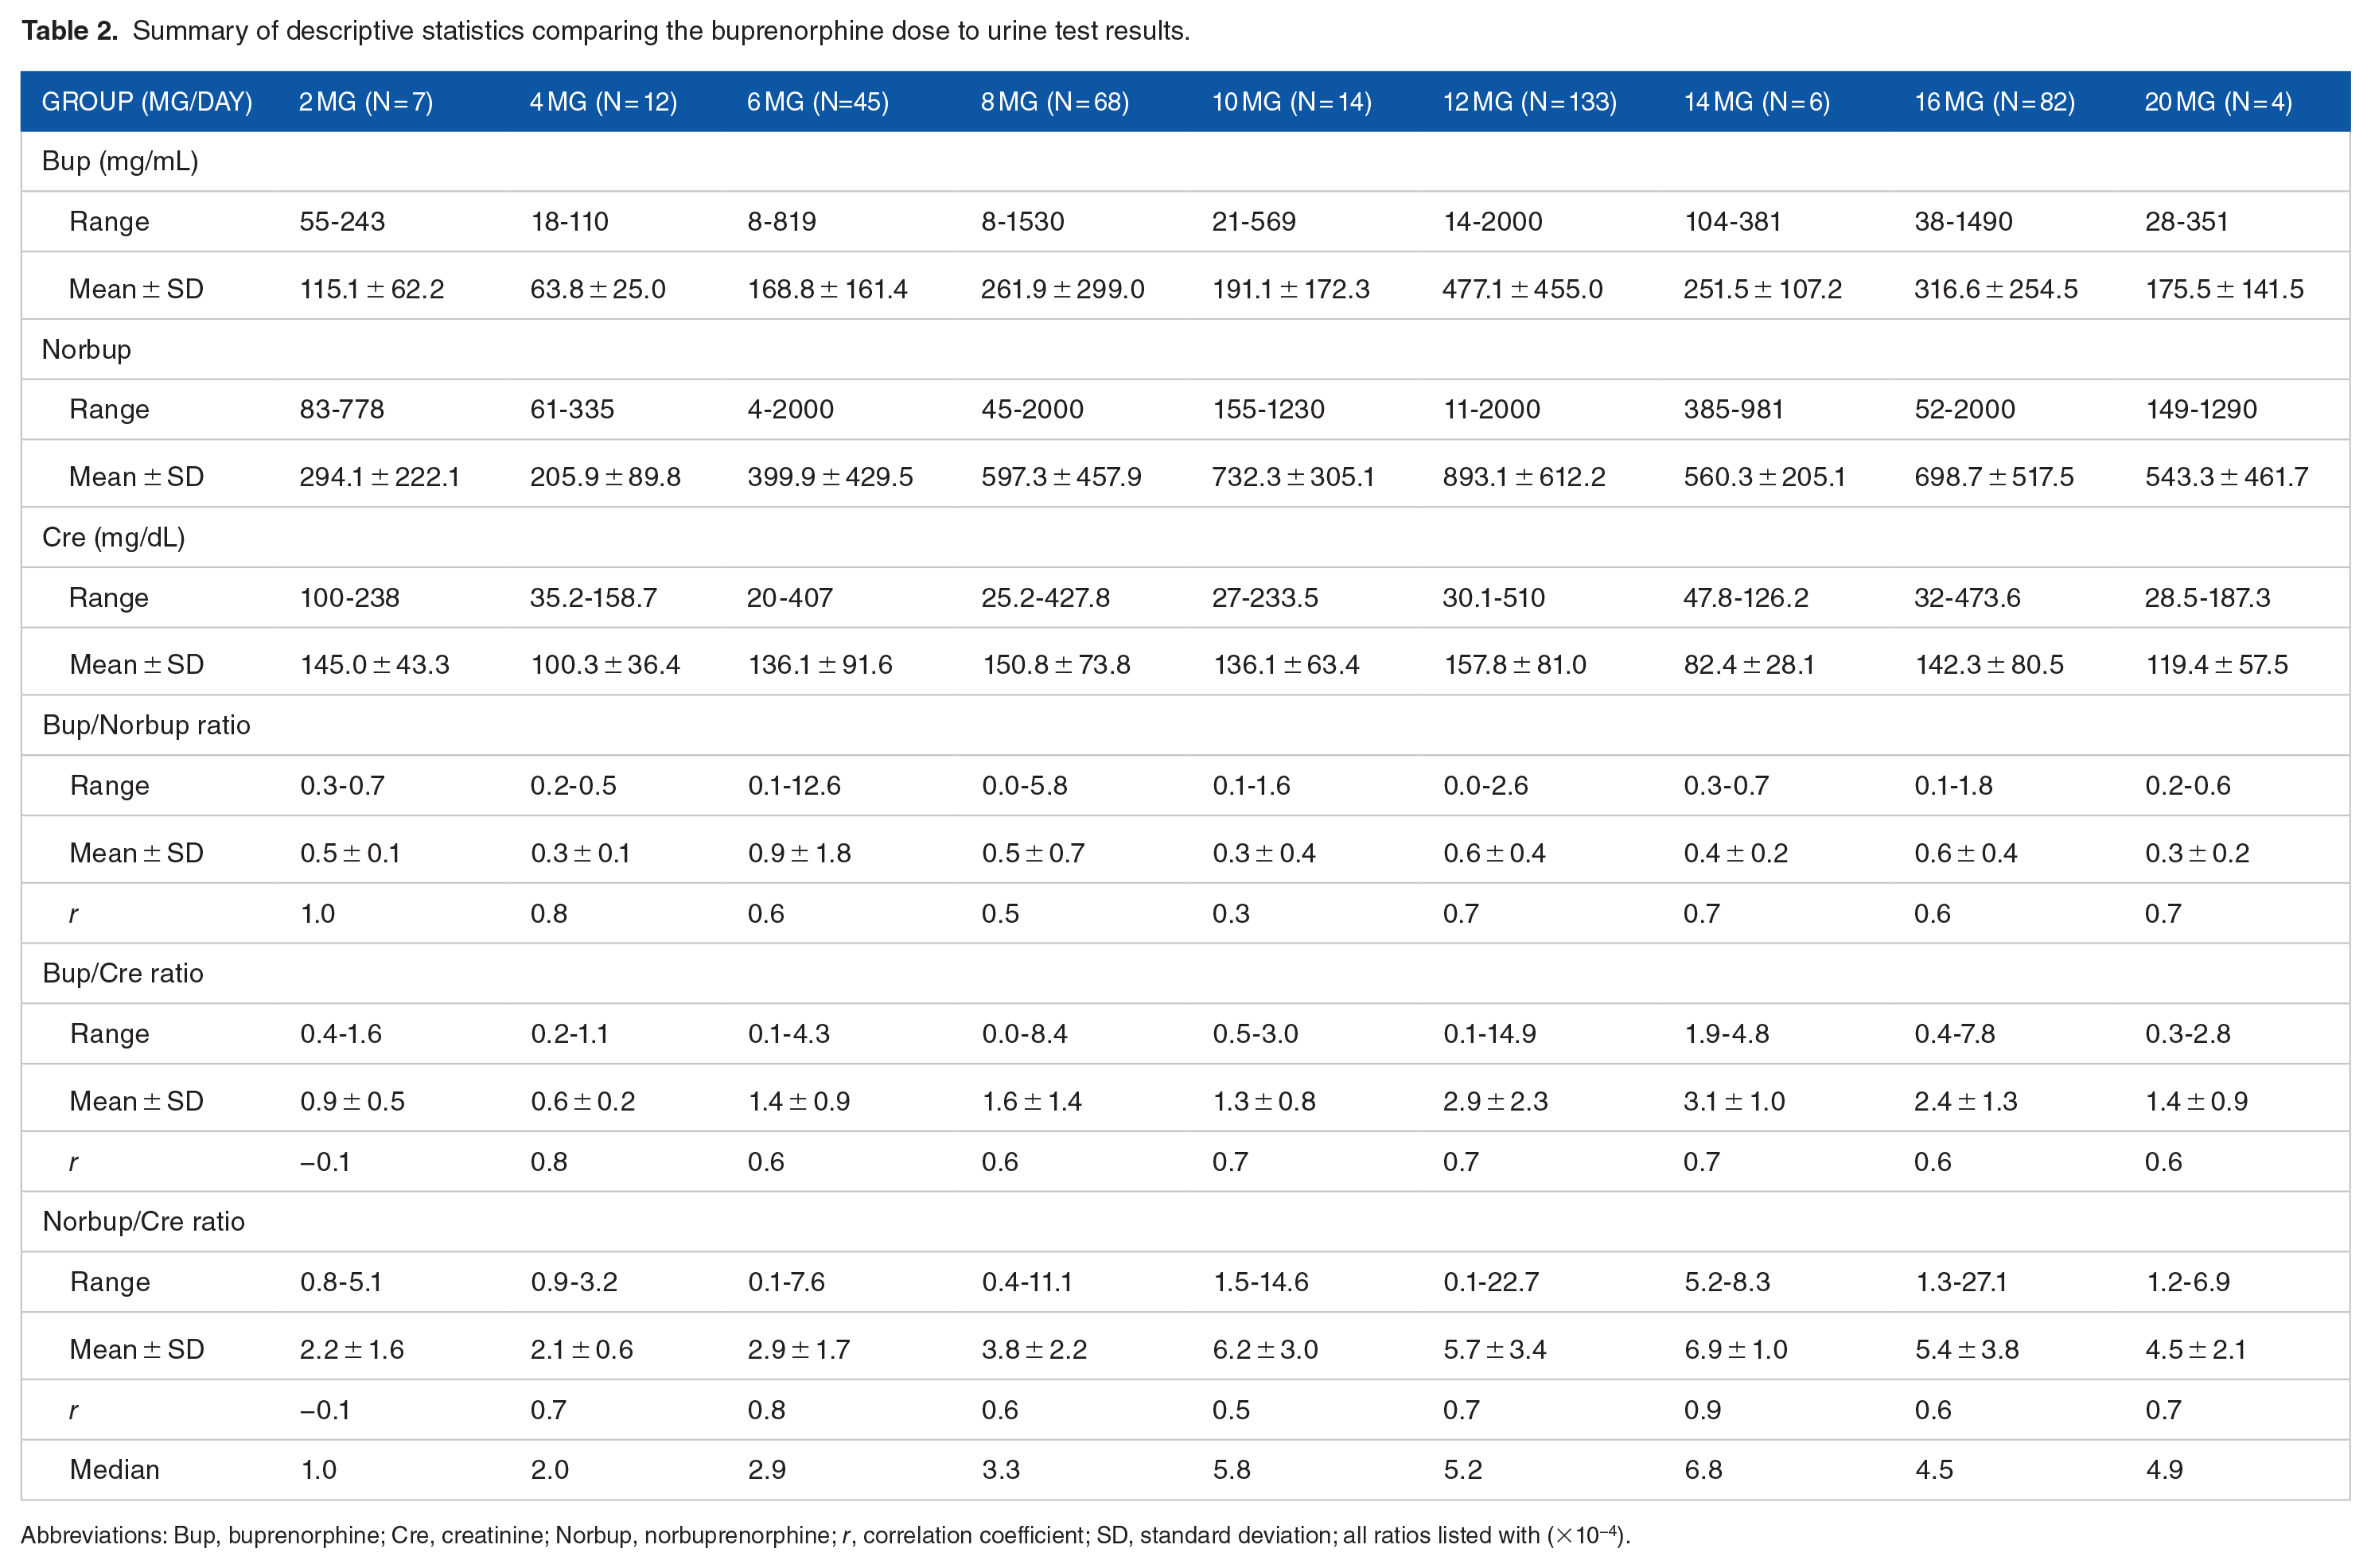
Abbreviations: Bup, buprenorphine; Cre, creatinine; Norbup, norbuprenorphine; r, correlation coefficient; SD, standard deviation; all ratios listed with (×10−4).
Based on the results on Table 2, each dose group was analyzed in relation to each category. Because the data sets in this study were non-parametrically distributed with different sample sizes in each dose group, the Kruskal–Wallis test was used for this data analysis. A statistical analysis was performed using IBM SPSS. First, an association between the dose and “buprenorphine” was analyzed: χ2(8, N = 373) = 66.143, P < .001, which showed that there was significant statistical association between the dose and “buprenorphine” levels. Secondly, the dose group and “norbuprenorphine” levels were analyzed, and the results indicated that there was statistical association between the dose and “norbuprenorphine” levels: χ2(8, N = 373) = 65.063, P < .001. Thirdly, the dose group and the “creatinine” levels were analyzed, which did not show statistical association between the dose and “creatinine” levels: χ2(8, N = 373) = 17.478, P = .026. Fourthly, the dose groups were examined in relation to the ratio between “buprenorphine” and “norbuprenorphine” and found that there was significant statistical association: χ2(8, N = 373) = 26.505, P < .001. In addition, the highest “buprenorphine” to “norbuprenorphine” ratio was 12.6 in the 6-mg/day group. All “buprenorphine” to “norbuprenorphine” ratios were <50:1, excluding the possibility of urine adulteration by dipping. Fifthly, an association between the dose group and the ratio between “buprenorphine” and “creatinine” were analyzed and found that there was significant statistical association: χ2(8, N = 373) = 76.946, P < .001.
An association between the buprenorphine dose and the “norbuprenorphine” to “creatinine” ratio in urine samples were explored further because the ratio between “norbuprenorphine” to “creatinine” can indicate patients’ compliance with the buprenorphine treatment. 29 The urine samples were grouped based on the buprenorphine dose, and the mean “norbuprenorphine” to “creatinine” ratio in each dose group was analyzed first using Microsoft Excel (Figure 5).

Mean “norbuprenorphine” to “creatinine” ratio in each buprenorphine dose category. The x-axis shows the buprenorphine dose, while the y-axis shows the mean “norbuprenorphine” to “creatinine” ratio of the urine samples in each group. The chart shows the natural logarithm equation and coefficient of determination r2.
The coefficient of determination r2 of the mean “norbuprenorphine” to “creatinine” ratio in urine samples of each dose group was .67, indicating a moderate association between the dose and the mean ratio. When the median ratios in the same samples were examined, r2 was .75, indicating a stronger correlation between the dose and the median “norbuprenorphine” to “creatinine” ratio in each group (Figure 6).

Median “norbuprenorphine” to “creatinine” ratio in each buprenorphine dose category. The x-axis shows the buprenorphine dose, while the y-axis shows the median “norbuprenorphine” to “creatinine” ratio of the urine samples in each group. The chart shows the natural logarithm equation and coefficient of determination r2.
As shown in Figure 6, r2 was .752, indicating a significant association between the buprenorphine dose and the median “norbuprenorphine” to “creatinine” ratio with the following formula: [y = 2.2661 ln(x) + 0.8211]. Therefore, the median “norbuprenorphine” to “creatinine” ratios for patients on 8-, 12-, and 16-mg/day of buprenorphine are expected to be 5.53 × 10⁻⁴, 6.45 × 10⁻⁴, and 7.10 × 10⁻⁴, respectively.
Next, an association of “norbuprenorphine” to “creatinine” ratios among these groups was explored. The analysis results showed a significant association between buprenorphine doses and the medians of “norbuprenorphine” to “creatinine” ratios: χ2(8, N = 373) = 80.265, P < .001. The post hoc Mann–Whitney U test was performed using an alpha set of 0.05 to compare all dose groups. The 3 most common dose groups (8-, 12-, and 16-mg/day) showed a significant association as follows: χ2(2, N = 283) = 20.247, P < .001). However, when the 12- and 16-mg/day groups were compared, no significant difference was detected (P = .227).
The key findings of this study are as follows: (1) The dose distribution among the 61 patients ranged from 2 to 20 mg/day, with a mean of 11.5 mg/day; (2) 6 urine samples had a creatinine level <20 mg/dL; (3) the maximum “buprenorphine” to “norbuprenorphine” ratio was 12.6, ruling out the possibility of urine adulteration; (4) the minimum “buprenorphine” to “norbuprenorphine” ratios in the 8-, 12-, and 16-mg/day groups were 0.5 × 10⁻⁴, 1.6 × 10⁻⁴ (excluding the 2 lower end outliers from 1 patient), and 1.4 × 10⁻⁴, respectively; (5) the buprenorphine dose did not show a strong association with the mean “norbuprenorphine” to “creatinine” ratio, but did show a strong association with the median “norbuprenorphine” to “creatinine” ratio with the Kruskal–Wallis test; and (6) the post hoc Mann–Whitney U test revealed significant differences among the 3 most common dose groups, except when the 12- and 16-mg/day groups were compared.
Discussion
The key findings of the previous study by Furo et al. 19 utilizing a total of 241 urine samples from 41 patients were as follows: (1) The buprenorphine dose ranged from 4 to 20 mg/day, with a mean of 10.5 mg/day; (2) the 3 most common doses were 8-, 12-, and 16-mg/day, with a total of 184 urine samples; (3) the “creatinine” levels of the 184 urine samples exceeded 20 mg/dL; (4) the “buprenorphine” to “norbuprenorphine” ratios of the 184 urine samples were all far below 50:1; (5) the minimum “norbuprenorphine” to “creatinine” ratios in the 8-, 12-, and 16-mg/day dose groups were 0.4 × 10⁻⁴, 1.6 × 10⁻⁴, and 1.4 × 10⁻⁴ respectively; and (6) the mean “norbuprenorphine” to “creatinine” ratios differed significantly among the 3 dose groups but not between the 12- and 16-mg/day dose groups.
Compared to the previous study, the present study used data spanning a 2-year period with 371 urine samples from 61 patients to increase the power of the data analysis. Although the results of this study were similar to those of the previous study, 19 the following differences were observed: (1) a mean buprenorphine dose was 11.0 ± 3.8 mg/day with a range of 2 to 20 mg/day; (2) 6 urine samples were excluded due to creatinine levels <20 mg/dL; (3) minimum “norbuprenorphine” to “creatinine” ratios in the 8-, 12-, and 16-mg/day groups were 0.44 × 10⁻⁴ (n = 68), 0.1 × 10⁻⁴ (n = 133), and 1.37 × 10⁻⁴ (n = 82), respectively. However, similar to the previous study, the minimum “norbuprenorphine” to “creatinine” ratio in the 12-mg/day group was 1.6 × 10⁻⁴ after removing the 2 lower end outliers in the group; and (4) a significant association was found with the buprenorphine dose in the median ratio of “norbuprenorphine” to “creatinine,” but not found in the mean ratio.
The aforementioned differences can be explained. First, the range of the buprenorphine doses was increased by including the 2 mg/day dose in this study. This might be due to the fact that this expanded data had more patients, increasing the chances of a wider range of buprenorphine doses. Additionally, both this study and previous study found the maximum daily dose of buprenorphine among the participants was 20 mg/day. This also agrees with other research study results30,31 and SAMHSA’s recommendation of maximum dose during maintenance phase up to 16 mg/day. 3 However, there are some situations where individual variabilities should be considered such as genetically fast metabolism, pregnancy-related fast metabolism,32,33 post-op buprenorphine pain management, 34 and buprenorphine induced precipitated withdrawal treatment. 35 In these cases, higher doses may be required. Second, creatinine levels below 20 mg/dL were found in 6 urine samples in the present study but none in the previous study. Urine dilution manipulation is unlikely in either of these studies because of the closely monitored residential/clinical environments; therefore, the low urine creatinine levels in this study possibly resulted from other reasons such as illness or medication interaction. However, EHR was not qualitatively reviewed in either study; therefore, these speculations remain unconfirmed.
The minimum “norbuprenorphine” to “creatinine” ratios in the 8-, 12-, and 16-mg/day groups were similar in the previous study and this study, except for the 12-mg/day group, which had 0.1 × 10⁻⁴ of “norbuprenorphine” to “creatinine” ratio in this study, due to the 2 lower end outliers with “norbuprenorphine” levels of 7 and 8 ng/mL each. Urine “norbuprenorphine” levels may be reduced for various reasons, such as inconsistent buprenorphine intake, 13 low metabolism, age 36 and gender 37 (older people and men have lower P450 3A4 activities), P450 3A4 inhibiting medication intake 38 and illnesses that can decrease metabolisms of buprenorphine in the liver including liver disease. 39 Because these studies did not review the qualitative EHR data, the cause of the 2 outliers could not be identified; however, after excluding these outliers, the minimum “norbuprenorphine” to “creatinine” ratio was 1.6 × 10⁻⁴, the same as the previous study. 19
Finally, using an expanded dataset, this study delineated an association between the buprenorphine dose and the “norbuprenorphine” to “creatinine” ratio in various dose groups. The buprenorphine dose and the median ratio showed a significant association, which was a new finding in this study.
In summary, the present and previous studies had many similarities and differences. 19 Taken together, the results of this study confirmed those of the previous study, and the discrepancies could be explained as outlying cases. Therefore, the results of these 2 studies can be applied to OUD treatment practice. Namely, concerns should be raised regarding patients’ treatment progress when the following features are detected in buprenorphine treatment for OUD patients: (1) buprenorphine dose over 24 mg/day; (2) unexpected substance(s) detected in urine sample; (3) creatinine level <20 mg/dL in urine sample; (4) “buprenorphine” to “norbuprenorphine” ratio >50:1; and (5) “norbuprenorphine” to “creatinine” ratio below 0.5 × 10⁻⁴ in the urines samples from those on 8-mg/day and 1.5 × 10⁻⁴ on 12 mg/day or more of buprenorphine intake.
Although these alarming features can be influenced by various factors such as patients’ medical issues and medication interactions, providers should pay close attention to the patients’ treatment progress with these features when treating OUD patients with buprenorphine products in outpatient clinic settings, so that they could detect intentional or unintentional treatment non-compliance. Providers should monitor their progress closely and gather more information from these patients to identify the cause(s) of possible non-compliance, so providers can adjust their patients’ treatment plans accordingly and achieve an optimal treatment outcome for the patients. The following is a list of things that providers can do when they find these alarming features in buprenorphine treatment.
(1) Patient education on buprenorphine intake: For unintentional non-compliance, patients’ buprenorphine intake should be monitored closely, as they might be swallowing or chewing buprenorphine films. Patients may be asked to take buprenorphine under observation in clinical or telemedicine settings, if necessary. In addition, they should be properly instructed not to eat, smoke or drink any liquids immediately before and after sublingual buprenorphine intake because these activities can prevent optimal absorption of buprenorphine. 22 Sublingual buprenorphine products require careful supervision during intake for desired effects, and patient education should be reinforced in the presence of these alarming features.
(2) Diversion: In the case of intentional non-compliance, such as diversion of buprenorphine products for various reasons, providers should discuss the causes with the patients. The following 3 causes are common:
40
a. Helping others: Buprenorphine can be diverted to others to help them avoid opioid overdose.41,42 Since the onset of the COVID-19 pandemic, various modifications in the buprenorphine treatment have been implemented, such as wider telemedicine practice and lower threshold of treatment requirements, to make it easier for more patients to access buprenorphine treatment programs. Therefore, people who receive diverted buprenorphine should be encouraged to contact nearby OUD treatment centers or convenient telemedicine programs for a professionally monitored treatment with a safer treatment protocol. b. Diverting buprenorphine for financial gain: Buprenorphine products are sold in the black market.
43
Some patients use this financial gain as their livelihood, while others may trade their buprenorphine for heroin or other substance(s) of lower street value. These practices can be hindered by closer monitoring with shorter visit intervals and fewer days of buprenorphine prescription. Some patients might require initiation of new techniques, such as micro-dosing induction of buprenorphine in cases of continuous illicit opioid use.
44
c. Requiring higher level of care: Some patients may require a higher level of care, such as a detoxification program, a full opioid agonist, or the long-acting subcutaneous buprenorphine, because outpatient buprenorphine treatment is ineffective when using illicit opioids. Depending on available options and patient preference, providers should formulate the most appropriate treatment program and make recommendations accordingly.
1
With these efforts to maximize patient compliance, providers can help patients achieve optimal treatment outcomes. Our ultimate goals when monitoring patients’ urine tests should not be punitive but of a supportive nature, such that their OUD can be improved with a targeted treatment plan.
Limitations
This study had similar limitations to the previous study. 19 As data of the present and previous studies overlapped, many limitations of the previous study persisted. First, this study utilized an expanded dataset from our previous study, which increased the statistical power of the data analysis. However, more data is still required to generalize and confirm the outcome of these studies. Large-scale studies should still be performed in the future. Second, this study reviewed “buprenorphine,” “norbuprenorphine,” and “creatinine” levels reported by the Quest Diagnostics laboratory, which does not quantitatively report “buprenorphine” or “norbuprenorphine” levels >2000 ng/mL. Therefore, levels above 2000 ng/mL were regarded as 2000 ng/mL for calculation, which may have resulted in imprecise data analyses. Third, although halfway house residents were well monitored for medication intake in their living environment and most urine samples, if not all, were collected under observation, urine manipulation, however highly unlikely, was a possibility. Fourth, this study performed quantitative analyses without reviewing the EHR charts of the patients. Therefore, patients’ medical history or medication information was not included, preventing qualitative analyses of the quantitative results in this study. The qualitative analyses could have explained the quantitative analysis results and helped us understand the overall picture better. Finally, these studies did not review the time gap between buprenorphine administration and urine sample collection, as it can influence the “buprenorphine” and “norbuprenorphine” levels and, consequently, influence the results of this study. Despite these limitations, these results could enhance our understanding as to how quantitative urine test results can be interpreted, contributing to better patient care in outpatient opioid treatment programs.
Conclusions
Urine tests are performed in opioid treatment programs to detect patients’ treatment compliance. The results impact future treatment decisions, such as whether the treatment should be continued or switched to an alternative option. Interpreting the urine test results and applying them to daily patient care can be challenging because they are influenced by various factors such as timing of buprenorphine intake, medical history, and other current medications. This retrospective study was aimed at examining an association between buprenorphine dose and the “norbuprenorphine” to “creatinine” ratio in urine samples, thereby helping providers interpret urine test results more accurately. The results of this study have confirmed those of our previous study and proven that the buprenorphine dose and the median “norbuprenorphine” to “creatinine” ratios were statistically associated. This finding can assist buprenorphine providers in interpreting urine test results and applying the results to formulate optimal treatment plans at OBOT programs.
Footnotes
Acknowledgements
We would like to express our sincere appreciation for the anonymous reviewers who provided us with insightful feedback. We would also like to thank Editage for providing English language editing services.
Funding:
The author(s) received no financial support for the research, authorship, and/or publication of this article.
Declaration of Conflicting Interests:
The author(s) declared no potential conflicts of interest with respect to the research, authorship, and/or publication of this article.
Author contributions
HF worked on design, IRB application, data collection, data analysis, manuscript preparation and revision of the manuscript. All other authors (TW, MR, DS, RS, PE) contributed to the study concept, IRB application, data collection, data analysis, manuscript preparation, and/or revision of the manuscript. HF is responsible for all errors.