
Abstract
This study is a 6-month retrospective analysis of urine drug testing (UDT) data from a pain management population among specimens with clinician-ordered marijuana testing (N = 194 809). Descriptive statistics about the specimen positivity of clinician-ordered marijuana UDT are provided as well as other drug positivity. Specimens from men and adults aged 18 to 34 years had the highest prevalence rates of marijuana positivity. The prevalence of past-month marijuana use among a comparative national population was lower than the prevalence of positive marijuana tests in the UDT specimens by all characteristics. Among the specimens tested for illicit drugs and marijuana, 4.0% were positive for amphetamine, 2.8% were positive for cocaine, and 0.9% were positive for heroin. The most common prescription drugs listed were opioids (64.7%), benzodiazepines (20.5%), and antidepressants (19.9%). In sum, the findings reflect previous research showing high rates of marijuana use, illicit drug use, and prescription drug use in a pain management population.
Keywords
Introduction
Chronic pain affects more than 100 million Americans, 1 more than 3 times that of diabetes, and an estimated 5 million to 8 million use opioids for long-term pain management. 2 These numbers represent about 32% and 1.6% to 2.5% of the total US population, respectively. Within the pain management population, concurrent illicit drug use is common. For example, Manchikanti et al 3 showed that 34% of pain management patients with a history of prescription drug abuse concurrently used marijuana or cocaine, whereas 14% of patients with no abuse history also used marijuana or cocaine. In a retrospective study of more than 450 000 patients prescribed opiate pain medicines, illicit use of substances occurred at rates of 13.1% in men and 8.2% in women. 4 Nearly a decade ago, Cone et al 5 found that 8.9% of the 10 922 pain management patients who tested positive for at least one drug or metabolite were positive for tetrahydrocannabinol (THC)—the main ingredient in marijuana—or cannabinoids.
Urine drug testing (UDT) is used by pain management clinicians to determine whether their patients are taking their prescribed medications, nonprescribed medications, illicit drugs, or some combination of these. 6 Some clinicians order UDT before prescribing medication for pain management patients, followed by random intervals of testing. 7 Yet, a consensus about testing for marijuana use does not exist among pain management clinicians, and this is due—at least in part—to the various state laws governing marijuana across the United States. Specifically, although marijuana remains classified as a Schedule I drug under the Controlled Substances Act, as shown in Figure 1, 8 states (ie, Alaska, California, Colorado, Maine, Massachusetts, Nevada, Oregon, and Washington) have enacted laws that allow for adult regulated use, 28 states have enacted laws that allow for comprehensive medical marijuana programs, and 13 states have decriminalized small amounts of marijuana. (For this article, we use the National Conference of State Legislatures definition of comprehensive medical marijuana programs, which include each of the following criteria: (1) the protection from criminal penalties for using marijuana for a medical purpose; (2) access to marijuana through home cultivation, dispensaries, or some other system that is likely to be implemented; (3) an allowance for a variety of strains, including those more than “low THC”; and (4) an allowance for either smoking or vaporization of some kind of marijuana products, plant material, or extract. For more information, see National Conference of State Legislatures (NCSL). (2016, November 9). State medical marijuana laws, Table 1: State medical marijuana/cannabis program laws. Accessed January 10, 2017, at http://www.ncsl.org/research/health/state-medical-marijuana-laws.aspx) Thus, some clinicians may recommend or prescribe medical marijuana depending on state law, other clinicians may refuse to prescribe other medications if a patient uses marijuana, and still others may simply not want to know about their patients’ marijuana use.7,8

United States by census region and marijuana laws, as of January 2017.
Characteristics of pain management patients aged 12 years or older who underwent clinician-requested urine drug testing for marijuana from May 6 to November 1, 2016.

Total cases include those cases in which marijuana testing was explicitly requested. Cases in which specimens were determined to be diluted, adulterated, insufficient, or otherwise invalid, as well as cases with reported prescriptions for marijuana cigarettes, Marinol capsules, or medical marijuana, were excluded.
Number of specimens includes only those specimens with definitive result of marijuana testing.
Toxicology laboratories that test clinician-ordered specimens can provide a unique and objective perspective of pain management patients in terms of compliance, potential drug misuse, identification of dangerous polydrug use, and assessment of potential undertreatment of patients. Specifically, positive results from toxicology laboratories can serve as an early warning to help clinicians determine whether early prevention of or intervention in drug misuse or abuse is needed, which could result in a timely substance abuse treatment referral. These data can also help inform the guidelines for best practices in UDT among pain management patients, which continue to evolve. Notably, toxicologic studies of pain management patients are limited, particularly in the substance abuse treatment area, where there could be significant overlap in populations. In addition, the need to assess the prevalence of marijuana use in these populations is particularly important with the growing research supporting medical marijuana treatment of many illnesses involving pain and the concurrent changes to the legal status of marijuana across the United States.
Although clinicians can use many tools (eg, patient questionnaire) to assess their patients in pain management settings, this publication focuses on the use of UDT. Herein, we provide a 6-month retrospective analysis of UDT data from a pain management population with a specific focus on clinician-ordered marijuana testing. This article provides descriptive statistics about the specimen positivity of clinician-ordered marijuana UDT. In addition, we describe selected illicit drugs identified in UDT of pain management patients. Selected demographic information is provided in addition to geographic patterns. To provide some comparison between the prevalence of positive marijuana tests in the analysis sample of pain management specimens and other external findings, we compare our toxicology findings to data from the National Survey on Drug Use and Health (NSDUH) by sex, age, and US census region.
Methods
Sample
From May 6 through November 1, 2016, the Ameritox toxicology laboratory (Greensboro, NC, USA) received more than 264 500 urine specimens from pain management clinics across the United States. This time frame for the selection of patients was dictated by the initiation of a new analytical method in the Ameritox Laboratory. The method was validated in accordance with the College of American Pathologists (CAP) guidelines, and the time frame ensured that all specimens were treated the same in this population.
Specimens underwent screening and confirmation testing on validated instrumentation according to laboratory standard operating procedures. Among the specimens, 194 809 (73.6%) included specific clinician requests for the testing of marijuana. This de-identified subset of specimens was the focus of this retrospective data analysis. Of the specimens with clinician-requested marijuana testing, 5309 were excluded from the analysis on the basis of laboratory criteria for adulterated, diluted, invalid, or substituted specimens. 9 In addition, specimens of insufficient quantity and oxidant activity were excluded. The limit of quantitation for the marijuana metabolite at Ameriox is 5 ng/mL.
Submitted specimens included clinician-reported prescriptions for each patient identification number, representing a total of 416 725 prescriptions across the 194 809 specimens. Among specimens with a valid test for marijuana, 677 specimens stemmed from patients with reported prescriptions for medical marijuana, marijuana cigarettes, dronabinol capsules, or Marinol capsules. For this analysis, these specimens were excluded. Once invalid specimens and specimens from patients with medical marijuana prescriptions were omitted, and the data were further restricted to patients aged 12 years and older, the final number of specimens analyzed was 187 450. With respect to the UDT data, although the sample size is quite large (n = 187 450) and the UDT laboratory has a national client base, the data in this report are not nationally representative. Thus, these findings do not reflect pain management clients overall. Moreover, the regional findings are not representative of the populations in those areas.
Measures
Each specimen included information on the patient’s age and sex. A small number of specimens (n = 45) had an unspecified sex, neither men nor women; these specimens were excluded in any analyses pertaining to sex.
The patient’s state of residence was linked to the specimen data. These data were used to create a region variable with the 4 US census region levels (Northeast, Midwest, South, and West). More than 2000 specimens had missing or invalid state data (1.1% of the 187 450 specimens analyzed) and were excluded from results pertaining to location.
Because of clinicians’ individual practices or patient level of care, the number of specimens provided by a patient can vary over a given window of time. The number of specimens tested for marijuana provided by a unique patient ranged from 1 to 42 specimens over the study time frame. However, 59.5% of the specimens tested were the only specimen for a specific patient. More than 90% of the specimens obtained were from patients with 6 or fewer specimens submitted to the laboratory within the 6-month time frame. Because multiple specimens were submitted per patient, a categorical measure of number of specimens per patient was created with 5 levels: 1 specimen, 2 specimens, 3 to 5 specimens, 6 to 10 specimens, and 11 or more specimens.
Additional testing for illicit drugs other than marijuana included cocaine, heroin, amphetamine, 3,4-methylenedioxymethamphetamine, phencyclidine, synthetic cannabinoids, and synthetic cathinones. When requested by a clinician, data are available indicating whether one of these specific illicit drugs was present in the specimens of interest. Among the analysis pool of specimens tested for marijuana, the level of missingness, or percentage of specimens without the testing of the other drug, ranges from less than 3% for cocaine and amphetamine to around 70% for the synthetic cannabinoids (69.0%) and synthetic cathinones (73.3%). Thus, for the purposes of the study herein, we include only cocaine, heroin, and amphetamines because these drugs were the most commonly tested among the analysis pool and the frequencies supported further analysis. Heroin use was determined by testing for 6-acetylmorphine in patient urine.
Among the 187 450 specimens with valid clinician-requested tests for marijuana use, 159 081 (84.9%) included documentation on prescribed medications as reported by the requesting clinician. The data do not reflect a patient’s confirmed use of these prescribed medications, but they do provide some insight on marijuana use in conjunction with prescribed medication. Listed medications were categorized into 8 drug categories including barbiturates, benzodiazepines, muscle relaxants, antidepressants, antipsychotics, stimulants, opioids (including opiates), and other prescribed drugs. Certain prescription medications were classified into more than one of these categories. In addition, the number of prescribed medications for a given patient ranged from 1 to 33 (for an average of 2.5 prescribed medications); therefore, the 8 drug categories are not mutually exclusive groups of specimens.
Analysis
With no direct statistical inference to the larger population of all pain management specimens during the time period, during any other time period, or in any larger population, direct estimates of the prevalence of positive marijuana tests among the analysis pool did not require additional statistical weights or complex design structure. Data missingness was minimal for key demographic and geographic characteristics of interest; therefore, there was no imputation of the data, and unknown data were simply excluded. However, when testing for significant differences in prevalence across key measures, the authors needed to account for instances where multiple specimens stemmed from the same patient. A pseudo-design structure was implemented in which all data were incorporated under a single stratum and specimens belonging to a single patient were assigned to separate clusters identified by a unique patient identifier. The clustering of specimens from the same patient would address the differences in variance within and across the specimens. All analysis used SUDAAN (Research Triangle Institute, Research Triangle Park, NC, USA) 10 to account for this design.
For significance testing, Shah Wald F tests (transformed from the standard Wald χ 2 ) were used to compare subgroups across multiple levels of key measures. If these tests indicated overall significant differences, the significance of each particular pairwise comparison of interest was tested using a standard t test. This 2-step process reduces the number of inappropriate inferences drawn due to the number of pairwise differences tested. For this report, significant differences are reported when the P values from the respective tests are less than .01.
Supplementary NSDUH data analysis
Weighted estimates of past-month marijuana use by age group and sex were calculated using the 2015 NSDUH public use file. All analyses of the NSDUH data used SUDAAN to incorporate NSDUH analysis weights and its survey design structure. Significance testing of NSDUH data adhered to the same methods described earlier. A regional measure was not available in the 2015 NSDUH public use file; therefore, regional estimates of past-month marijuana use published in the 2015 NSDUH detailed tables 11 have been cited in tables and text within this report to provide additional comparisons.
Ethical considerations
The specimens that were used in this analysis were de-identified for this analysis. Ameritox is accredited by the CAP and abides by CAP, Clinical Laboratory Improvement Amendments, and Health Insurance Portability and Accountability Act requirements. Because this research was done as a secondary analysis and was conducted to draw clinical conclusions, neither US Food and Drug Administration nor other clinical trial review/approval was obtained by Ameritox. Finally, RTI International’s institutional review board (IRB) determined that receiving the de-identified data, conducting the secondary analysis, and writing this article did not involve human subjects as defined by the US Code of Federal Regulations (45 CFR 46.102); thus, the IRB’s approval of these specific research activities was not necessary.
Results
Table 1 presents demographic and other characteristics of the pain management patients with clinician-ordered UDT, including sex, age, and geographic area. Among the sample of pain management specimens overall, 44.7% were from male patients and 55.3% were from female patients. The age distribution followed a bell curve, with most of the pain management patients in the young-adult to middle-adult age groups. Specifically, 16.7% were aged 26 to 34 years, 29.1% were aged 35 to 49 years, and 33.3% were aged 50 to 64 years. The pain management specimens were primarily submitted by clinics located in the South (45.9%) and Midwest (27.6%) census regions, with fewer than 10% of the specimens emanating from the West (9.5%).
Table 1 also shows the prevalence rates of positive marijuana tests among these specimens by demographic and other selected characteristics. Men had a significantly higher prevalence rate for positive marijuana results than women (19.2% and 12.9%, respectively). By age group, younger adults had the highest prevalence rates, with more than 1 in 5 specimens testing positive for marijuana (28.5% for those aged 18-25 years and 22.9% for those aged 26-34 years). These rates among these younger adults were significantly higher than those in other age groups. Almost 1 in 6 (14.7%) specimens from adolescent patients aged 12 to 17 years tested positive for marijuana and more than 1 in 10 (12.6%) specimens from older patients aged 50 to 64 years tested positive for marijuana.
The significantly higher presence of marijuana in men than in women persisted across 5 of the 6 age groups, excluding patients aged 12 to 17 years. Among patients aged 12 to 17 years, 15.9% of men and 13.0% of women tested positive for marijuana use. The largest disparity in positive marijuana tests between men and women occurred within the 18- to 25-year-old age group (33.8% for men and 23.9% for women). Among the 26- to 34-year-old age group, 27.5% of men and 19.3% of women tested positive for marijuana. The disparity between sexes continues to decrease through the older age groups. For male patients, 20.9%, 15.5%, and 6.0% tested positive for marijuana among the 35- to 49-year-old age group, 50- to 54-year-old age group, and 65 and older age group, respectively. For female patients, 14.5%, 10.0%, and 2.8% tested positive among the same 3 age groups.
The highest prevalence rates by census region were found in the West (21.5%) and Northeast (17.7%). In the Midwest region, 15.1% of the specimens tested positive for marijuana, whereas 14.0% of specimens in the South had a positive marijuana test. Prevalence rates for all 4 regions were significantly different from each other.
When looking at positive tests of marijuana use by number of samples per patient, the prevalence rates ranged from 14.3% (11 or more samples) to 19.8% (6-10 samples). Among the largest group of cases, those with a unique specimen per patient, 15.1% tested positive for marijuana. This prevalence rate was significantly lower than that for most groups with more specimens per patient—16.2% (2 samples), 17.0% (3-5 samples), and 19.8% (6-10 samples). The aforementioned group with 11 or more samples had a 14.3% prevalence rate.
The NSDUH, an annual nationwide survey of approximately 70 000 randomly selected individuals, is a primary source of self-reported information on the prevalence, patterns, and consequences of alcohol, tobacco, and illegal drug use and abuse and mental disorders in the US civilian, noninstitutionalized population, aged 12 years and older. As such, NSDUH data provide a comparative context as measured by past-month marijuana use (Table 2). This 30-day measure is appropriate because marijuana can be detected in urine from several days to several weeks. 12
Marijuana use in the past month among persons aged 12 years or older, by sex, age, and region: numbers in thousands and percentages, 2015 National Survey on Drug Use and Health.
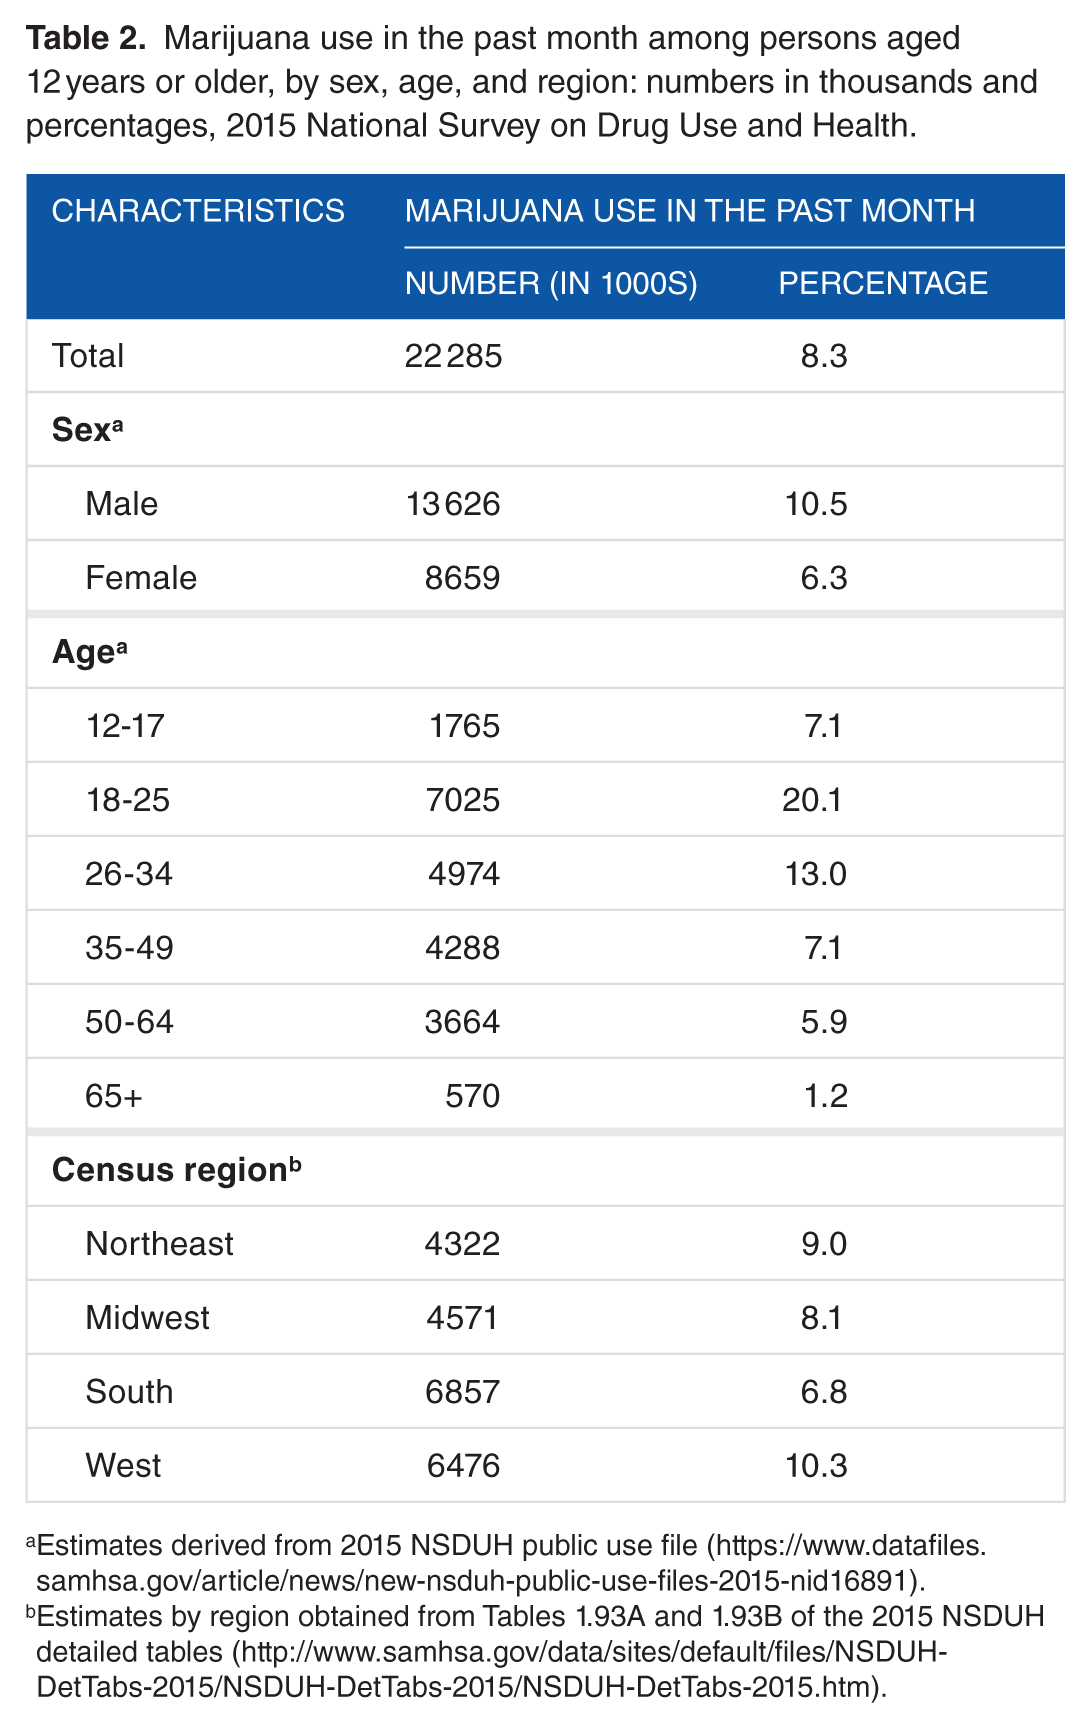
Estimates derived from 2015 NSDUH public use file (https://www.datafiles.samhsa.gov/article/news/new-nsduh-public-use-files-2015-nid16891).
Estimates by region obtained from Tables 1.93A and 1.93B of the 2015 NSDUH detailed tables (http://www.samhsa.gov/data/sites/default/files/NSDUH-DetTabs-2015/NSDUH-DetTabs-2015/NSDUH-DetTabs-2015.htm).
Across each NSDUH demographic group, the prevalence of past-month use of marijuana among the national population data was lower than the prevalence of positive marijuana tests in the UDT specimens of the pain management population administered UDT in this study. Specifically, in the 2015 NSDUH sample of persons aged 12 years or older, 8.3% said that they had used marijuana in the past month—a little more than half the prevalence in the pain management population studied with UDT (15.7%). In the NSDUH sample, men aged 12 years and older had a significantly higher prevalence of past-month marijuana use (10.5%) than women (6.3%), which echoes the differences in the presence of marijuana in the UDT data for men and women.
Past-month marijuana use by age category in the NSDUH sample shows a bell curve skewed more to the left than that of the UDT sample. In the NSDUH, the highest rates of past-month marijuana use belong to young adults aged 18 to 25 years (20.1%) and 26 to 34 years (13.0%), a result similar to that in the UDT data. These rates among younger adults were significantly higher than in all other age groups. Significant differences in past-month marijuana use between men and women were found in all age groups except adolescents aged 12 to 17 years (7.5% for men and 6.7% for women) and adults aged 65 years or older (1.8% for men and 0.8% for women). The disparity in past-month marijuana use between men and women was highest in the 18- to 25-year old age group (23.6% for men and 16.7% for women) and the 26- to 34-year-old age group (16.5% for men and 9.5% for women). Within the 35- to 49-year-old age group, 9.4% of men and 4.9% of women had used marijuana in the past month. Among the 50- to 64-year-old age group, 7.6% of men and 4.3% of women had past-month marijuana use.
Similar patterns in marijuana use by census region were also found in both the national findings of the NSDUH and the UDT data. The NSDUH found the highest rates of past-month marijuana use in the West (10.3%) and Northeast (9.0%) (results of significant differences in past-month marijuana use between census regions for 2015 have not been published, and regional information is not currently available on NSDUH public use files). The NSDUH survey is designed to provide regionally representative estimates, whereas the UDT sample’s regional representation is based solely on the location of patients from which specimens were submitted by clinicians, hence the larger proportion of cases from the South. Despite this limitation, the prevalence rates are notably similar.
In addition to results of marijuana testing, the UDT data also provide findings on the presence of other illicit drugs when testing was conducted. Table 3 shows the presence of marijuana among specimens also tested for amphetamines, cocaine, and heroin. More than 97% of the 187 450 specimens with valid results from clinician-requested marijuana testing were also tested for amphetamine and cocaine (97.7% and 97.2%, respectively), and 93.8% (175 757) were tested for both marijuana and heroin.
Percentage distributions of pain management patients aged 12 years or older with clinician-requested marijuana urine drug testing and presence of marijuana, by presence of other illicit drugs.

Total cases include those cases in which marijuana testing was explicitly requested. Cases in which specimens were determined to be diluted, adulterated, insufficient, or otherwise invalid, as well as cases with reported prescriptions for marijuana cigarettes, Marinol capsules, or medical marijuana, were excluded.
Respective percentage distributions are among only those specimens tested for both marijuana and the respective illicit drug.
No prescription amphetamine was noted by the clinician on the request for analysis form.
Among the 183 152 specimens tested for both amphetamine and marijuana, 7281 (4.0%) had a positive test for amphetamine. About one-third (31.5%) of specimens with a positive test for amphetamine also tested positive for marijuana. Similarly, among specimens with a positive test for cocaine (5095), 33.6% also tested positive for marijuana. Fewer than 1% (1552) of the specimens tested for both heroin and marijuana were positive for heroin. Among the 1552 specimens that tested positive for heroin, 363 (23.4%) specimens also tested positive for marijuana.
The toxicology data can also show the tests for commonly prescribed medications requested by submitting clinicians who requested marijuana testing. Table 4 categorizes specific prescription drugs listed by clinicians in the major prescription drug categories on the request for analysis form along with specimens with marijuana present. Notably, data in Table 4 do not reflect analytically confirmed data to illustrate patient conformance with prescribed medications. Moreover, specimens that were listed with prescription marijuana were excluded from these data.
Percentage distributions of pain management patients aged 12 years or older administered urine drug testing with clinician-requested marijuana testing and presence of marijuana, by drug category of clinician-reported prescribed medication.
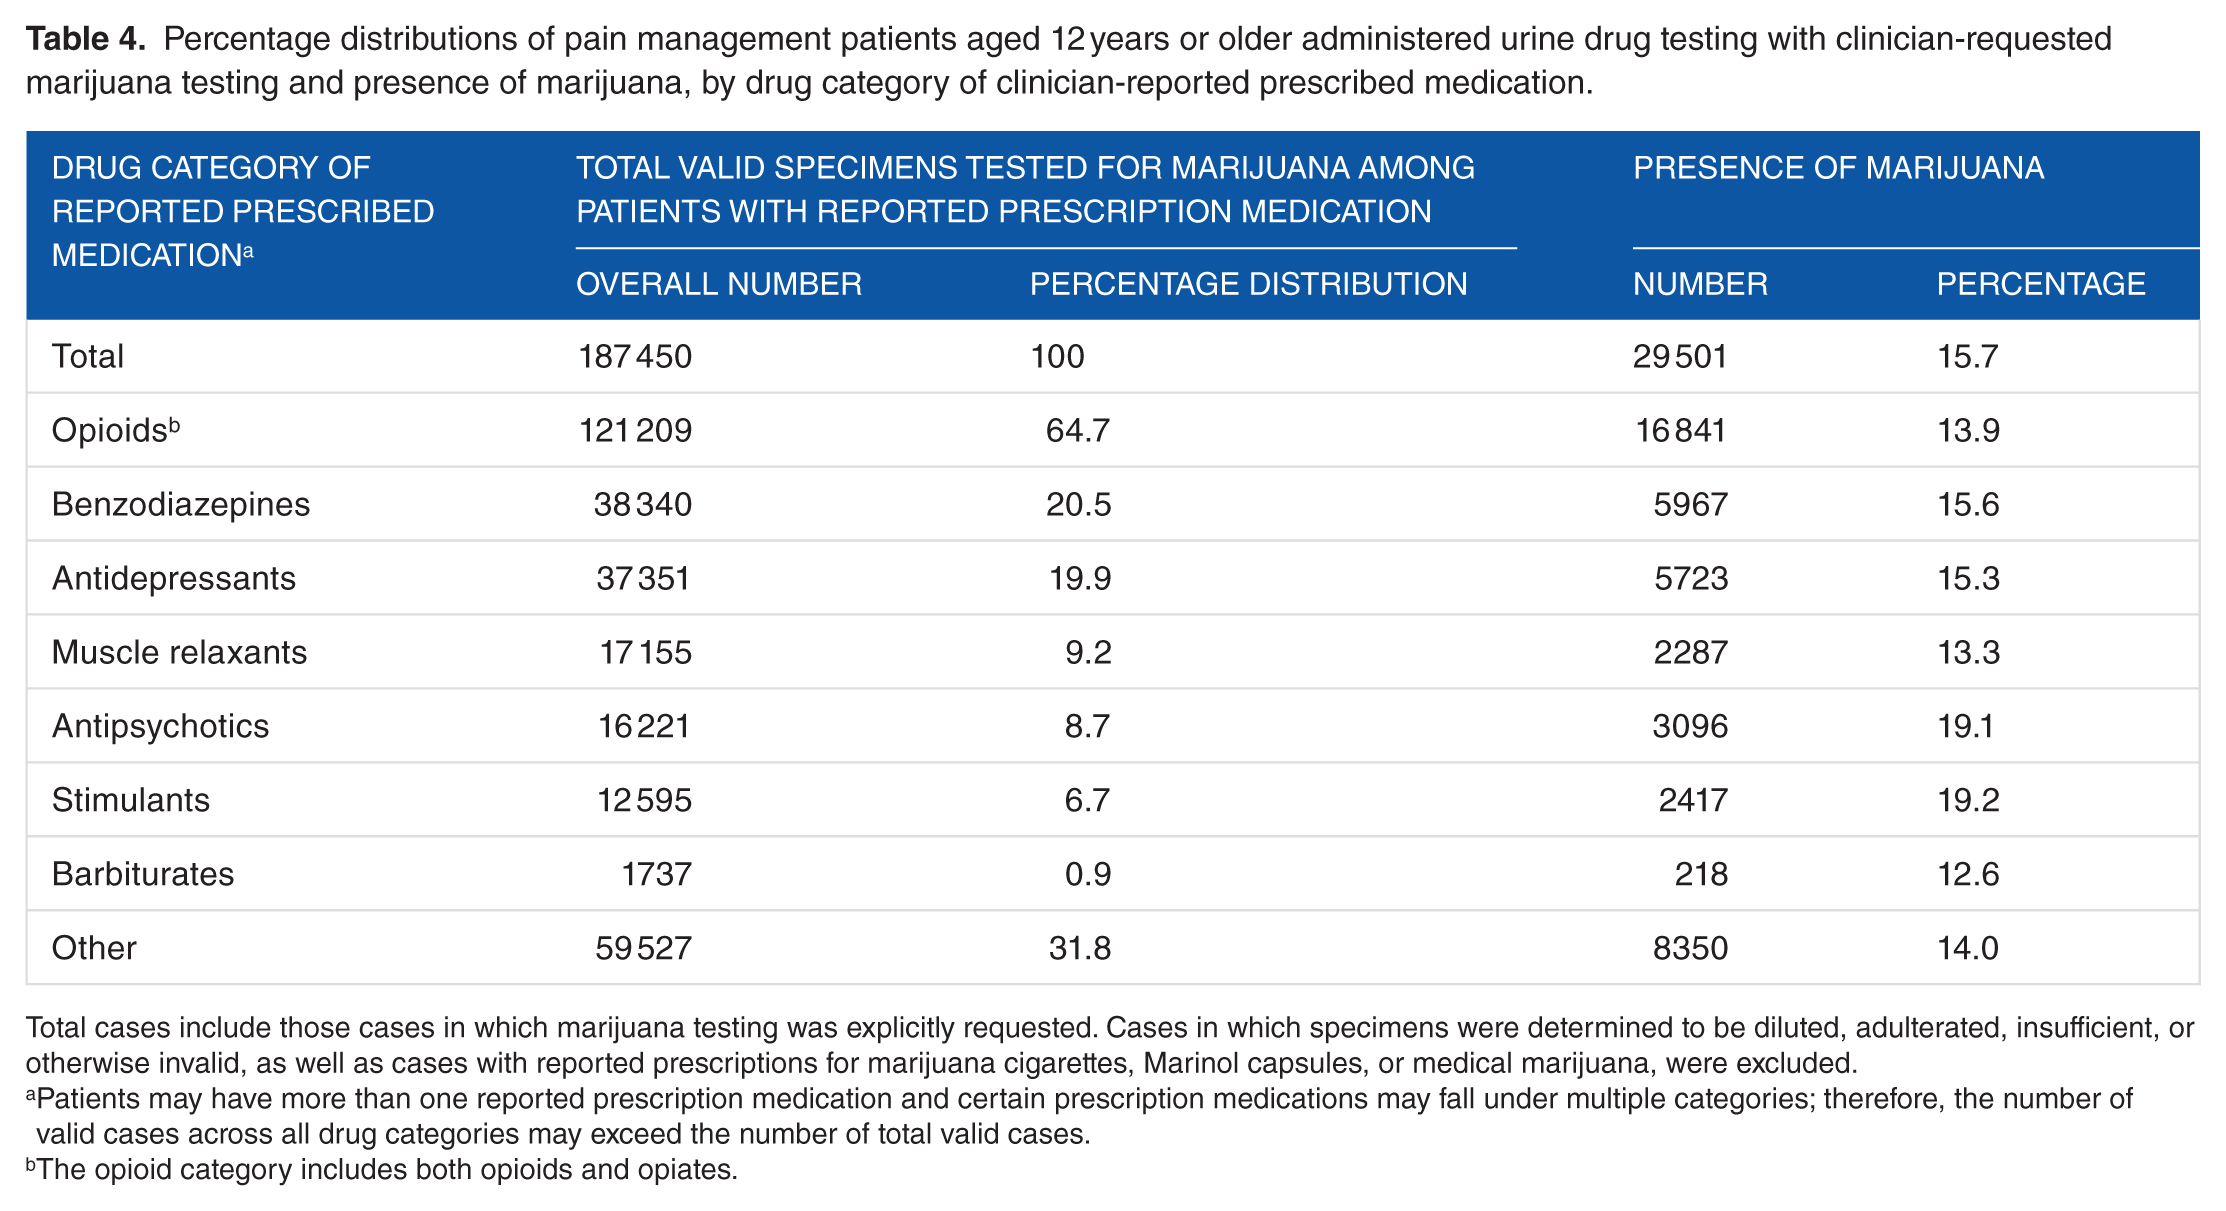
Total cases include those cases in which marijuana testing was explicitly requested. Cases in which specimens were determined to be diluted, adulterated, insufficient, or otherwise invalid, as well as cases with reported prescriptions for marijuana cigarettes, Marinol capsules, or medical marijuana, were excluded.
Patients may have more than one reported prescription medication and certain prescription medications may fall under multiple categories; therefore, the number of valid cases across all drug categories may exceed the number of total valid cases.
The opioid category includes both opioids and opiates.
On average, 2.5 prescription drugs were listed on the request for analysis form for each specimen, and this number did not vary appreciably by sex, age, or geographic region (data not shown). Overall, of the specimens with requested marijuana testing, the most common drugs listed as prescriptions were opioids (64.7%) and drugs that treated mental health conditions, including benzodiazepines (20.5%) and antidepressants (19.9%).
Reported prescriptions of antipsychotics and stimulants were some of the less common drug categories reported (8.7% and 6.7%, respectively); however, specimens from patients with these types of prescribed drugs had the highest rates of positive marijuana tests. Among the 16 221 specimens with a reported prescription for an antipsychotic, 19.1% tested positive for marijuana. Similarly, among the 12 595 specimens with a prescribed stimulant, 19.2% tested positive for marijuana. Specimens from patients with clinician-reported prescriptions for barbiturates and muscle relaxants had a lower prevalence of marijuana (12.6% and 13.3%, respectively.) Specimens linked to prescribed benzodiazepines and antidepressants had rates just under the overall average rate of 15.7% (15.6% for benzodiazepines and 15.3% for antidepressants). Among the specimens linked to prescribed opioids, 13.9% tested positive for marijuana.
Discussion
This study illuminated several important points regarding marijuana use in particular—and other drug use in general—in a pain management population. With an overall percentage of 15.7%, the study findings align with previous studies showing overall prevalence rates of marijuana in pain management populations of 6% to 39%.5,13 It has been demonstrated that pain management patients supplement their opioid therapy with marijuana use5,14 and even substitute marijuana for prescription opioids, 15 which may reflect marijuana’s analgesic and sedative properties.14–16 The prevalence rate found among the pain management sample herein is nearly double that of the NSDUH estimate of past-month marijuana use among persons aged 12 years or older (8.3%). Moreover, the percentages of marijuana presence in the pain management UDT samples were consistently higher than those in the general population aged 12 years or older, regardless of age group.
Among the specimens in this study that were tested for heroin, cocaine, and amphetamine, in addition to marijuana, roughly 7.4% of specimens tested positive for heroin, cocaine, or amphetamines, which is a higher rate than in the US general population. 17 The findings related to positivity rates for marijuana, cocaine, and amphetamines are consistent with research conducted nearly a decade ago. 5 In the study by Cone et al of a pain management population, results from screening and confirmation testing over a 12-month period in 2006 were examined (N = 13 948 urine specimens). Overall, 10 922 specimens were confirmed positive for at least 1 drug or metabolite, with confirmed positive rates as follows: marijuana/THC (8.9% in the study by Cone, compared with 15.7% in this study); cocaine (2.8% in both studies); and amphetamines (1.5% in the study by Cone and 4.0% in this study).
The 14.7% prevalence rate of positive marijuana test results among the 12- to 17-year age group was notable in light of other research showing that initiating marijuana use during adolescence is associated with a higher rate of dependence than is initiating marijuana use at an older age (17% vs 9%).
18
Thus, for adolescents in pain management treatment, it may be important to test for marijuana use at a higher rate than in adults. However, care should be taken to address multiple aspects of the patients’ drug history, risk factors, mental health, and communication with the toxicologist in interpreting testing results to determine the best course of action to positive UDT, which can range from nonadherence and illicit drug use. As the Centers for Disease Control and Prevention (CDC) recently noted,
6
Clinicians should not dismiss patients from care based on urine drug test result because this could constitute patient abandonment and could have adverse consequences for patient safety, potentially including the patient obtaining opioids from alternative sources and the clinician missing opportunities to facilitate treatment for substance use disorder.
With an increasing number of states passing medical marijuana laws and others decriminalizing marijuana altogether concurrent with the rise in opioid treatment for pain management, the pain management and substance abuse treatment communities may find significant patient overlap. On one hand, pain management patients with a history of substance use have been shown to be at increased risk for being discharged from pain management treatment 19 and have more complex physical and mental health histories, including greater reported pain and interference, licit and illicit substance use problems, mental health problems, and use of medications for psychotherapeutic ends. 14 On the other hand, patients in substance abuse treatment are often difficult to treat if they have a chronic pain condition and require pain relief in the form of prescription drugs. 20 Thus, it is imperative that pain management and substance abuse treatment professionals work together to facilitate cross-referrals for patients who need additional services.
Along those lines, at a time when marijuana use is more widely accepted, it will be critical for substance abuse treatment interventions and treatments to be tailored to meet the needs of the pain management population. The scientific literature is rife with evidence suggesting that substance abuse treatment should be tailored by sex 21 and age, 22 but other characteristics—such as particular health conditions, including chronic pain—may be particularly salient for developing a treatment plan and identifying specialized services. The test results herein showed that being men and being of a younger age were significantly associated with positive marijuana urine tests among this sample of pain management patients, both patterns that have been seen in other pain management samples. 14 Given this profile, substance abuse treatment interventions tailored for chronic pain patients who are young adult men may be especially beneficial.
A number of data limitations must be addressed to put these findings into appropriate context. With respect to the UDT data, although the sample size is quite large and the UDT laboratory has a national client base, the data in this report are not nationally representative. Thus, these findings do not reflect pain management clients overall. Moreover, the regional findings are not representative of the populations in those areas.
The objective toxicology data are reported only for clinician-requested tests of illicitly used marijuana, amphetamine, cocaine, and heroin. Data to confirm whether pain management patients were compliant with their prescribed medications are not shown in this pain management population. Moreover, the frequency of UDT is left to the discretion of the pain management clinic or clinician. If a pain management clinic or specific clinician is known to test more often, there could be some inherent bias in the data if patients are aware of these practices and vary their behavior accordingly (eg, making appointments with favored clinicians within the pain management clinic on the basis of testing practices or changing clinics altogether). Moreover, testing frequency can also be affected by what insurance companies are willing to cover and the extent to which clinicians adhere to the CDC’s published guidelines. 6
The NSDUH comparison data have other limitations. Because the NSDUH is a large epidemiologic study that asks sensitive questions, marijuana use may be underreported. However, this limitation may be at least somewhat mitigated because respondents to the NSDUH enter their data via computer-assisted self-interviewing, which has been shown to reduce underreporting of sensitive behaviors such as substance use. 23
In this article, we focused on pain management patients, given how this population has grown exponentially in the past several years, but other populations for which clinician-requested UDT could be useful include substance abuse treatment, workplace drug testing, primary care testing, and human performance testing. Future research can examine these different types of requests to see patterns of abuse and use across these different populations.
Footnotes
Acknowledgements
The authors acknowledge Loretta Bohn for editing this manuscript and Kibri Everett for developing the map. They also thank RTI International’s Victoria Albright, Eric Otto Johnson, and Scott Novak for the opportunity to contribute to this review.
Peer review:
Six peer reviewers contributed to the peer review report. Reviewers’ reports totaled 2287 words, excluding any confidential comments to the academic editor.
Funding:
The author(s) disclosed receipt of the following financial support for the research, authorship, and/or publication of this article: This work was internally funded by RTI International and Ameritox.
Declaration of conflicting interests:
The author(s) declared no potential conflicts of interest with respect to the research, authorship, and/or publication of this article.
Author Contributions
HMS-M, DCH, KNM, GLM, and FNW conceived and designed the experiments. DCH analyzed the data. HMS-M, DCH, and KNM wrote the first draft of the manuscript. HMS-M, DCH, KNM, and JDR-M contributed to the writing of the manuscript. HMS-M, DCH, KNM, JDR-M, GLM, and FNW agree with manuscript results and conclusions; jointly developed the structure and arguments for the paper; and made critical revisions and approved final version. All authors reviewed and approved the final manuscript.
Disclosures and Ethics
As a requirement of publication, author(s) have provided to the publisher signed confirmation of compliance with legal and ethical obligations including but not limited to the following: authorship and contributorship, conflicts of interest, privacy and confidentiality, and (where applicable) protection of human and animal research subjects. The authors have read and confirmed their agreement with the ICMJE authorship and conflict of interest criteria. The authors have also confirmed that this article is unique and not under consideration or published in any other publication, and that they have permission from rights holders to reproduce any copyrighted material. Any disclosures are made in this section. The external blind peer reviewers report no conflicts of interest.