
Abstract
The kidneys are vital organs responsible for filtering and eliminating toxins from the body. Chronic kidney disease (CKD) is becoming increasingly prevalent, affecting not only older adults but also younger populations. To minimize kidney damage for those at risk, an accurate assessment and monitoring of CKD are crucial. Machine learning models can assist physicians in this task by providing fast and accurate detection. As a result, many health care systems have adopted machine learning, especially for disease diagnosis. In this study, we developed a system to support the diagnosis of CKD. The data were collected from the UCL machine learning database, with missing values filled using the “mean/mode” and the “random sampling method.” After data processing, we applied the polynomial technique to generate additional features, allowing the models to be better generalized. Then, we utilized feature-based stratified splitting with K-means and implemented 6 machine learning algorithms (Random Forest, Support Vector Machine [SVM], Naive Bayes, Logistic Regression, K-Nearest Neighbor [KNN], and XGBoost) to compare their performance based on accuracy. Among them, Random Forest, XGBoost, SVM, and logistic regression achieved the highest accuracy of 100%, followed by Naive Bayes (97%) and KNN (93%).
Keywords
Introduction
The kidneys play a crucial role in the removal of excess fluids and waste from the body. In addition, they help eliminate acids and maintain balanced levels of important minerals such as salt and calcium in the blood. The kidneys’ primary function is to remove toxins from the blood and convert them into urine. Each kidney processes about 160 g of waste daily and produces between one and one and a half liters of urine. Together, the kidneys filter approximately 200 L of fluid in 24 hours.1-3 However, when the kidneys do not function properly, waste products accumulate, leading to kidney failure and, in severe cases, death.4-8 The kidneys can be damaged by both acute and chronic diseases. Globally, kidney diseases are a serious health problem that causes significant economic losses in high-income countries, accounting for 2% to 3% of annual revenue. The CKD severely affects kidney function, reducing the body’s ability to maintain health. Left untreated, CKD can cause high blood pressure, osteoporosis, anemia, poor nutrition, and nerve damage. In addition, CKD increases the risk of cardiovascular disease.
The CKD has a global impact on health,9-12 with high rates of morbidity and mortality. Therefore, early detection and diagnosis of CKD are essential to ensure timely care and prevent the disease from progressing. The CKD patients must monitor factors such as potassium, urea, calcium, and phosphorus levels in the blood to adjust their diet accordingly. Machine learning (ML) techniques are increasingly being applied in the medical field due to their ability to predict diseases by analyzing biomedical data. In addition, methods such as synthesis and deep learning have significantly improved the accuracy of ML models. Accurate predictive models can be built by extracting information from electronic health records (EHRs).13,14 With a sufficient amount of data, ML technologies have the potential to become essential tools for predicting various kidney diseases and supporting the provision of medical care to those who need it most. However, laboratory data are still not widely accessible, hindering the development of computer-aided medical technologies. Currently, many studies are being conducted to identify and classify various diseases, including cancer, cardiovascular disorders, liver, and kidney diseases. In particular, ML has been regarded as an important technique since 2004 for the detection of cancer-related issues. 15 This demonstrates how ML is significantly transforming epidemiology in health care, especially as ML applications for disease prediction become increasingly common.
The CKD has become one of the leading causes of death in recent years. According to statistics, CKD-related mortality rates around the world increased by 41.5% between 1990 and 2017. 10 Therefore, diagnosing kidney disease or monitoring its causes is a reasonable strategy for effective risk management. In a study by Qin et al, 16 they used 6 different ML algorithms to assess kidney disease. The results showed that Random Forest achieved the highest performance, with diagnostic accuracy reaching 99.75%. However, due to some model errors, the researchers developed a hybrid model that combined logistic regression and Random Forest using a perceptron, which improved the precision to 99.83%. Chen et al 17 also conducted a series of experiments to find the best algorithm to identify CKD using 3 different modeling methods. In the first experiment, K-Nearest Neighbor (KNN) and Support Vector Machine (SVM) achieved nearly 100% accuracy, while Soft Independent Modeling of Class Analogy (SIMCA) underperformed. They then conducted a second experiment with additional random noise and found that the SVM maintained its accuracy at 99%. Charleonnan et al 18 developed a CKD detection model using the SVM algorithm in 2016. They tested the highest classification accuracy of ML models, including SVM, KNN, logistic regression, and Decision Tree, with accuracy rates of 98.3%, 98.1%, 96.6%, and 94.8%, respectively. Furthermore, Shamrat et al 19 proposed a computer-aided disease prediction tool to diagnose CKD. Their experiments were carried out on 2 different data sets using 3 ML techniques: deep learning, feedforward neural networks, and logistic regression. The results showed that the feedforward neural networks performed excellently on both balanced and unbalanced data sets. Although significant achievements have been made in this research field, several major gaps remain:
- Lack of analysis on real-world data and clinical environments: Although ML models have been implemented and evaluated on UCI data, this article does not address applying these models in real clinical settings. Data from ML databases are often processed and noise-filtered, while real-world hospital data can be complex and incomplete, creating a gap in evaluating model performance in real-world scenarios.
- Lack of evaluation of factors affecting computational time in large-scale environments: A factor not thoroughly analyzed in this article is the variation in computational time when working with larger data sets. Although the current study is conducted on a small CKD data set (400 samples), expanding to larger systems with thousands of samples will significantly change computational time and optimization capabilities. This is especially important when integrating the model into large-scale health care systems that require continuous real-time data processing.
- Lack of details on model interpretability for physicians: One key issue in the implementation of ML models in health care is the ability to interpret prediction results so that doctors can trust and use them. Although this article focuses on model accuracy and performance, it does not provide clear assessments of how interpretable these models are for nontechnical users, particularly physicians.
- Lack of testing on various data sets beyond CKD data: The current study focuses only on diagnosing CKD, while many other diseases can also be predicted and diagnosed using ML. This article does not consider how generalizable these models are to different types of disease.
- Lack of analysis on how preprocessing techniques impact different models: This article applied preprocessing methods such as the “mean/mode” and “random sampling method” to handle missing values but did not analyze how these preprocessing techniques could affect the performance of each ML model. Different models may be sensitive to different preprocessing methods.
The goal of this study is to develop and evaluate systems for diagnosing CKD based on ML models while comparing their performance with well-prepared data. The study aims to identify the optimal model with the highest accuracy while clarifying how ML systems can operate effectively in real-world clinical environments. In addition, the study seeks to evaluate the feasibility of the model in large data sets, ensure ease of interpretation for physicians and health care professionals, and explore the potential for applying these models to diagnose various diseases, ultimately optimizing diagnostic processes and improving medical decision-making. This goal not only focuses on enhancing the accuracy of ML models but also addresses real-world challenges in system scalability and increasing the applicability across diverse data sets and medical conditions.
Materials and Methods
This section focuses on ensuring accuracy and clarity throughout the research process. Data on the CKD were obtained from the UCI Machine Learning Repository. After collection, the data were carefully processed to remove any incorrect information, ensuring integrity and accuracy. The key characteristics were carefully selected, and a thorough data cleaning process was carried out. The data were then divided into 2 separate sets: a training data set and a testing data set, at a ratio of 80% to 20%. The training set was used to train ML algorithms, including Random Forest, SVM, Logistic Regression, XGBoost, and KNN. After training, these models were applied to make predictions and evaluated in the test set. Figure 1 illustrates the overall process from data processing and data splitting to evaluating model performance in predicting CKD. The steps involved in developing and evaluating the CKD prediction models in this study are as follows:
Step 1: Data collection from UCI of the kidney disease data set
- CKD data were sourced from the UCI repository (University of California, Irvine), a standard and widely used data set in ML research.
20
The data set includes information related to patient health indicators, such as potassium levels, urea, blood pressure, and other features related to kidney function.
Step 2: Data preprocessing
- Data often includes categorical features such as gender and disease status. During this step, categorical values are encoded into numerical values to suit ML models. - Data are converted into the correct formats (eg, numeric or categorical) to be processed effectively by ML algorithms. This step ensures that inconsistencies in the data format do not affect prediction results.
Step 3: Application of polynomial features
- After data processing, polynomial features (PFs) were applied. This technique creates new features from the original ones by combining quadratic (or higher) operations between features. This expands the feature space, allowing the model to learn more complex relationships, thereby improving model accuracy when dealing with nonlinear data.
Step 4: Feature clustering
- Once the feature space is expanded, feature clustering is performed. Clustering groups with similar features allows the model to learn the relationships between feature groups more accurately. This clustering method helps to improve data splitting and optimize the model training process.
Step 5: Stratified splitting
- Data were split into a training set (80%) and a testing set (20%) using stratified splitting. This stratified method ensures that classes (eg, patients with and without CKD) are evenly distributed in both sets, preventing imbalances between the training and testing sets. This is crucial to ensure that ML models generalize well to test data.
Step 6: Model training
- After data separation, ML models such as Random Forest, SVM, Logistic Regression, XGBoost, and KNN were trained on the training set. These models were chosen because they have demonstrated high effectiveness in classification tasks.
Step 7: Performance evaluation
- After training, the models were applied to the test set to evaluate their performance. Performance metrics include:
Accuracy: The proportion of correct predictions of the total predictions.
Precision: The accuracy of the prediction when it indicates that a patient has CKD.
Recall: The ability to identify all CKD cases.
F1-Score: A balance between precision and recall.
ROC (Receiver Operating Characteristic): The ROC curve and the area under the curve (AUC) are used to measure the model’s ability to distinguish between different classes in the data.
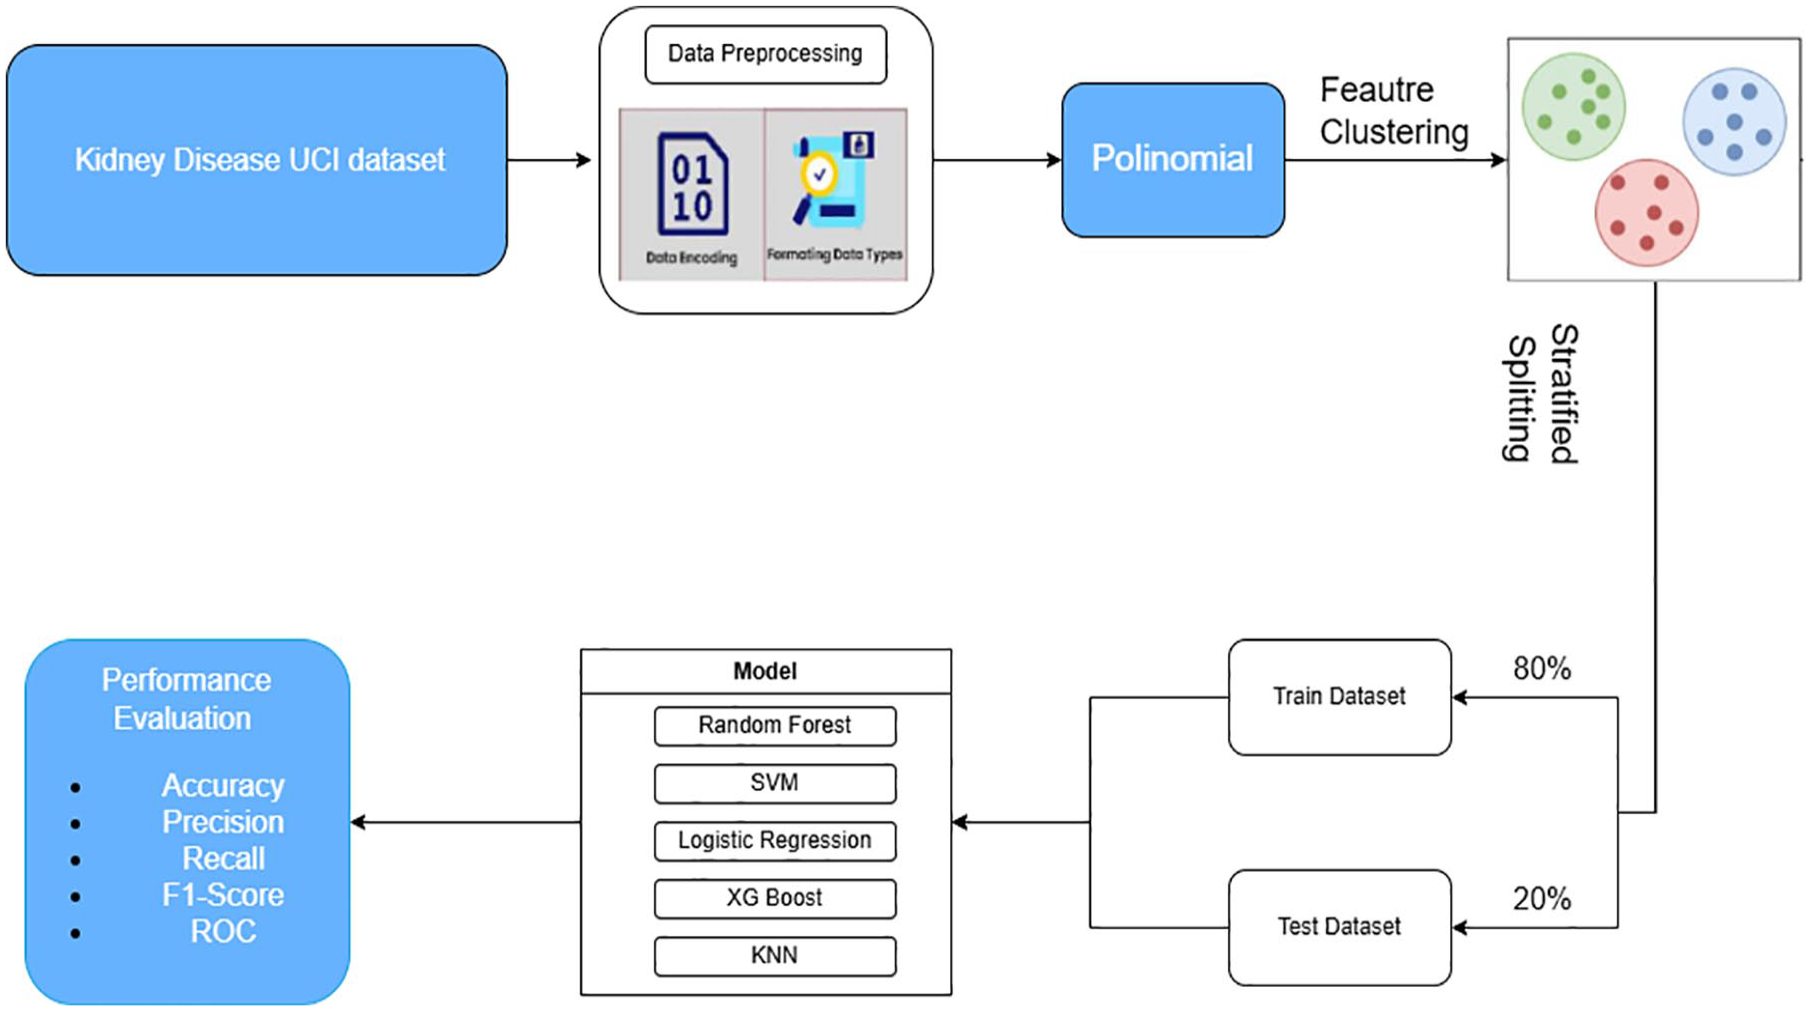
CKD prediction model evaluation process.
Data collection and preparation
This study uses the data set from the UCI Machine Learning Repository, which consists of 400 samples. Of these, 250 belong to the CKD patient group and 150 belong to the control group. The data set contains 25 features, divided into 2 types: 11 numeric features (float64) and 14 categorical features (object). For analysis purposes, the data set was split into 2 parts: 80% for model training and 20% for performance testing. This split ensures that the model is evaluated in an independent test set, providing an accurate reflection of the performance when applied to real-world scenarios. Figure 2 illustrates the clustering and data-splitting process from the initial sample set, helping the model to learn and make more accurate predictions.
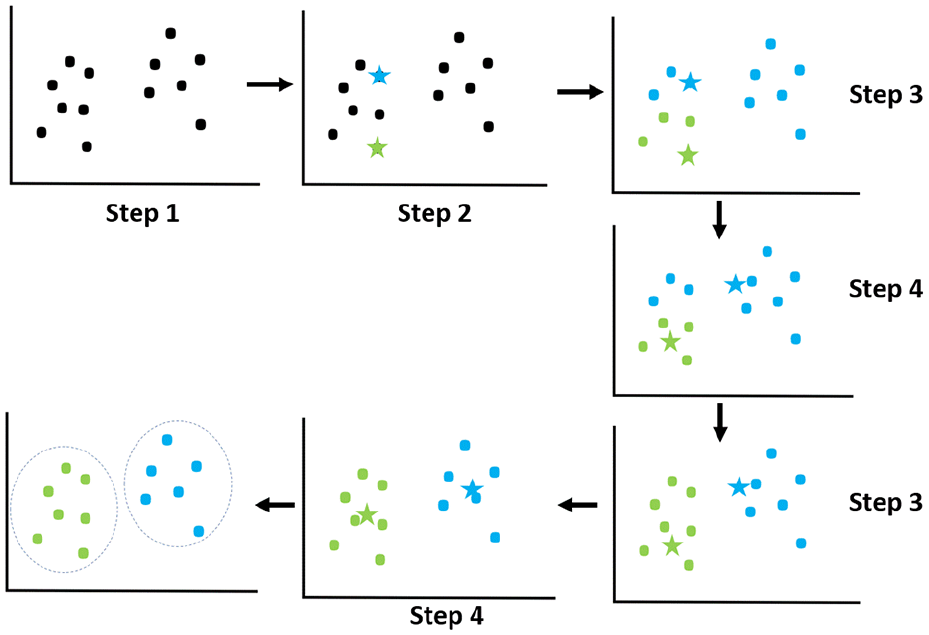
K-means clustering algorithm.
Data preprocessing
Raw data often contains a lot of noise and cannot be used directly for analysis, so several preprocessing steps are necessary to clean and optimize the data. This preprocessing process includes handling the following issues:
➢ Formatting data types:
- The data set contains both numeric and categorical features. Numeric data can be easily processed by ML models, but categorical data must be converted. - For example, columns such as gender or disease status are often represented as strings such as “male,” “female,” “diseased,” or “healthy.” The ML algorithms cannot process these strings directly, so converting and encoding them into numerical values (eg, “0” or “1”) is a key step for efficient data processing and learning.
➢ Feature encoding:
- Label encoding is a technique that is used to convert categorical values into integers.
21
In this case, the column “classification” (indicating whether a person has CKD or not) is converted into the numerical value “0” for CKD patients and “1” for non-CKD patients. This prepares the data for use with ML algorithms, which can only handle numerical data. - This encoding method is also applied to other categorical columns in the data set, such as social status, disease severity, or environmental factors. - Several processes and methods were applied to handle missing values in the data set. This step ensures that the data are ready for ML algorithms and improves model training by transforming the data into a processable format.
➢ Handling missing values: The raw data set contains missing values (null), a common issue in real-world data. Missing values can introduce bias in model training if not handled correctly. - Random sampling method: when a column contains many missing values (a high missing rate), a random sampling method from existing values is used to replace the missing ones. This reduces bias and preserves important information in the data set. - Mean/mode imputation: If a column has a low rate of missing values, this method replaces missing values with the mean (for numerical data) or the mode (for categorical data). This fills the data without skewing the feature distribution.
➢ Separation of numerical and categorical data: After processing the data, columns containing numeric data (eg, health indicators such as urea, creatinine, and blood pressure) and columns containing categorical data (eg, gender and disease status) are separated into 2 distinct data frames. This optimizes data processing for each type of ML algorithm, as models can perform better when processing different data types separately.
➢ Removing unnecessary columns: Columns with a high percentage of missing values or no clear relationship to the prediction target (CKD diagnosis) are removed from the data set to avoid decreasing the model performance.
➢ Enhancing data usability and clarity: After the data, the column names are revised to ensure that they are understandable and usable for analysis and model training. This helps researchers to more easily track and manage information during their work.
➢ Preparing data for ML models: After completing the preprocessing, the data set, including both numerical and categorical features, is transformed to suit ML algorithms. This ensures that the model can effectively learn from the data and produce accurate predictions.
Polynomial features technique
The PF is a technique used to add nonlinear features to a model, allowing it to learn more complex relationships in the data.22-24 This technique expands the feature space by creating new features based on the products and powers of the original features.
When given a set of features

The general formula for generating features of degree

This expanded feature set includes all the products of features raised to powers up to degree
➢ Input data:
- The feature matrix ○ ○
➢ Choosing the degree of polynomial d:
- The degree of the polynomial - Reasons for choosing the polynomial degree: ○ Low degree ○ Higher degree
➢ Generating new features:
- When generating PFs, the algorithm creates new variables by raising each feature to a power and creating products between features. - For example, with 2 initial features ○ ○ This means that the model is modeling the second-degree relationship between features, helping it to understand more complex interactions between variables.
➢ Output the expanded feature matrix: - After creating the new features, the number of features can increase rapidly. If a study initially has three characteristics and chooses - The formula for calculating the number of new features is as follows:
- This means that for each new feature, the study’s data space expands significantly, allowing the model to learn more complex nonlinear relationships. However, this can also lead to dimensionality issues, where the number of features becomes too large compared to the number of samples, making training and data processing more challenging.

The PF technique expands the feature space by creating new features from the original ones through products and powers. This helps ML models learn more complex nonlinear relationships between the features, as described in Table 1.
Model performance on original and polynomial feature–expanded data sets.
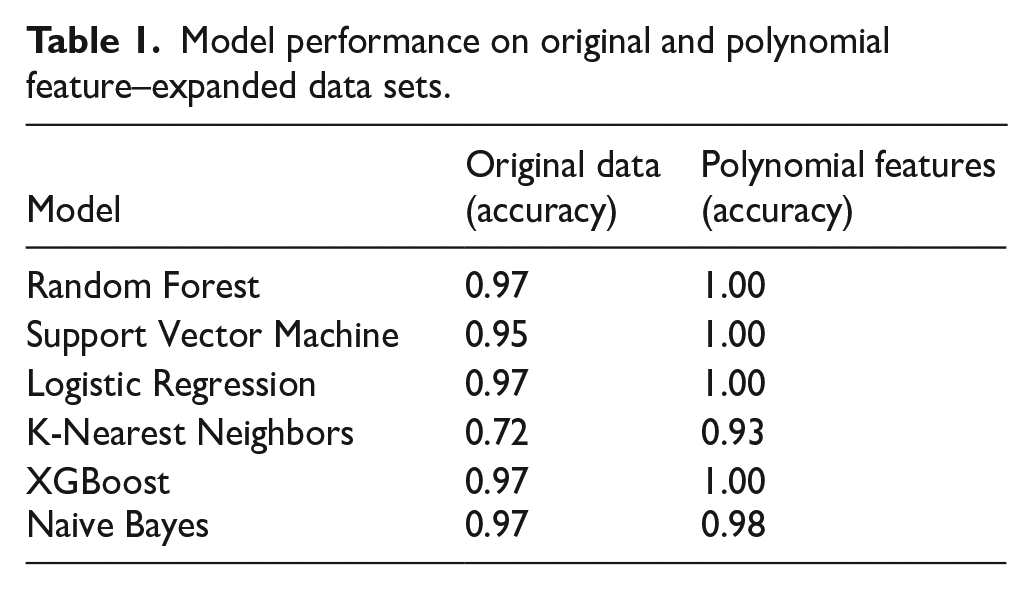
As shown in Table 1, after applying polynomial characteristics, the performance of ML models improved significantly, especially for models such as Random Forest, SVM, logistic regression, and XGBoost. These models achieved a maximum accuracy of 1.00 when the PF technique was applied.
The use of polynomial characteristics (PF) in this study is motivated by the need to capture complex, nonlinear relationships between clinical variables that traditional linear models might overlook. In the context of the prediction of CKD, several biochemical and physiological indicators (eg, serum creatinine, blood pressure, hemoglobin, and albumin) interact in a nonlinear fashion as the disease progresses. The PF enables the model to include second-order (and potentially higher-order) interaction terms such as creatinine × blood_pressure, hemoglobin2, or blood_urea × age, which may reveal hidden patterns useful for improving classification accuracy. However, we recognize that polynomial expansion significantly increases the dimensionality of the feature space, which could lead to overfitting, especially with small data sets like the UCI CKD. Moreover, adding too many high-order terms can introduce computational complexity, reduce interpretability, and degrade model performance if irrelevant interactions are included. To mitigate these risks, we limited the degree of expansion to second-order polynomials and applied cross-validation and regularization techniques (such as early stopping and tree pruning for ensemble methods) during training. Empirical results show that this moderate expansion improves model generalization without overfitting, as validated by stable performance across multiple classifiers. The trade-off between expressiveness and complexity was carefully controlled, ensuring both accuracy and efficiency.
Data splitting
Typically, the stratified train-test split technique is used to divide the data based on a fixed ratio between classes, ensuring that each class in the data set is well represented in both the training and test sets. However, this method focuses only on dividing the data based on labels, without ensuring an even distribution of features between the 2 data sets. Therefore, this study proposes a stratified splitting method to ensure that both the training and the test sets have an even distribution of characteristics. This method helps to improve the representation of features in both sets, thus preventing model bias and enabling better generalization when applied to real-world data. In this study, the data set was divided into 80% for training and 20% for testing, ensuring that the training set contains enough data for the model to learn, while the test set is large enough to reliably evaluate model performance.
K-means clustering
K-means clustering is an unsupervised clustering algorithm commonly used to partition data into clusters based on the similarity between data points in the feature space.25-27 The goal of K-means is to minimize the total squared distance between data points and the cluster centroids, creating groups (clusters) where the points within each cluster are more similar to each other based on distance in the feature space. The process of the K-means algorithm is carried out as follows:
Step 1: Initialize centroids
• Randomly select
Step 2: Assign clusters
• Each data point

where
Step 3: Update centroids
• Once all data points are assigned to clusters, recalculate the centroid positions by averaging all the data points within each cluster. The new centroid for cluster

where
Step 4: Repeat
• Repeat steps 2 and 3 until the centroids’ positions no longer change (or change very little), or when a predefined stopping criterion is reached (eg, after a specific number of iterations).
K-means is a powerful algorithm for discovering natural groupings in data without prior labels. However, the clustering results can vary based on the initialization of centroids, so running the algorithm multiple times with different initializations can produce better results. An explanation and application of the results of the K-means model are as follows:
➢ Explanation of the illustration: In Figure 2, the stars in the image represent the centroids, which are the central points of the data groups. These are the points that the K-means algorithm uses to determine how data points are grouped. The dots represent the data points that are grouped into different clusters based on their proximity to the centroids. Each data point belongs to the cluster with the closest centroid.
➢ Results of the K-means algorithm: The result of the algorithm is a set of clusters, each containing data points with similar characteristics based on distance. This clustering process helps uncover hidden structures in the data, facilitating the processing and analysis of complex data sets.
➢ Application of K-means: K-means is often used in problems such as customer segmentation, market analysis, anomaly detection, and unsupervised data classification. It is highly effective in handling and grouping data points with similar characteristics, supporting ML models, and statistical analysis by providing deeper insights into the data.
Stratified train-test split
Stratified train-test split is a data split technique28,29 that ensures that each class (or group) in the data set is proportionally represented in both the training (train) and the test sets. This means that if a specific class constitutes 30% of the total data, it will also account for around 30% of both the train and test sets. However, when the stratified train-test split is based solely on target labels, this method may not guarantee an even distribution of features between the train and test sets. In other words, while the class ratio in both data sets may be the same, the distribution of different features in the data may not be uniform. This can lead to a feature imbalance between the 2 sets, reducing the model’s ability to generalize and impacting the analysis results. To address this issue, data-splitting techniques based on target labels and features can be considered, ensuring better uniformity and representation between the train and test sets.
Kolmogorov-Smirnov test
In this study, the Kolmogorov-Smirnov (KS) test is used as a method to assess the uniformity of feature distributions between the train and the test sets. 30 The KS test is a nonparametric test that compares the difference between 2 distributions of data features to determine their level of uniformity. Measure the largest difference between the cumulative distribution functions (CDFs) of 2 features. If the KS test indicates a significant difference, it suggests that the data lack uniform feature distribution, which needs to be addressed before model training to improve performance and accuracy.
KS distance: This is defined as the maximum distance between 2 CDFs of any 2 features, calculated using the formula:

where
In this study, we used the KS test to evaluate the uniformity of the feature distributions between the train and the test sets. Each feature is tested using the KS test to compare the differences in its distribution between the 2 data sets. Features with a P-value smaller than a predefined threshold (eg, .05) are considered to have significant distribution differences and should be addressed to ensure uniform distribution. To assess the effectiveness of the proposed method, we compare the results of the KS test before and after applying stratified splitting combined with K-means clustering. This allows us to evaluate the improvement in feature distribution uniformity and the significant enhancement of the method in balancing the data.
Selection and evaluation
After splitting the data set into training and test sets, the process of selecting and training ML models was carried out. The models used include Random Forest, SVM, Naive Bayes, Logistic Regression, KNN, and XGBoost. The effectiveness of each model was evaluated based on metrics such as accuracy, precision, recall, and F1 score, providing an overview of model performance in classification tasks. In addition, for more detailed analysis, confusion matrix plots and ROC curves were generated. The confusion matrix helps identify specific classification errors made by each model, while the ROC curve assesses the ability to distinguish between classes at various thresholds. These tools provide deep insights into the performance of the models, helping to determine which model performs best for the classification of CKDs:
➢ ML classification algorithms
- KNN: KNN is a supervised algorithm considered a simple method. It can be applied to both classification and regression problems, but its most common use is in classification. 31 As a nonparametric learning method, KNN does not require a separate training phase and uses the entire data set for learning. The value of KKK plays a crucial role in determining the number of neighbors used to predict a new outcome.
- Logistic regression: Logistic regression is a common statistical technique specifically used to model binary outcomes. 32 It is a special case of neural networks and shares many similarities with deep learning techniques. This method predicts the probability that the dependent variable has a categorical value.
- Naive Bayes: The Naive Bayes algorithm applies Bayes’ theorem to train a classifier. Calculate a probability distribution for each class based on observed data. 33
- SVM: SVM is one of the most widely used supervised learning methods, effectively solving both classification and regression problems. 34 The objective of SVM is to find the optimal boundary that separates the data in a multidimensional space.
- Random Forest: Random Forest is a popular supervised algorithm based on constructing multiple decision trees on different subsets of the data set to make predictions. 35 This method applies ensemble learning, combining multiple classifiers to improve model accuracy.
- XGBoost: XGBoost is an algorithm that builds decision trees sequentially, adjusting the weights of the independent variables. 36
Feature-Based Stratified Splitting Combined With K-means Clustering
Theoretical background
Issues in recent research
Current research focuses primarily on improving model accuracy by improving model parameters or increasing the size of the data set. However, a critical issue that is often overlooked is the imbalance and uneven distribution of features between the train and the test sets. Most studies concentrate on class balancing but pay little attention to feature balancing between the 2 sets.
Feature imbalance can lead to biased ML models, reducing their ability to generalize and their accuracy when applied to real-world data. The KS test used in our study revealed significant differences in feature distribution between the train and test sets when the data were not split using a stratified feature-based strategy.
The problem with current research lies in the lack of effective methods to balance the feature distribution between the train and the test sets. Traditional data-splitting techniques, such as random splitting or label-based stratified splitting, do not ensure a uniform feature distribution. This highlights the urgent need for a new method to address this problem.
Proposed method
To address feature imbalance and ensure an even feature distribution between the train and test sets, we propose a new method that combines K-means clustering with a feature-based stratified data-splitting strategy. This method not only considers labels but also takes into account hidden data structures through K-means clustering. This combination ensures that both data sets reflect all important features, improving the accuracy of ML models. The detailed steps of the stratified feature-based splitting are as follows:
Step 1: Apply K-means clustering
• Objective: Explore and identify hidden structures in the data based on their features. Then, cluster the data into groups with similar features to better understand the feature distribution in the original data set. • Implementation: ○ Apply the KMeans algorithm to the entire data set. Select the optimal number of clusters (k) using methods such as the elbow method or the silhouette score to find the most appropriate data structure. ○ The result of this step is that each data point in the dataset will be assigned to a cluster, reflecting the similarity of features between samples within the same cluster. This helps to define feature regions in the data set space, forming the basis for data splitting in the next step.
Step 2: Calculate cluster ratios
• Objective: Determine the proportion of samples in each cluster relative to the total number of samples. This helps maintain balance when splitting the data into train and test sets. • Implementation: ○ Count the number of samples in each cluster to understand the data distribution. ○ Calculate the percentage of each cluster relative to the total number of samples. This information will be used to ensure that each cluster is proportionally represented in both the train and test sets, avoiding overrepresentation of any cluster.
Step 3: Feature-based stratified splitting by cluster
• Objective: Split the data into train and test sets so that each cluster is represented according to the calculated ratios, ensuring a balanced and even feature distribution. • Implementation:
○ Apply feature-based stratified splitting within each cluster, splitting the data in the desired ratio (eg, in this study: 80% for the train set, 20% for the test set). ○ Ensure that the proportion of samples from each cluster in the train and test sets accurately reflects the previously calculated ratios. This helps maintain diversity and even feature distribution in both sets, allowing the model to learn from more features and avoid bias.
Step 4: Ensure target label balance within each cluster
• Objective: Ensure that the target labels are also balanced within each cluster. This prevents class imbalance between the train and test sets, minimizing bias toward specific classes. • Implementation: ○ Apply label-based stratified splitting within each cluster. This ensures that the distribution within each cluster reflects the diversity of the original data set. ○ This method enables the model to learn both the diversity of features and the diversity of labels, increasing the accuracy in real-world applications.
Step 5: Combine data from clusters
• Objective: Create the final train and test sets, ensuring that they are balanced in terms of both labels and even feature distribution, ready for model training. • Implementation: ○ Combine the stratified data from all clusters to create the training and test sets. ○ Ensure that there is no duplication and maintain the train-test split ratio. This preserves data integrity and balance during model training, ensuring that the model learns from a data set that best represents the entire feature space.
The integration of K-means clustering with stratified train-test splitting was motivated by the need to maintain not only class balance but also feature distribution uniformity across the training and test sets. While conventional stratification techniques only preserve the proportion of class labels, they often overlook underlying structures or correlations among features that can significantly influence model generalization. K-means clustering allows us to uncover latent groupings within the feature space, clusters that represent subpopulations of patients with similar clinical characteristics, thus allowing a more representative sampling during the data-splitting process. To avoid arbitrarily selecting groups, we used both the Elbow Method and the silhouette score to determine a suitable range of groups (k = 2 to 7). The elbow method helps identify the point at which adding more clusters does not significantly reduce the within-cluster variance, while the silhouette score evaluates the consistency within clusters compared to separation between clusters. We selected multiple k-values within this range and evaluated each configuration using the KS test to quantify improvements in the uniformity of the feature distribution. The results (see Table 2) show that the K-Stratified Split achieved significantly higher P-values and lower KS statistics compared to unclustered splitting, confirming better alignment between the train and test sets. This approach not only ensures robust statistical balance but also improves the model’s ability to generalize to new data, especially in small medical data sets where heterogeneity in feature distribution can otherwise lead to overfitting or bias.
Measurement of feature distribution uniformity using the KS test.

Benefits of the proposed method
The proposed method offers several significant advantages, particularly in balancing and evenly distributing features between the train and the test sets. Ensuring that each feature group is adequately represented in both sets reduces the likelihood of imbalance and bias during model training. When features are evenly distributed, the model can learn better from the training set and generalize more effectively to the test set, improving prediction performance. This method is especially useful in cases where the data features exhibit substantial differences, helping to avoid model bias or underperformance when encountering less frequent features in the training set.
Research methodology
Stratified train-test split strategy
The results of the KS test indicate that the balance and evenly distributed features between the train and test sets are essential for building high-performance ML models with strong generalization capabilities. To address this issue, we propose a method that combines K-means clustering with a stratified data-splitting technique based on K-means-created feature clusters, as shown in Figure 3.

Feature-based stratified splitting method.
The method operates as follows: first, we apply the K-means clustering algorithm to cluster the entire data set based on its features. This process creates clusters in which the samples exhibit high similarity of characteristics. Then, we perform feature-based stratified data splitting, ensuring that both the train and test sets include representative features from all clusters in the data set. This helps balance and evenly distribute features between the 2 sets, minimizing bias and improving generalization. Combining K-means clustering with feature-based stratified splitting not only increases model accuracy but also improves reliability and stability when applied to test sets and in real-world scenarios. This represents a significant advancement, introducing a new approach to handling feature imbalance. This method ensures that the ML model is trained on a diverse data set that fully represents all features.
From Table 2, we can see that the clustering time with K-means ranges from 0.011 to 0.026 seconds, depending on the value of N_cluster. This indicates that the total time taken to fully complete all cases is 0.112 seconds. Although this is a small amount of time, it provides significantly better accuracy compared to the standard data-splitting method. As for the KS test time, it ranges from 0.039 to 0.078 seconds. This time ensures that the training and test data are evenly distributed, helping to improve the generalizability of the model. The total time for data splitting is 0.505 seconds compared to 0.034 seconds for the normal data-splitting method. The overall training process took 11.65 seconds (approximately 4% of the total process), indicating that the time spent on feature-based stratified data splitting is a very small portion of the overall process but yields positive results.
Analysis of the charts after performing the Kolmogorov-Smirnov test with selected parameters
The KS test chart shows that the data not stratified by clustering K-means (unclustered split) has a much lower KS statistic compared to the preprocessed data as shown in Figure 4. This implies that the feature distribution in the original data is uneven. On the contrary, after applying feature-based stratification using K-means clustering, the KS statistic significantly increases, indicating an improved balance in the feature distribution. The P_value chart shows the reliability of the KS Statistic, with lower values indicating significant differences in the feature distribution. Meanwhile, preprocessed feature-based stratified methods show a significant increase in P_value, approaching 1, indicating more similarity between the features in the data.

KS test chart between train and test sets with K-means stratified strategy.
The KS test charts in Figure 5 show a notable result when checking the uniformity of the feature distribution between the train and the test sets in the data set. These charts display the P_value for each feature, with the vertical axis representing the P_value and the horizontal axis representing the features. The red line on the graph represents the P-value threshold of 0.05, which is commonly used to determine statistical significance. In the graph, all features have P_values exceeding the 0.05 threshold, with a rate of 100% (34/34 features) compared to 61.76% (21/34 features) when feature-based stratification is not applied. This implies that after applying feature-based stratified methods, the features in the data set achieved significant balance across the feature distribution. This is in stark contrast to when the proposed method was not used (Unclustered Split), where the imbalance in feature distribution is evident, as reflected by the very low KS Statistics for most features. On the contrary, with the feature-based stratified clustering strategy, the KS statistics are much higher, indicating greater uniformity in feature distribution between the train and test sets.

KS test chart between train and test sets without K-means stratified strategy.
Results and Discussions
In this study, we used the data set from the well-known UCI ML repository, consisting of 400 samples with 25 different features. Of these, 250 samples were labeled CKD, and the remaining 150 samples were labeled non-CKD. After preprocessing the data, additional features were generated, bringing the total number of features to 34. The data set was then split into 2 parts using an 80:20 ratio based on the feature-based stratified method, ensuring an even distribution of features between the training and test sets. We selected several ML models, including SVM, Naive Bayes, Random Forest, Logistic Regression, KNN, and XGBoost, to test and evaluate their performance on this data set.
Evaluation and comparison
The purpose of this study was to evaluate the performance of several ML models in classifying CKD. To achieve this goal, we used 4 key evaluation metrics: Precision, Recall, F1 Score, and Accuracy, to measure and compare the performance of the models mentioned above. In this section, we will discuss these metrics and evaluate the results obtained. Specifically, the methods applied include using the original data set, applying the polynomial technique to create additional features, and finally, using the polynomial technique combined with the feature-based stratified splitting method. The results of these methods are summarized in Table 3, providing a comparative assessment of model performance and demonstrating the effectiveness of the applied data enhancement techniques.
Comparison of methods in the current study.
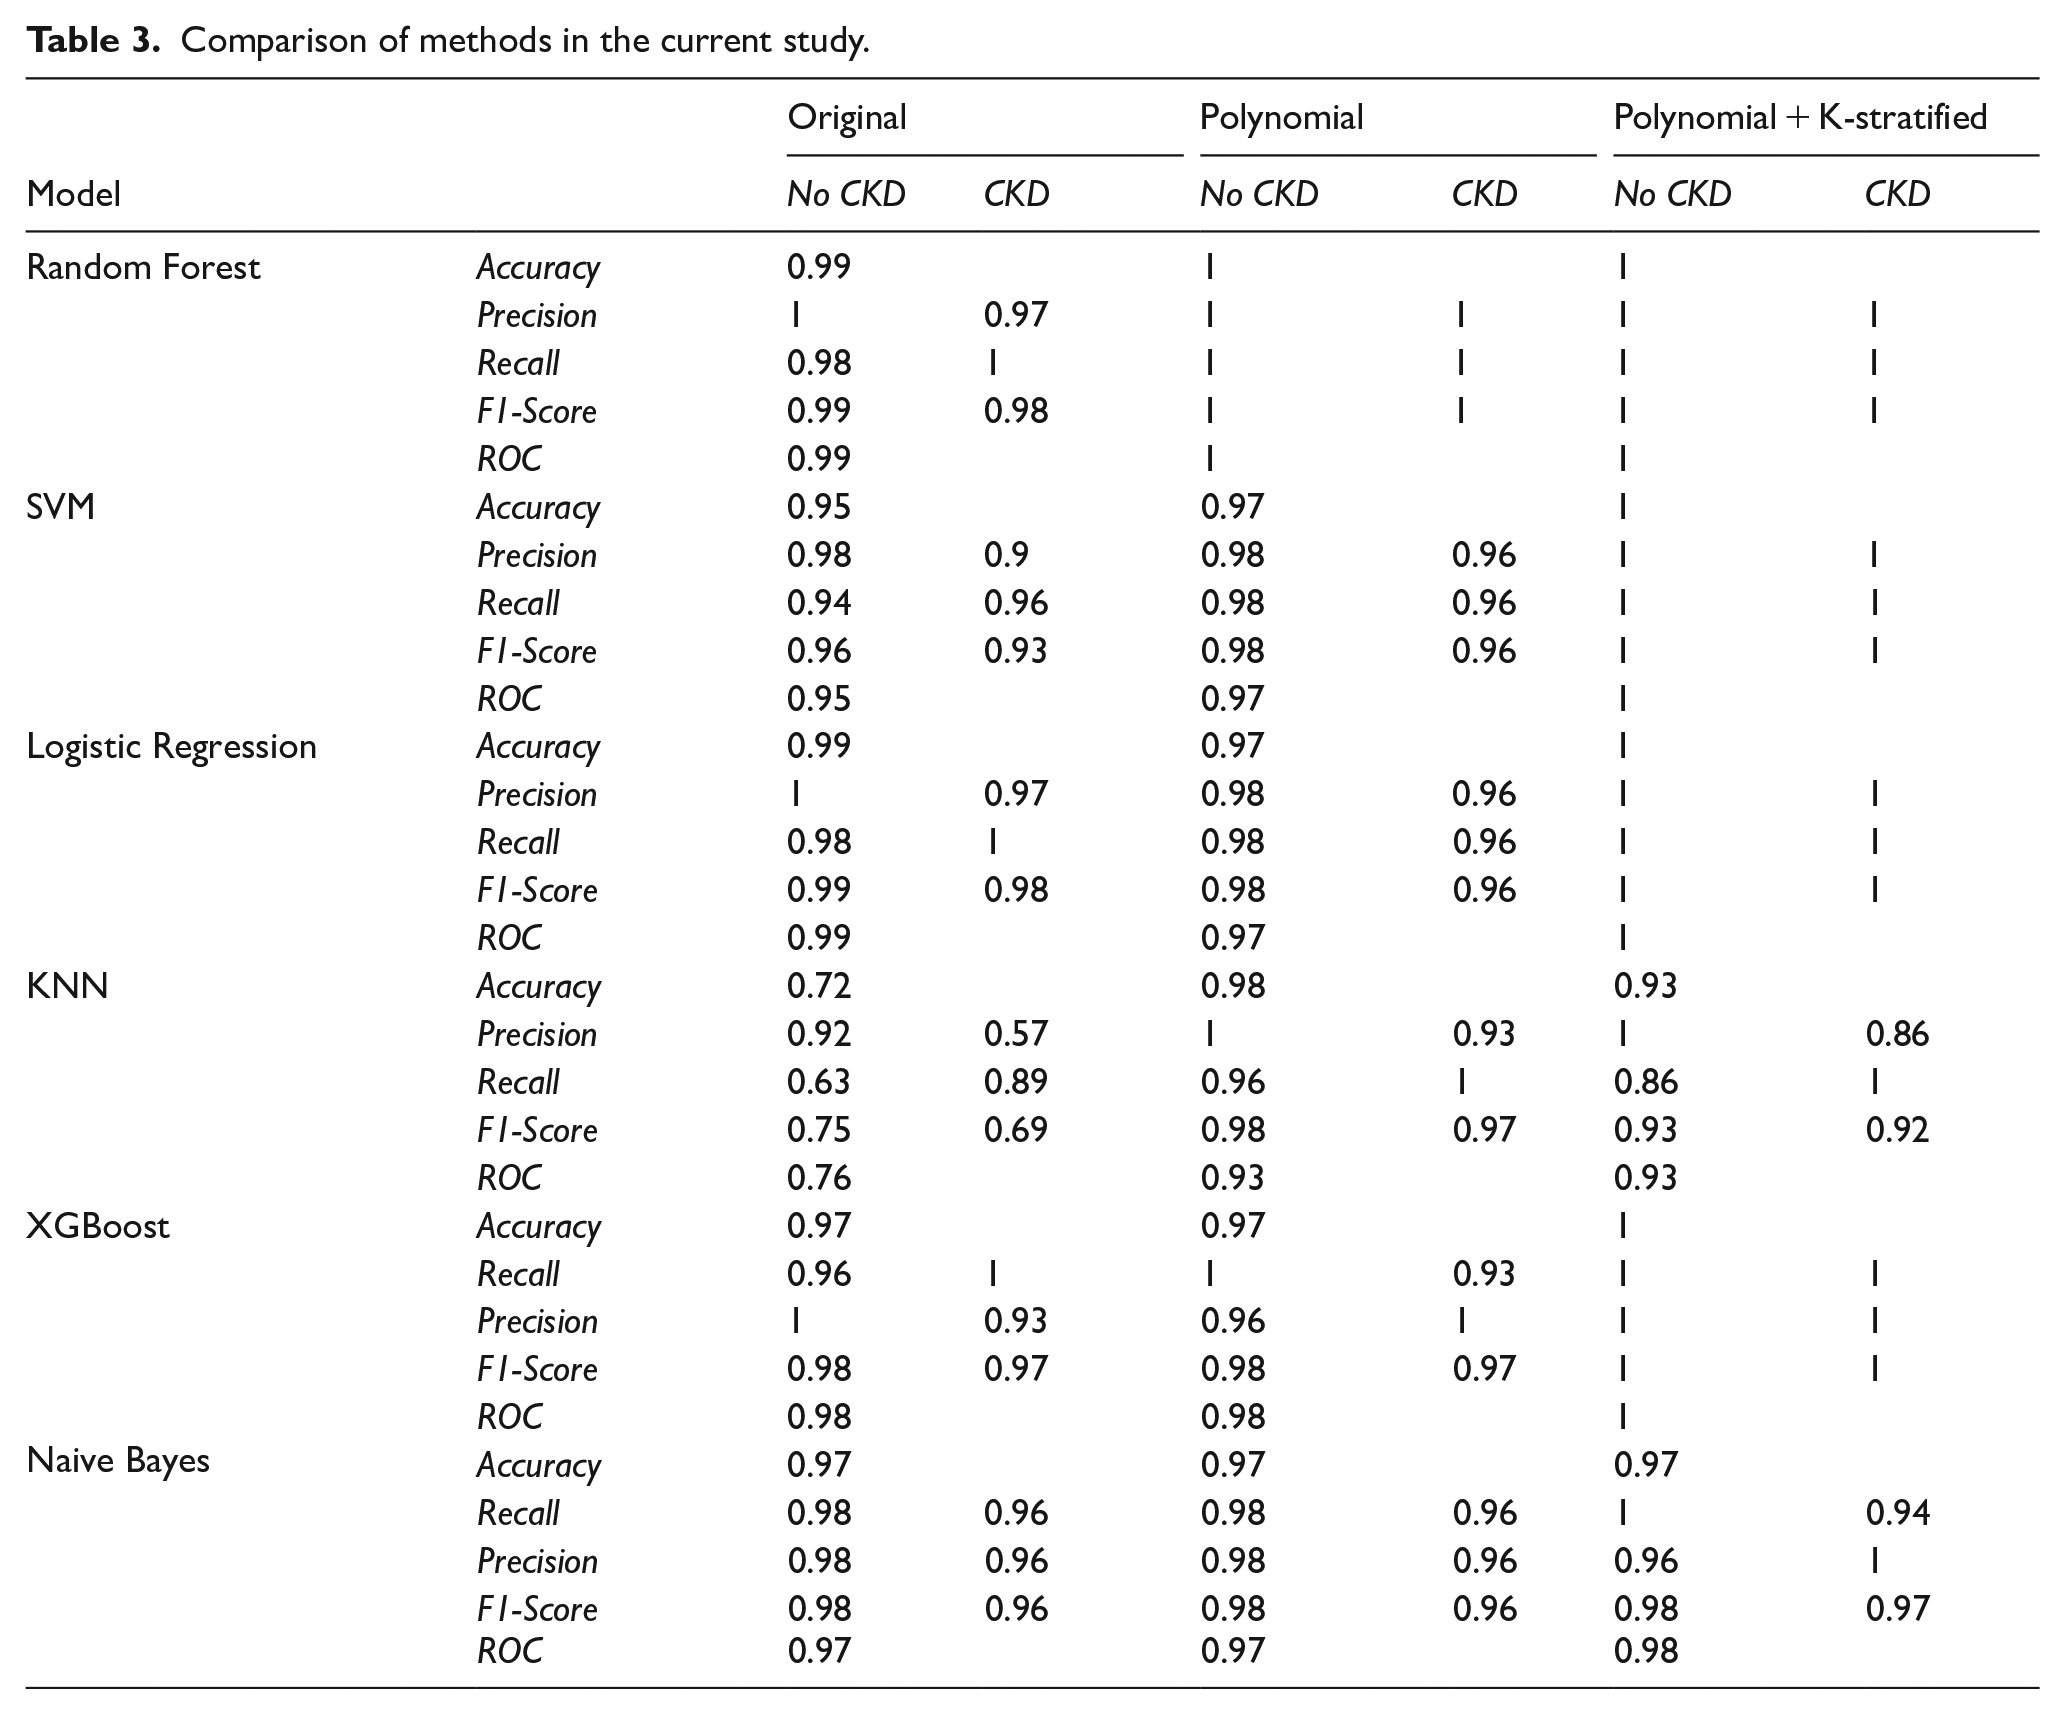
From Table 3, we can also observe that efficiency improves progressively with each method implemented in this study. All models showed significant improvement after applying the polynomial + K-stratified method. The SVM, Random Forest, Logistic Regression, and XGBoost models achieved perfect accuracy, and all the accuracy, precision, recall, and F1-score metrics all reached their maximum values. The KNN and Naive Bayes performed lower than the other models, particularly KNN, when dealing with data transformations. The polynomial + K-stratified method optimized the models better compared to using raw data or the PF enhancement technique alone.
To further detail the results, we can determine the values of True Positive (TP), True Negative (TN), False Positive (FP), and False Negative (FN) by examining the confusion matrices of each model, where positive values indicate CKD and negative values indicate non-CKD:
TP—the number of CKD samples predicted correctly.
FP—the number of samples incorrectly predicted as CKD.
TN—the number of non-CKD samples predicted correctly.
FN—the number of CKD samples incorrectly predicted as non-CKD.
The CKD classification models proposed in our experiment are evaluated by analyzing prediction rates. Table 2 provides detailed information on the overall performance of all the models used in this study, as well as the performance of the confusion matrix and the ROC curves shown in Figures 6 and 7.
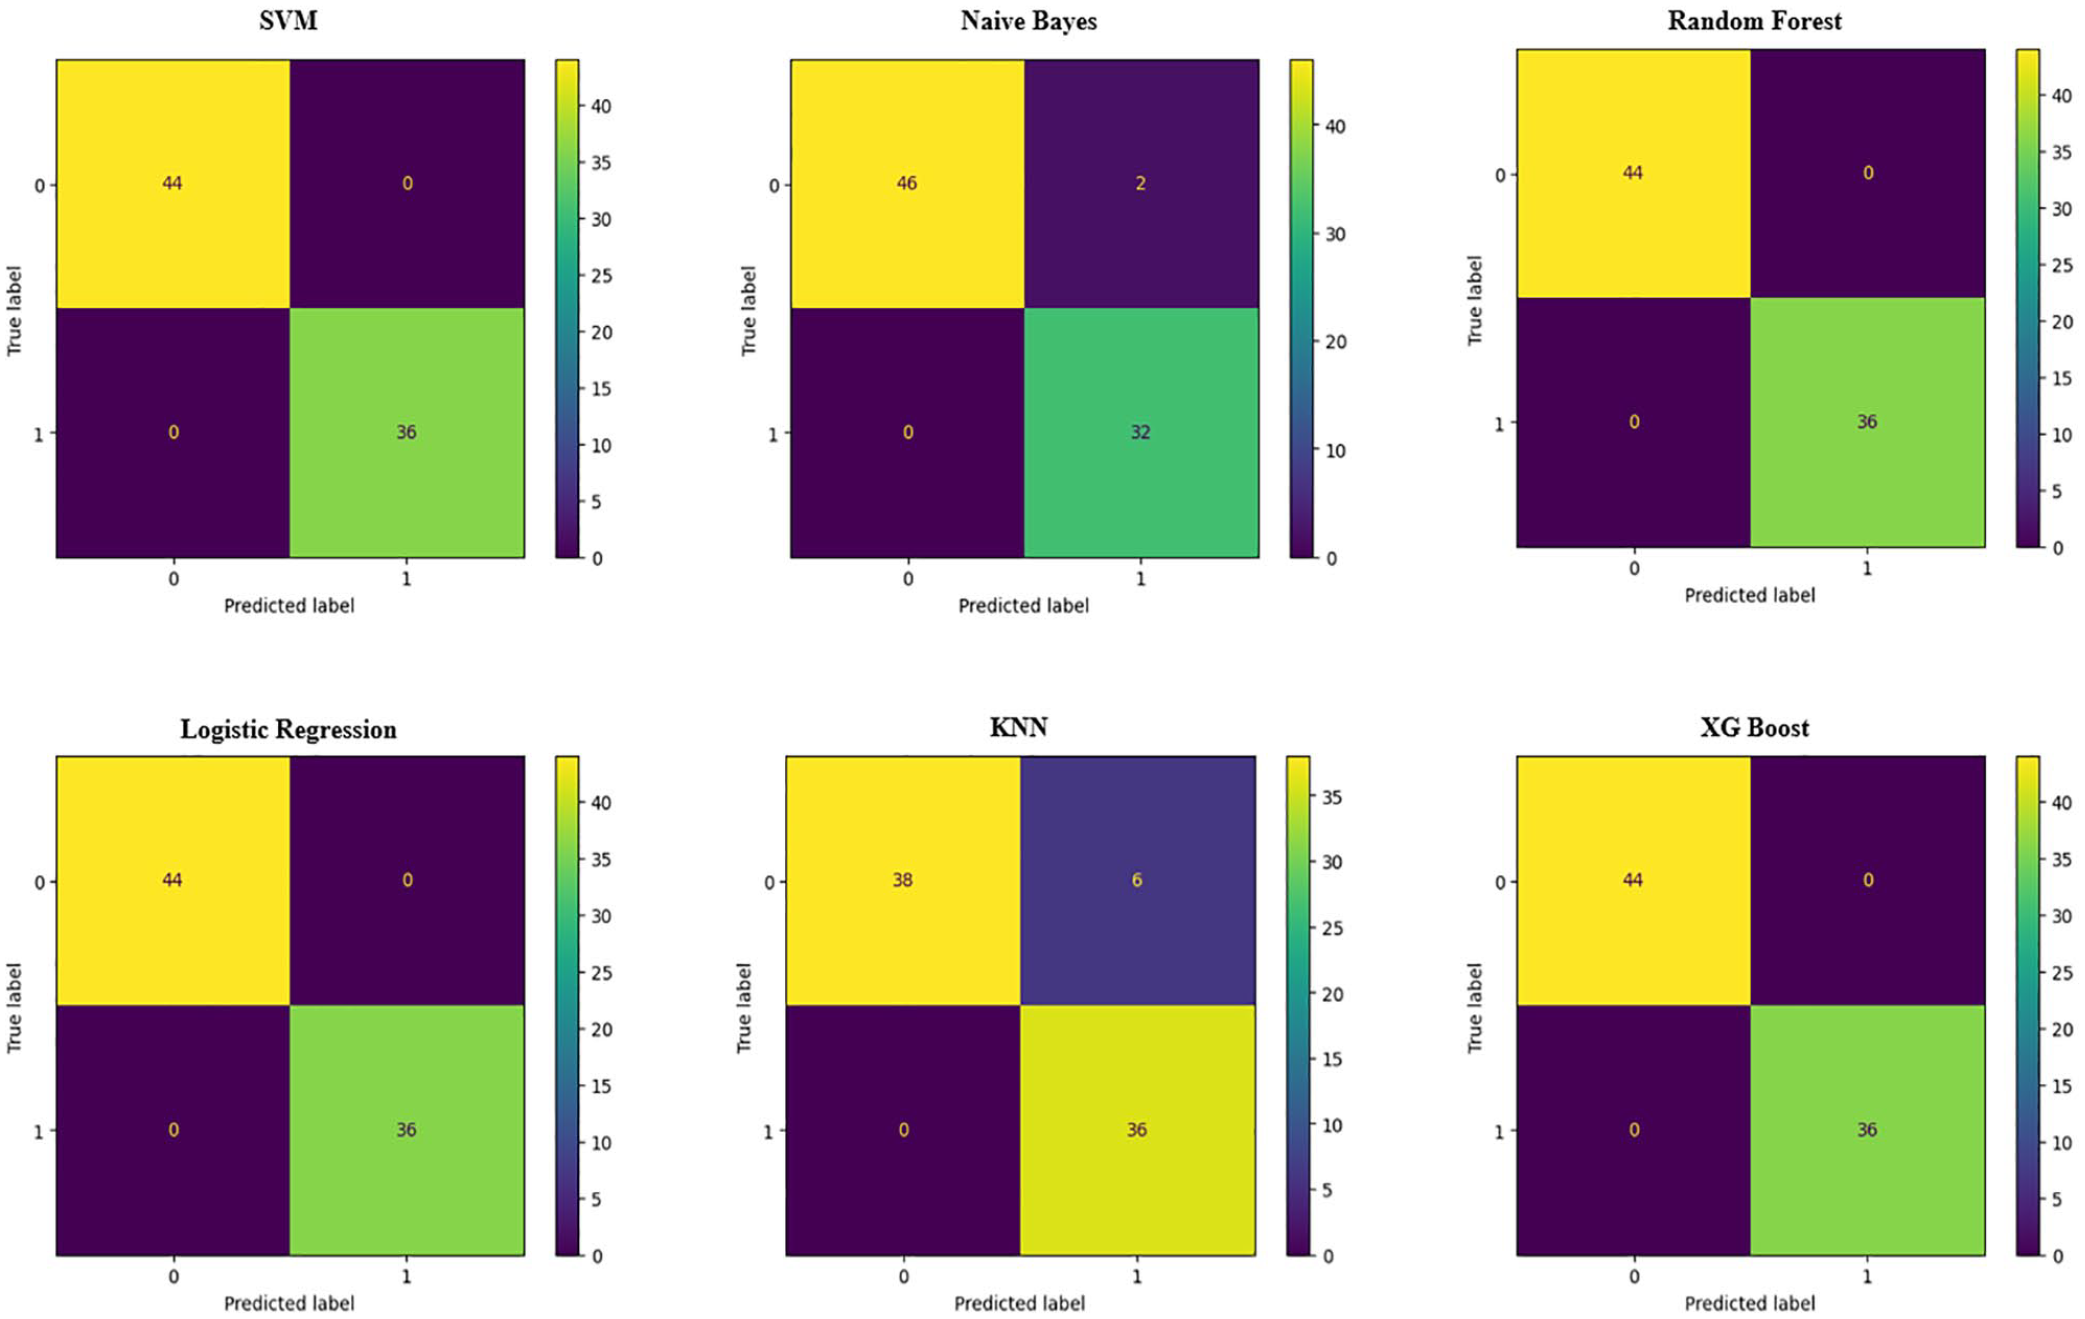
Confusion matrix of machine learning models.

ROC curve and AUC values of machine learning models.
Figure 6 shows the results after applying the polynomial + K-stratified method, with models showing outstanding results. These models performed exceptionally well after applying this processing method, with almost no errors or very minimal ones. In particular, the SVM, Random Forest, Logistic Regression, and XGBoost models achieved perfect performance, with no label misclassifications, demonstrating superior distinguishing ability using the proposed method. Some other models, such as KNN and Naive Bayes, maintained high accuracy with only a few misclassifications. In general, the polynomial + K-stratified method helped improve the accuracy and classification ability of most models tested in this study.
Figure 7 shows the ROC curves and AUC values for various models after applying our method. The SVM, Random Forest, Logistic Regression, and XGBoost demonstrated perfect prediction abilities. The ROC curves of these models are close to the top left corner, indicating very high precision in disease prediction. Naive Bayes achieved an AUC value of 0.98, close to the maximum, showing good prediction performance, but lower than the other models. The KNN had an AUC value of 0.93, lower than the other models, indicating that KNN has a lower classification accuracy but still performs better than the previous methods. In general, most models performed very well with high AUC values, with SVM, Random Forest, Logistic Regression, and XGBoost showing the best performance, while KNN had the lowest AUC, reflecting weaker classification ability.
Performance comparison with the Existing Models
To ensure a fair and transparent performance comparison, we have revised Table 4 to clearly distinguish between studies that used the same UCI CKD data set and those that utilized different or proprietary data sets. For each referenced study, we now indicate the source and the evaluation metric applied, allowing the reader to better assess the comparability of the results.
Comparison of the proposed method with recent studies.

It is important to note that cross-data set performance comparisons are inherently limited due to variations in sample size, feature distribution, preprocessing steps, and class balance. As such, although Table 4 includes representative benchmarking results, our performance claims are not intended as definitive superiority over all previous studies, but rather to illustrate the effectiveness of our method under consistent experimental conditions using the publicly available UCI CKD data set. In this controlled setting, our method achieves perfect classification accuracy (1.00) across multiple classifiers (SVM, KNN, Random Forest (RF), and Decision Tree (DT)), representing a meaningful improvement over previous approaches applied to the same data set.
In this study, we compare our proposed method, which achieved the highest precision, with several recent studies on the data set tested in this research and some similar data sets, as shown in Table 4. As summarized in Table 4, our method demonstrates superior performance in the UCI CKD data set compared to previous methods, particularly when evaluated under the same data conditions and using consistent metrics.
The results of the proposed method in this study, using a combination of SVM, Random Forest, Logistic Regression, and XGBoost in the UCI data set, achieved a perfect precision of 1.0, outperforming previous studies where the highest accuracy was only 0.99. This demonstrates the effectiveness of using the polynomial technique to create additional features and applying the feature-based stratified splitting method with K-means, which significantly improved the performance of ML models. This proposed method greatly enhanced the accuracy of the models through 2 key factors:
- PF Technique: This technique helps create new features from the original data by combining existing features through quadratic or higher-order operations. It enables the model to learn more complex nonlinear relationships between features, thus improving the classification ability.
- Feature-Based stratified splitting with k-means: In addition to label-based stratification, the proposed method also utilizes feature-based stratification with K-means, ensuring an even distribution of features between the training and test sets. This minimizes data distribution imbalance, increasing the model’s generalization ability and effectiveness when applied to real-world data.
Compared to previous studies, this method excels in both generating complex features and ensuring uniform data distribution. The application of these advanced techniques not only achieved high accuracy but also paved the way for significant advancements in improving the performance of ML models in future medical research.
Interpretability of the model and clinical transparency
In health care applications, interpretability is critical for clinical adoption and trust in artificial intelligence (AI)-based decision support systems. Medical professionals are less likely to adopt models whose decisions cannot be explained or justified in terms of clinical knowledge. While some of the ML models employed in this study, such as Decision Trees and Random Forests, offer a degree of intrinsic interpretability through feature importance rankings and rule-based structures, other models like SVMs and KNNs, are often considered “black-box” in nature.
To address this challenge, the proposed framework is compatible with post hoc Explainable AI (XAI) techniques such as SHAP (SHapley Additive Explanations) and LIME (Local Interpretable Model-Agnostic Explanations). These tools can generate both global explanations (eg, overall importance of features) and local explanations (eg, which features contributed the most to an individual prediction), helping clinicians understand and validate AI-driven outputs. For example, SHAP values could be used to visualize how elevated serum creatinine or low hemoglobin levels influence the predicted risk of CKD in a specific patient.
Future versions of our model will incorporate such explainability modules directly into the prediction pipeline, enabling the delivery of interpretable risk scores and transparent reasoning paths alongside predicted labels. This addition is expected to improve clinical decision-making, promote physician confidence, and meet regulatory standards for AI in health care.
Computational time and scalability
Although the proposed method was developed and evaluated using the UCI CKD data set, a relatively small and clean data set, its design also considers efficiency and adaptability for large-scale or real-time health care systems. To assess the computational feasibility, we conducted time-based evaluations for all models using a standard computing setup (Intel Core i7 processor, 16 GB RAM, no GPU acceleration).
All classifiers, including SVM, KNN, Decision Tree, and Random Forest, completed the training in less than 2 seconds, and the prediction latency was less than 100 ms per sample. This performance indicates that the method is suitable for real-time or near-real-time deployment in clinical screening tools or EHR platforms.
In terms of computational complexity, the stratified splitting introduces an additional preprocessing step, with complexity
To ensure scalability to larger data sets, future extensions may include dimensionality reduction techniques (eg, Principal Component Analysis (PCA), feature selection), batch-wise splitting, and parallel processing strategies. These enhancements will support deployment in hospital-scale environments and facilitate integration into cloud-based medical analytics platforms.
Conclusions and Future Directions
Conclusions
This study introduced a promising new method that aims to balance the feature distribution between the train and the test sets to predict CKD. By combining K-means clustering with a feature-based stratified data-splitting strategy, along with the use of the polynomial technique to increase the number of features, the study successfully improved model accuracy. The proposed method demonstrated outstanding efficiency in improving the performance of ML models, with SVM, Random Forest, Logistic Regression, and XGBoost achieving perfect accuracy.
A key highlight of this study is the feature-based stratified data-splitting method, ensuring that both the train and test sets contain representative features from all clusters, minimizing bias during training, and enhancing the model’s generalization ability. The use of the KS test to evaluate feature distribution uniformity showed that this method helps ML models perform well not only on the training set but also on the test set and in real-world scenarios. Moreover, the combination of feature clustering with the polynomial technique, which increases the number of features without adding complexity to the prediction model, enhances its ability to accurately identify patterns. This study makes significant advancements in CKD prediction and opens new avenues to address the imbalance of feature-level data. The proposed method has wide applicability across various fields, from health care to finance and technology, where model accuracy and generalization are critical factors.
The proposed method shows promising potential for robust CKD prediction using small and balanced data sets. While the proposed framework demonstrates strong performance in the UCI CKD data set, we recognize that this data set is relatively small (400 samples) and well-curated, which may not fully reflect the complexity of real-world clinical environments. In practical health care settings, EHR often contain missing values, outliers, and inconsistent measurements due to diverse data entry practices, patient conditions, and equipment variability. To improve generalizability, future research will focus on validating the proposed method in larger and more heterogeneous data sets, such as MIMIC-III or data collected from hospital information systems. These data sets include a broader spectrum of patient profiles, clinical contexts, and noise levels, making them more representative of operational deployment conditions. Furthermore, we plan to incorporate robust preprocessing pipelines, including missing value imputation, outlier detection, and adaptive feature selection techniques to improve the model’s resilience. By expanding the validation to diverse real-world data sets, we aim to confirm the adaptability, precision, and robustness of the proposed framework in actual clinical workflows.
Beyond technical contributions, this study has significant implications for clinical practice. Chronic kidney disease often progresses silently and is frequently underdiagnosed in its early stages, especially in resource-limited health care settings. The proposed ML framework, by improving generalization through feature-aware data splitting and nonlinear feature expansion, has the potential to serve as a foundation for Clinical Decision Support Systems (CDSS) that help physicians in early risk stratification. Such systems could alert high-risk patients before a critical decline occurs, allowing timely intervention and personalized treatment plans. In addition, the compatibility with real-time implementation allows it to integrate with EHR platforms and point-of-care diagnostic tools. By enhancing interpretability, balancing data sets, and improving predictive accuracy, the approach proposed in this study offers a practical path toward deploying ML models in real-world CKD screening and monitoring programs.
Future directions
Based on the content of this study, future developments could focus on the following aspects:
Applying ML models to real-world data and clinical environments: Current research uses data from the UCI database, which is already processed and standardized. Applying ML models to real hospital data, where the data are complex and incomplete, would be a major step forward. This would help to evaluate the generalizability and performance of the models in real-world medical environments, improving reliability in disease diagnosis.
Improving interpretability for doctors: Although ML models have achieved high performance, a key challenge is how to interpret the prediction results clearly for physicians. Future research should consider integrating methods such as Shapley values or LIME to help doctors understand the reasoning behind model decisions, increasing the practical applicability of these models.
Expanding applicability to other diseases: Currently, the study focuses on CKD. Expanding the research to other diseases, such as cardiovascular disease, diabetes, or cancer, will help assess the generalizability of the models and extend the application of ML in various medical fields.
Performance analysis on large data sets: The study should continue to scale up the data to evaluate the models’ ability to handle large data sets and their performance in environments with large amounts of data. This is important when ML systems are integrated into health care facilities with continuous real-time data processing needs.
Optimizing computational time: When models are applied to large-scale systems, computational time and optimization play an important role. Analyzing and optimizing processing time on large data sets are a necessary development direction to ensure feasibility in real-world applications.
Comparison with new methods: In addition to using traditional ML models, integrating and comparing with newer methods, such as deep learning or other hybrid models, will also contribute significantly to improving prediction performance.
These directions will help expand the applicability of ML models in the health care field and improve the ability to diagnose CKD as well as other diseases.
Footnotes
Acknowledgements
We acknowledge Nguyen Tat Thanh University, Ho Chi Minh City, Vietnam for supporting this study.
Ethical considerations
This study was conducted in accordance with ethical standards and guidelines set by the research ethics committee (REC) review. Ethical approval was obtained from the Institute of Interdisciplinary Sciences, Nguyen Tat Thanh University, approval number 001010, on October 1, 2024. All participants involved in this study were informed about the research objectives and provided written informed consent prior to participation. Confidentiality and anonymity of the participants and data were maintained throughout the research process. No animals were used in this study, and the research followed all applicable guidelines for the ethical treatment of human subjects, where relevant.
Consent to participate
All participants in this study were fully informed about the purpose, procedures, and potential risks of the research. Written informed consent was obtained from each participant prior to their involvement. Participation in the study was voluntary, and participants were free to withdraw at any time without any consequences. Confidentiality and privacy of the participants were strictly maintained, and all personal data were anonymized to protect their identity.
Consent for publication
All participants provided written informed consent for the publication of the data collected during the study. Participants were informed that their personal information would remain confidential, and any identifying details would be anonymized in any published materials. They were made aware that the results of this research may be published in scientific journals, conference proceedings, or other public formats, and they agreed to the publication of such data.
Author contributions
Funding
The author(s) received no financial support for the research, authorship, and/or publication of this article.
Declaration of conflicting interests
The author(s) declared no potential conflicts of interest with respect to the research, authorship, and/or publication of this article.
Data availability statement
The data presented in this study were collected and processed by the research team. Due to confidentiality concerns, the data are not publicly available. However, the data can be shared upon reasonable request from reviewers or individuals interested in the research.
Declaration of interest statement
This is to certify that, to the best of authors’ knowledge, the content of this manuscript is original. The paper has not been submitted elsewhere nor has been published anywhere. Authors confirm that the intellectual content of this paper is the original product of our work, and all the assistance or funds from other sources have been acknowledged.