
Abstract
Tumor heterogeneity is a challenge to designing effective and targeted therapies. Glioma-type identification depends on specific molecular and histological features, which are defined by the official World Health Organization (WHO) classification of the central nervous system (CNS). These guidelines are constantly updated to support the diagnosis process, which affects all the successive clinical decisions. In this context, the search for new potential diagnostic and prognostic targets, characteristic of each glioma type, is crucial to support the development of novel therapies. Based on The Cancer Genome Atlas (TCGA) glioma RNA-sequencing data set updated according to the 2016 and 2021 WHO guidelines, we proposed a 2-step variable selection approach for biomarker discovery. Our framework encompasses the graphical lasso algorithm to estimate sparse networks of genes carrying diagnostic information. These networks are then used as input for regularized Cox survival regression model, allowing the identification of a smaller subset of genes with prognostic value. In each step, the results derived from the 2016 and 2021 classes were discussed and compared. For both WHO glioma classifications, our analysis identifies potential biomarkers, characteristic of each glioma type. Yet, better results were obtained for the WHO CNS classification in 2021, thereby supporting recent efforts to include molecular data on glioma classification.
Keywords
Introduction
Glioma is one of the most common brain tumors, which in adults represents more than
The World Health Organization (WHO) classification of the central nervous system (CNS) introduced molecular characteristics as part of the diagnosis of glioma tumors in 2016. 4 This novelty represented a valuable improvement, given the subjectivity of the histological evaluation. 5 However, with this integrated diagnosis, contradictory results could arise, in case of patients showing inconsistent histological and molecular features. 4
In 2021, the glioma classification procedure was updated, 6 mainly focusing the diagnosis on the evaluation of objective genetic features and solving the problem of possible contradictory diagnostic results that could arise from the 2016 approach. In the latest guidelines release, the status of the isozymes of the isocitrate dehydrogenase (IDH) gene family and the combined loss of the short arm chromosome 1 and the long arm of chromosome 19 (1p/19q codeletion), already introduced in 2016, became central for the classification of glioma types. In particular, IDH-mutant samples are classified as oligodendroglioma if presenting 1p/19q codeletion; conversely, the diagnosis of astrocytoma is assigned. The IDH-wild-type samples are classified as glioblastoma (GBM) if certain histological features or genetic parameters are present. These modifications in the glioma classification as defined by the WHO CNS guidelines aimed to support as best as possible the diagnosis, which is the first essential step to designing an effective therapy. 7 Indeed, given the deep differences in glioma, each type could be influenced by specific markers, having an impact on cancer development. 8 In this context, discovering the existing underlying characteristics could be crucial to improve patient prognosis. 3
Nowadays, thanks to modern data extraction techniques and gene sequencing advances, large sets of data are available. The huge dimension of these data sets, as well as the hidden relations existing between biological entities, makes it challenging to infer information linking variables and clinical outcomes. To this end, mathematical and statistical methods can be employed to tackle the problem and to identify potential therapeutic targets.
The high dimensionality of the data poses challenging problems in model identification and parameter estimation, which can be addressed by means of regularization techniques. These methods consist of adding a penalty term to the cost function of the chosen statistical model. In recent years, regularization has been widely used in bioinformatics applications, and several methods have been developed to address this need.
9
However, these classical regularization methods usually perform univariate variable selection, which is unfeasible when considering entities, such as genes, interacting in a complex network. In this context, graph theory can effectively be employed to infer the underlying network structure, being a valuable approach used in precision oncology,10,11 and in glioma.
12
Among the many techniques developed to estimate a graph starting from real data,
13
in this work, we employed graphical lasso, a widely known method combining regularization and network estimation.
14
Graphical lasso estimates relations between variables introducing sparsity through lasso regularization. It is particularly accurate for huge data sets with number of features
Besides the identification of meaningful diagnostic features from the overall network, the evaluation of their prognostic role is an invaluable contribution. Regularized survival analysis can be used to this end. Here, we used the Cox regression model, which is able to determine the association of a set of features with the time until the event of interest occurs. 18 Coupling survival analysis with regularization techniques allows for the selection of features carrying information about the overall network and survival, and, therefore, promising as prognostic biomarkers. 9
In this work, we considered data from The Cancer Genome Atlas (TCGA) program, consisting of a huge data set
The article is structured as follows. In the “Materials and Methods” section, we start introducing the underlying theory of graphical lasso and of Cox regression modeling with lasso regularization, and we describe the data sets preprocessing and workflow analysis. In the “Results” section, the model outcomes are presented and analyzed, followed by a comprehensive discussion of the results, with correspondent biological interpretation. Finally, the conclusion resumes our main contribution.
Material and Methods
Graphical lasso
Let
The graphical lasso,
14
herein designated as glasso, finds the precision matrix

where
Cox regression modeling with lasso regularization
Cox regression is a survival model that relates the rate of an event happening in a given time point (eg, death) with several factors.
18
Given

where

where
To study the relationship between predictor variables and survival outcome in a high-dimensional scenario
Data set preprocessing and framework
The data set selection procedure and the workflow of our analysis are summarized in Figure 1. The glioma data set we used in this study is available on TCGA portal, under the LGG and GBM projects, and it has been downloaded by the

Workflow of the analysis. After the preprocessing of the TCGA-LGG and TCGA-GBM databases, we obtained 6 data sets (3 for each classification procedure, 2016 WHO and 2021 WHO). First step: Glasso algorithm has been applied separately on each glioma type, obtaining the network-based variable reduction. The number of features selected for any given type is reported in the second box of the pipeline. Green indicates astrocytoma (Astro), orange is oligodendroglioma (Oligo), and blue represents GBM. Second step: The features selected by the previous step are used as input for the survival analysis. All the data sets consider a matrix comprising all the glioma samples and different variables, depending on the case of study. Case 1 takes into account all the selected variables. Case 2 refers to the variables exclusively selected from each glioma type. Case 3 considers only the hub genes. Boxes in figure indicate the number of variables of the starting data sets. In each step, the analysis and the comparison between the 2 classification outcomes have been performed.
To assess the assumption of normality required by glasso, we applied the normalization with
For the first step of our methodology, glasso has been applied to each data set, separately. The estimation of sparse networks led to a network-based variable selection, which has been mathematically validated to assess the reliability of the set of identified variables (see Supplemental Section S1). The process of variable selection produced a different subset of genes for each glioma type, namely 465, 577, and 370 genes for astrocytoma, oligodendroglioma, and GBM, considering 2016 WHO classification, whereas 531, 738, and 362 genes for astrocytoma, oligodendroglioma, and GBM, considering 2021 WHO classification (Figure 1; first step). These have been used as starting data sets to perform the second step of survival analysis, as explained in the following sections.
Implementation of variable selection
The variable selection was performed by applying glasso through the
Given a variable
whereas its count measure represents the number of the connection of the variable:

where
As such, the genes can be sorted in ascending order according to both these measures, obtaining, for each data set, 2 ranked lists of genes. To identify the subset of the most relevant variables, for each list, we re-scaled the computed measures, by distributing them uniformly in
Regularized Cox regression modeling, patient stratification, and survival analysis
Survival analysis has been performed by a regularized Cox regression model and implemented through the
The parameter
The function
To determine the threshold value in this imbalanced class situation, we computed a kernel density estimation of the distribution of the PI by the
Based on this patient’ stratification, Kaplan-Meier survival curves were drawn and statistically compared with the log-rank test (hypothesis test to compare the distribution of time until the occurrence of an event in independent groups). A significance level of 0.05 was considered.
Results
In this section, the results obtained from variable selection and survival analysis are shown. We discuss the outcomes in light of the comparison between the 2016 and 2021 WHO CNS guidelines, highlighting differences and similarities arising from the transcriptomics data. Finally, we used the obtained results as baseline knowledge to explore the 2021 estimated networks.
Variable selection
We performed the variable selection by considering each glioma type, separately, taking into account 2 classification procedures.
22
We compared the genes which have been selected for a given tumor type, classified according to the 2 different guidelines (Figure 2; first row). For astrocytoma and oligodendroglioma, the number of variables selected by considering the 2021 WHO CNS classification was larger than the one obtained by following the 2016 guidelines. On the contrary, looking at the output derived from the 2016 classification, the percentage of variables exclusively selected for GBM is double the one of LGG (astrocytoma and oligodendroglioma). However, for all the types, the ranking of the genes that have been exclusively selected is very low, considering both weight and count measures, and, among these genes, there are no variables identified as hubs. The analysis has been repeated by considering the hub gene subsets to discuss the differences in selecting important features. Second row in Figure 2 shows the result of this comparison. For astrocytoma and GBM, most 2016 hub genes are identified as important also according to the 2021 WHO CNS sample classification, ie,

Venn diagrams showing the number of variables selected by glasso considering 2016 versus 2021 WHO CNS classification guidelines, for each glioma type (astrocytoma—Astro, oligodendroglioma—Oligo, and GBM). Percentages in brackets refer to the relative percentage of the exclusively selected variables for each set. The first row considers all the selected genes, whereas the second row is only about hub genes.
Given the genes identified as hubs exclusively for a certain classification, we can check their rankings computed in the other classification. Commonly, these genes are placed in high positions (green and purple boxes in the vectors in Figure 3), suggesting that the hubs have a key role in the networks, independently from the considered classification. Only a few genes do not follow this trend (dotted arrows in Figure 3). In particular, in 2021 GBM we identified the CCNA2 (Cyclin-A2)

Cross-comparison of the hub gene rankings with respect to the other classification. Green, purple, and yellow vector sections represent top, middle, and low positions, respectively. Continuous arrows indicate the positions of most of the hubs. Dotted arrows highlight the 3 2021 hub genes having low 2016 rankings.
As shown in Figure 4 (first row), for both classification procedures, the 3 tumor types share a considerable number of features. Nevertheless, we can observe more similarities in gene selection between astrocytoma and oligodendroglioma, compared with GBM. This result has been also confirmed by the analysis of the hub genes (Figure 4; second row), especially following the 2016 WHO CNS classification, where the set of GBM hubs does not intersect with the others. The comparison of these diagrams also shows a big difference in hub selection, in shared/exclusive genes, revealing the impact of the classification procedure in the selection of key features.

Venn diagrams comparing the variables selected by glasso from each glioma type (astrocytoma—Astro, oligodendroglioma—Oligo, and GBM). The first and second columns show glasso results, respectively, for 2016 and 2021 WHO CNS classifications. The first row considers all the selected genes, whereas the second row is only about hub genes.
Survival analysis
For each classification, survival analysis was performed by considering data sets comprising all the glioma samples; case 1 considers the complete set of variables selected by glasso, case 2 considers only the subset of variables exclusively selected from each glioma type, or case 3 considers only the identified hub genes. We should note that the data set construction depends on the class labels, as the variables constituting each data set have been selected by applying glasso algorithm on each glioma type, separately. However, the Cox regression model fitting followed an unsupervised approach, ie, the model learnt through data that was unlabelled. Since the glioma types often exhibit different prognosis, as validation of our results, we expect to find an association between the given diagnostic label and the prediction of survival.
Overall, our sets of variables allow a statistically significant separation (P
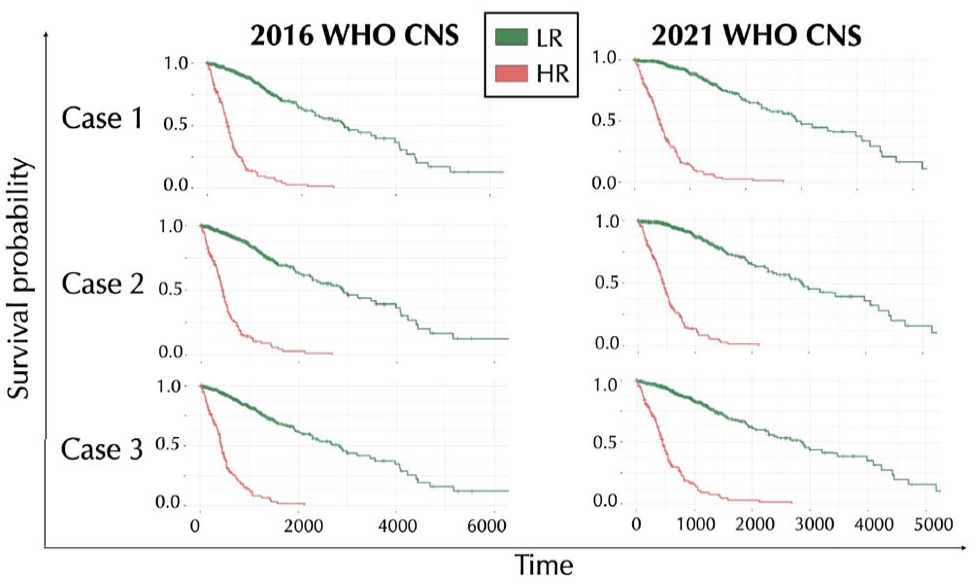
Kaplan-Meier survival curves obtained by the regularized Cox regression method applied to our cases of study. Case 1 considers a starting data set comprising all the selected variables. Case 2 refers to the variables exclusively selected from each glioma type. Case 3 considers only the hub genes. Green lines represent the survival probability of LR sample group, whereas red lines refer to the HR sample group.
To analyze the 2 HR and LR groups, we first compared the patient stratification obtained in the 3 cases. For both the classifications, most of the samples are recognized to be part of the same group, independently from the case of study, ie, about
Table 1 resumes the numbers and percentages of HR and LR samples identified in case 1, by specifying their glioma type.
Cross-comparison between the composition of high- and low-risk groups and sample glioma types, depending on glioma classification.

Considering the 2016 variables, the HR group contains 179 samples. According to 2016 WHO CNS,
The regularized Cox regression model allowed for the selection of relevant features to describe the patient’s survival data. In case 1, 24 and 23 genes are identified, respectively, from the 2016 and 2021 classification data sets. We observed that
Gene networks from 2021 WHO CNS classification
The previous analyses denoted the 2021 WHO CNS classification as the most suitable for studying the glioma types. Moreover, survival analysis recognized the set of exclusive genes as very informative for prognosis, since, in 2021, they represent

GBM gene network estimated through glasso. Nodes represent genes exclusively selected from GBM data set (yellow) and others directly linked with them (white). Blue and pink nodes highlight genes with prognostic value, according to regularized Cox model, which could in turn be exclusive for GBM or shared, respectively. Network layout stresses the adjacency between nodes, based on the Fruchterman-Reingold force-directed algorithm. Edge thickness depends on the strength of the corresponding connection.
This network comprises 175 nodes, among which 102 are genes exclusively selected from GBM data set. On the left side, we can observe a dense group of nodes, including genes selected for their prognostic value (AURKA—Aurora kinase A—and—SGOL1—Shugoshin 1). The network includes 6 exclusive genes selected by the regularized Cox regression model, and some of them are involved in very strong connections, represented by bold edges. Specifically, the 2 genes HMP19 (Neuronal Vesicle Trafficking Associated 2) and FAM115C (TRPM8 Channel-Associated Factor 2) are predicted to be linked with SVOP (Synaptic Vesicle 2-Related Protein) and LOC154761 (Family With Sequence Similarity 115, Member C Pseudogene), respectively. A strong correlation can be also observed between AURKA and UBE2C (Ubiquitin-conjugating Enzyme E2C).
This network representation has been reproduced also for the other 2 glioma types (Supplemental Figures S2 and S3). By the analysis of the astrocytoma network, we identified a potential interesting subnetwork constituted by 3 exclusive genes, FAM123C (APC Membrane Recruitment Protein 3)—also selected in the regularized survival model)—ACTL6B (Actin Like 6B), and INA (Internexin Neuronal Intermediate Filament Protein Alpha). Interestingly, a study about Melanoma Differentiation Associated gene - 9 (MDA-9)/Syntenin dysregulation in cancer pointed out these 3 genes as highly downregulated in glioma with high MDA-9/syntenin expression. 38 Observing the oligodendroglioma network, we discovered that it contains all the exclusive genes that in our literature review ended with no information. One of them, RAB36, Member RAS Oncogene Family, appears strongly connected in biggest subnetwork, in which also appear many oligodendroglioma genes, such as TSPYL5 (Testis-specific Y-encoded-like protein 5), RASAL1 (Rat sarcoma (RAS) protein activator like 1), andKLHL26 (Kelch Like Family Member 26).
Discussion
The main goal of this work was to discuss differences and similarities at the transcriptomic level between the 2 most recent glioma classifications, provided by the 2016 and 2021 WHO CNS guidelines. The glioma type of each sample of TCGA RNA-Seq data set was updated, and the glasso algorithm was applied to each glioma subgroup. The sets of selected variables were analyzed and used as the starting point for survival analysis performed with regularized Cox model and consequent patient stratification.
Our results suggest that the 2 classification procedures do not provide remarkable differences in variable selection. Even if the algorithm identified variables exclusively related to 1 classification, the corresponding rankings are low. Moreover, all the identified hubs are part of the subset of selected features, independently from the classification. However, comparing the hub subsets, our results highlight that the 2 procedures identified different key genes, suggesting that the classification could affect the detection of potential biomarkers specific to each glioma type. In particular, for GBM and astrocytoma, the 2021 classification provides larger sets of hub genes, including almost all the 2016 hubs. In addition, our analysis reveals 3 2021 hub genes, 1 from GBM and 2 from astrocytoma, having low rankings according to the 2016 classification. This seems to indicate that grouping the samples following the 2021 guidelines leads to a more comprehensive list of key features.
The statistically significant stratification of patients into HR and LR groups derived by survival analysis indicates that our selected sets of variables carry enough information to divide samples into HR and LR groups, serving also as validation of the glasso results.
Moreover, most of the variables selected as genes able to describe survival in case 1 (which took into account all the variables selected by glasso) have also been pointed out as output in case 2, in which the data set considered only variables exclusively selected by each glioma type. This outcome is particularly interesting, since while the genes commonly selected by all the glioma types could be either related to specific-glioma mechanisms or general cell functions, the exclusive genes can be considered more characteristic of the corresponding glioma type. In this light, these results suggest that variables that have been selected based on their relevance for each glioma type (diagnostic value) also hold prognostic information.
The patient stratification into HR and LR groups derived from survival model fitting is consistent with literature,
39
since GBM samples are associated with the worst survival, and they constitute the major part of the HR group. The 2021 classification leads to better results in both distinction with statistical significance of LR and HR groups, and the association between GBM and poor survival, given that the percentage of GBM samples in the HR group increases by more than
As expected, the unsupervised sample grouping into HR and LR underlines the presence of some unconventional associations between glioma subtypes and overall survival. Based on the 2016 variable selection, the survival returns a HR group containing 179 samples. Despite
The literature research on the 37 genes identified as having prognostic relevance revealed that
The provided network visualization could be used as a tool to disclose unknown relations and to support biological research. Allowing for the detection of relevant subnetworks within glioma types, network inference offers valuable insights into glioma development mechanisms. For instance, our study uncovered a robust link between LOC154761 and FAM115C in the GBM network. According to the performed multivariate Cox regression model, FAM115C emerged among the genes significantly contributing to the differentiation between HR and LR patients, a result that aligns with previous research identifying it as an oncogene implicated in promoting glioma malignancy and affecting prognosis. 40 A recent study has also demonstrated that FAM115C overexpression promotes glioma cell migration and invasion, 41 traits that characterize GBM progression. On the contrary, whereas the functional role of LOC154761 in glioma disease remains unexplored, its downregulation in GBM compared with normal tissue 42 suggests a possible involvement of this gene in cancer-related processes.
Another noteworthy result of our network analysis was the detection of a strong relation between AURKA and UBE2C genes, indicating their potential combined importance in GBM regulation. Prior studies on glioma have shown AURKA’s role in cancer cell self-renewal, 43 whereas overexpression of UBE2C has been linked to aggressive tumor progression. 44 Notably, research in colorectal cancer has demonstrated that the AURKA-mediated overexpression of UBE2C may produces a synergistic oncogenic effect, exacerbating tumor characteristics. 45 Although the combined impact of AURKA and UBE2C in glioma remains underexplored, a previous study focused on the correlation between UBE2C and AURKB (Aurora kinase B), 46 a gene sharing a similar role to AURKA in cell division during mitosis and tumorigenesis. 47 This research highlights that the genes’ co-overexpression in glioma correlated with poor prognosis and therapy resistance, suggesting AURKB and UBE2C as potential therapeutic targets. These findings, and the high functional similarity between AURKA and AURKB, strongly support the potential involvement of the AURKA and UBE2C relationship in GBM pathogenesis. Further biological studies are warranted to elucidate the combined impact of these genes and explore their therapeutic implications.
Conclusions
To our knowledge, this is the first work discussing differences and similarities between the 2 most recent glioma classifications in their impact on potential biomarker identification for each glioma type.
According to our results, transcriptomics data seem to align with the current changes in glioma classification guidelines, since the new 2021 WHO CNS classification provides better results in variable selection and identification of key features, compared with the previous version of 2016.
The survival analysis allows the separation of samples into the HR and LR groups, proving that the sets of variables we identified carry information also from the prognostic point of view. The 2021 classification led to better stratification of patients based on their survival profiles, since the percentage of GBM (characterized for worst prognosis than LGG) in the HR group increased compared with the 2016 classification, as expected. Moreover, with our pipeline, we provide a useful way to disclose unknown gene relations through network visualization.
Overall, our study brings insight into new features with a diagnostic and prognostic value that can be further biologically evaluated. However, the presence of unexpected associations between glioma types and predicted survival suggests that, although molecular features are essential in predicting patient survival, histology has an impact on the risk of death. Therefore, additional efforts are needed to further characterize the heterogeneity of glioma types and improve their overall classification. We hope our results motivate the scientific community to further investigate the role of the genes we identified, intending to improve glioma therapies.
Supplemental Material
sj-pdf-1-bbi-10.1177_11779322241271535 – Supplemental material for Inferring Diagnostic and Prognostic Gene Expression Signatures Across WHO Glioma Classifications: A Network-Based Approach
Supplemental material, sj-pdf-1-bbi-10.1177_11779322241271535 for Inferring Diagnostic and Prognostic Gene Expression Signatures Across WHO Glioma Classifications: A Network-Based Approach by Roberta Coletti, Mónica Leiria de Mendonça, Susana Vinga and Marta B. Lopes in Bioinformatics and Biology Insights
Footnotes
Funding:
The author(s) disclosed receipt of the following financial support for the research, authorship, and/or publication of this article: This work was supported by national funds through Fundação para a Ciência e a Tecnologia (FCT) with references CEECINST/00042/2021, UIDB/00297/2020 (DOI: 10.54499/UIDB/00297/2020) and UIDP/00297/2020 (DOI:10.54499/UIDP/00297/2020) (NOVA Math), UIDB/50021/2020 (DOI:10.54499/UIDB/50021/2020) (INESC-ID), UIDB/00667/2020 (DOI: 10.54499/UIDB/00667/2020) and UIDP/00667/2020 (DOI:10.54499/UIDP/00667/2020) (UNIDEMI), and the research project “MONET: Multi-omic networks in gliomas” PTDC/CCI—BIO/4180/2020 (DOI: 10.54499/PTDC/CCI-BIO/4180/2020), and LAETA Base Funding (DOI: 10.54499/UIDB/50022/2020). This project has received funding from the European Union’s Horizon 2020 research and innovation program (grant agreement no. 951970) (OLISSIPO project). The results showed here are based on data generated by the TCGA Research Network: ![]() .
.
Declaration of Conflicting Interests:
The author(s) declared no potential conflicts of interest with respect to the research, authorship, and/or publication of this article.
Author contributions
Supplemental material
Supplemental material for this article is available online.
References
Supplementary Material
Please find the following supplemental material available below.
For Open Access articles published under a Creative Commons License, all supplemental material carries the same license as the article it is associated with.
For non-Open Access articles published, all supplemental material carries a non-exclusive license, and permission requests for re-use of supplemental material or any part of supplemental material shall be sent directly to the copyright owner as specified in the copyright notice associated with the article.