
Abstract
COVID 19 pandemic is still ongoing, having taken more than 6 million human lives with it, and it seems that the world will have to learn how to live with the virus around. In consequence, there is a need to develop different treatments against it, not only with vaccines, but also new medicines. To do this, human-virus protein-protein interactions (PPIs) play a key part in drug-target discovery, but finding them experimentally can be either costly or sometimes unreliable. Therefore, computational methods arose as a powerful alternative to predict these interactions, reducing costs and helping researchers confirm only certain interactions instead of trying all possible combinations in the laboratory. Malivhu is a tool that predicts human-virus PPIs through a 4-phase process using machine learning models, where phase 1 filters ssRNA(+) class virus proteins, phase 2 filters Coronaviridae family proteins and phase 3 filters severe acute respiratory syndrome (SARS) and Middle East respiratory syndrome (MERS) species proteins, and phase 4 predicts human-SARS-CoV/SARS-CoV-2/MERS protein-protein interactions. The performance of the models was measured with Matthews correlation coefficient, F1-score, specificity, sensitivity, and accuracy scores, getting accuracies of 99.07%, 99.83%, and 100% for the first 3 phases, respectively, and 94.24% for human-SARS-CoV PPI, 94.50% for human-SARS-CoV-2 PPI, and 95.45% for human-MERS PPI on independent testing. All the prediction models developed for each of the 4 phases were implemented as web server which is freely available at https://kaabil.net/malivhu/.
Introduction
The outbreak of disease-causing agents is continuously threatening public health worldwide, particularly viruses. Millions of people die due to the effects of illnesses resulting from virus infections, and over the years, more aggressive epidemics are arising. A recent example is the COVID-19 pandemic, caused by the sudden acute respiratory syndrome (SARS) virus SARS-CoV-2, a successor of SARS-CoV in 2002 and the Middle East respiratory syndrome (MERS) in 2012, which are the 3 recorded outbreaks of a coronavirus. 1 Although it is less deadly than its predecessors, 2 COVID-19 has the highest transmissibility, 3 making it harder to control. Vaccines from the industry, such as Moderna, Pfizer-BioNTech, and CoronaVac, have been developed, 4 but not everyone is vaccinated, and some are still getting infected, especially when exposed to the omicron variant, where the effectiveness can drop by 20% compared with the alpha variant (85% down to 65%) after 2 doses. 5 As the risk of contracting COVID-19 persists after vaccination and increases depending on the conditions, there is a need to develop treatments to help alleviate the symptoms and remove the virus from the body.
To identify drug targets that can attack the virus, a widely used method is finding protein-protein interactions (PPIs) between the host and pathogen proteins. 6 These PPIs can be used not only to develop new medicines but also to determine protein functions, biological pathways, protein complexes, among other uses, and can be found through experimental or computational methods. Experimental methods can be either high-throughput or low-throughput. High-throughput methods can quickly identify a large number of PPIs, but may have a high false-positive rate, whereas low-throughput methods can detect interactions with high confidence, but only a few per run, 7 making them inefficient for discovering interactions, unless there is a specific small group of proteins that researchers want to study. Computational methods have been developed as a complementary approach to support experimental methods due to their inability to produce a high number of interactions with high quality. These computational methods generally use machine learning, implementing classic algorithms like support vector machines or random forests, as well as deep learning (eg, neural networks), and other methods such as interolog, functional domains, gene expression, and tertiary structures. 8
In this work, we introduce Malivhu, a web server that employs convolutional neural networks (CNNs) and random forests (RFs) to filter input viral proteins belonging to SARS-CoV, SARS-CoV-2, and MERS in 3 phases, and subsequently predicts human-virus PPIs. These 3 viruses are members of the Coronaviridae family, which fall under the ssRNA(+) class viruses according to the Baltimore classification. With this classification in mind, Malivhu operates through 4 phases to filter and predict the PPIs. Phase 1 predicts whether the input viral sequences are proteins from ssRNA(+) viruses. Phase 2 assesses if the sequences that passed phase 1 are proteins from members of the a Coronaviridae family. Phase 3 predicts if the Coronaviridae sequences belong to SARS and MERS viruses. Phase 4 predicts if these viral sequences interact with the input human sequences. In addition, phase 4 can be executed separately, allowing users to specify whether the viral sequences come from SARS-CoV, SARS-CoV-2 or MERS. The performance of the models was evaluated using metrics such as Matthews correlation coefficient (MCC), F1-score, specificity (SP), sensitivity (SN), and accuracy (ACC) scores, resulting in accuracies of 99.08%, 99.8%m and 100% for the first 3 phases, respectively, and in the fourth phase, 94.7% for human-SARS-CoV PPI, 94.68% for human-SARS-CoV-2 PPI, and 96.97% for human-MERS PPI. Furthermore, all models have been integrated into a web FFserver named Malivhu (MAchine LearnIng for Virus classification and virus-HUman interaction prediction). From the results output, users can also predict the secondary and tertiary structure of the predicted proteins. In the fourth phase, an efficient visualization capability has been implemented to visualize both the human-Coronaviridae PPIs among the submitted sequences, and a prediction of all submitted human proteins against all popular proteins belonging to SARS-CoV, SARS-CoV-2, and MERS. The Malivhu web server is publicly available at https://kaabil.net/malivhu/.
Methods
Data collection
In the first phase, to classify ssRNA(+) vs non-ssRNA(+) sequences, we collected 11 4 93307 sequences, divided into 8 classes based on the Baltimore classification: dsDNA (1 429 752), ssDNA (143 948), dsRNA (212 123), ssRNA(+) (7 623 595), ssRNA(+) (1 495 895), ssRNA-RT (388 351), dsDNA-RT (78 113), and a group of non-viral sequences (67 530). Viral data was obtained from NCBI Virus 9 with the Virus filter using each class as input, and the NIAID Virus Pathogen Database and Analysis Resource (ViPR) 10 through the website at http://www.viprbrc.org/ by downloading the data sets of all the available viral families. Non-viral data were selected from 12 different species: Homo sapiens (20 395), Arabidopsis thaliana (16 043), Bos taurus (6014), Drosophila melanogaster (3638), Oryza sativa (4112), Saccharomyces cerevisiae (6721), Escherichia coli (4518), Bacillus subtilis (4191), Aeropyrum pernix (374), Pyrococcus horikoshii (494), Pyrococcus abyssi (477), and Archaeoglobus fulgidus (1030). We retrieved their reviewed (manually curated) proteins from UniProtKB. 11 These 12 species were selected due to their high number of reviewed proteins in UniProtKB compared with other species in their own kingdom (ie, animal, plant, fungi, eubacteria, and archaebacteria), so we could cover a wide range of proteins belonging to diverse species.
For the second phase, to classify Coronaviridae vs other ssRNA(+) sequences, we collected 1 589 097 sequences from NCBI Virus protein explorer with the Virus filter using each of the 51 ssRNA(+) found families as a filter (Additional file 1: Table S1), getting 2 998 608 Coronaviridae sequences and 179 586 non-Coronaviridae sequences. This constituted our positive and negative training and testing data sets for this phase.
For the third phase, to classify SARS vs MERS vs other Coronaviridae sequences, we collected 5 966 105 sequences from NCBI Virus protein explorer with the Virus filter using each of the 7 selected virus subspecies: SARS-CoV (2 972 910), SARS-CoV-2 (2 977 492), MERS (8848), OC43 (2922), NL63 (1340), HKU1 (1362), and 229E (1231). As Malivhu focuses on the human species as a host, these 7 viral subspecies were selected due to them being the most common coronaviruses in humans belonging to the ssRNA(+) class. 12 For the SARS species, we also filtered by host to retrieve only human-targeted sequences. We believe this could make the model identify only viruses infecting humans, whereas those that infect animals might be misclassified during the machine learning prediction process.
Then, we proceeded to remove all sequences with more than 2 consecutive X amino-acids and with less than 31 non-X amino-acids. After that, we applied CD-HIT 13 to remove highly similar sequences within the data sets; leaving 1 078 667 sequences for phase 1 116 168 sequences for phase 2, and 288 255 sequences for phase 3 (Table 1).
Count of data points per class for all phases with their training and test sets data count.

For phase 1, there are no training and test set count for non-ssRNA(+) and non-viral classes independently because these groups were merged into 1 single class in order to become the negative data set for training and test.
For phase 4, to predict whether there is an interaction between a viral protein and a human protein, we collected experimentally proved human-virus interactions from multiple data sets14-17 and the following databases: UniProt, 11 going to the page for each known gene of the 3 viruses (Additional file 2: Tables S2 to S4) and getting all the interactions listed in the Interaction section; in VirusMentha, 18 going to the Download page and downloading the Coronaviridae file; IMEx, 19 searching the terms “cov2” for SARS-CoV2 filtering interactor species by “SARS-CoV-2” and “Homo sapiens,” “Human SARS coronavirus” for SARS-CoV filtering interactor species by “Human SARS coronavirus” and “Homo sapiens,” and “mers” for MERS filtering interactor species by “Middle East respiratory syndrome-related coronavirus (isolate United Kingdom/H123990006/2012) (Betacoronavirus England 1)” and “Homo sapiens”; BIOGRID, 20 searching each known gene of the 3 viruses (Additional file 2: Tables S2 to S4) and limiting the search by virus using the dropdown list; HPIDB,21,22 searching by the keywork “sars”; and HVIDB, 23 going to the search page and browsing Coronaviridae under the Single-Stranded RNA viruses class. We used a wide variety of sources, as described above, in order to collect the highest number of interactions available for predicting human-SARS-CoV/SARS-CoV-2/MERS interactions. In total, we collected 22 844 interactions data for SARS-CoV2, 3981 for SARS-CoV and 997 for MERS (Additional file 3: Table S8). These interactions were filtered by duplicate protein name or ID pairs, removed non–human-virus interactions, and we checked manually that the host was human. Finally, we filtered by duplicate amino-acid sequence pairs, which left us with 1337 interactions for SARS-CoV, 14 001 interactions for SARS-CoV-2, and 318 interactions for MERS-CoV (Additional file 3: Tables S5 to S8).
When predicting interactions, one of the difficult tasks is obtaining a negative data set. For our tool, we applied a dissimilarity-based negative sampling based on the method proposed by Eid et al, 24 which has multiple steps. First, we generated a fixed number of random interactions between the viral proteins found in the phase 4 data set and 26 573 human reviewed proteins found in the UniProtKB database which were not a positive interaction, and we got 204 000 interactions for SARS-CoV, 168 000 for SARS-CoV-2, and 144 000 for MERS-CoV. After this, the sequences were aligned using the Needleman-Wunsch algorithm and the BLOSUM30 matrix, which yields an alignment score for each of the interactions. Next, we removed the interactions with the best alignment scores from each virus (1500 from SARS-CoV, 15 000 from SARS-CoV-2, and 500 from MERS-CoV) and randomly chose a subset of interactions from each data set, which gave us the final negative data set with 2500 interactions from SARS-CoV, 25 000 from SARS-CoV-2, and 1000 from MERS-CoV (Table 1).
Feature extraction
Machine learning methods need all input data to have the same dimensions. This means that every protein or interaction must have the same number of features (or data length) before being passed to each one of the machine learning models. To solve this problem, there are multiple tools available such as iFeature, 25 iFeatureOmega, 26 iLearnPlus, 27 ProFeatX, 28 protr, 29 and Pfeature. 30 In this study, we encoded the proteins using 20 different algorithms found in the iFeature python package with the default configuration, and some combinations between them based on their performance by choosing the ones that yielded the best results for the models and joining them together. The 20 algorithms along with their respective number of features are presented in Table 2. Although the package contained more features, certain algorithms required all proteins to have the same length, such as position-specific scoring matrix (PSSM) or amino-acid index (AAINDEX). Others needed prior data preprocessing (e.g., secondary structure elements content [SSEC] and secondary structure elements binary [SSEB]). In addition, tripeptide composition (TPC) had too many features (8000) for the GPU memory to handle.
List of the iFeature descriptors used for encoding the proteins.

Training and testing sets
Table 1 shows that our data sets were overly unbalanced among classes. To address this issue, for the first 2 phases, we randomly picked the same number of samples from each of the majority classes as the minority class, so in phase 1, we truncated the number of data points from the non-ssRNA(+) and non-viral classes down to the same number of ssRNA(+) sequences, then joined both of ssRNA(+) and non-viral data sets as the negative data set, and in phase 2, we truncated the number of proteins from the non-Coronaviridae data set to match the number of Coronaviridae protein count. All the samples that were left out were then used for independent testing. From the picked samples, we used 90% of the data to train the models and 10% for independent testing, joining the previous samples (Figure 1A). Phases 3 and 4 were split 90% for the training set and 10% for the test set from the original data set. Table 1 also displays the count of data points per class per phase. All models were trained using 5-fold and 10-fold cross-validation.
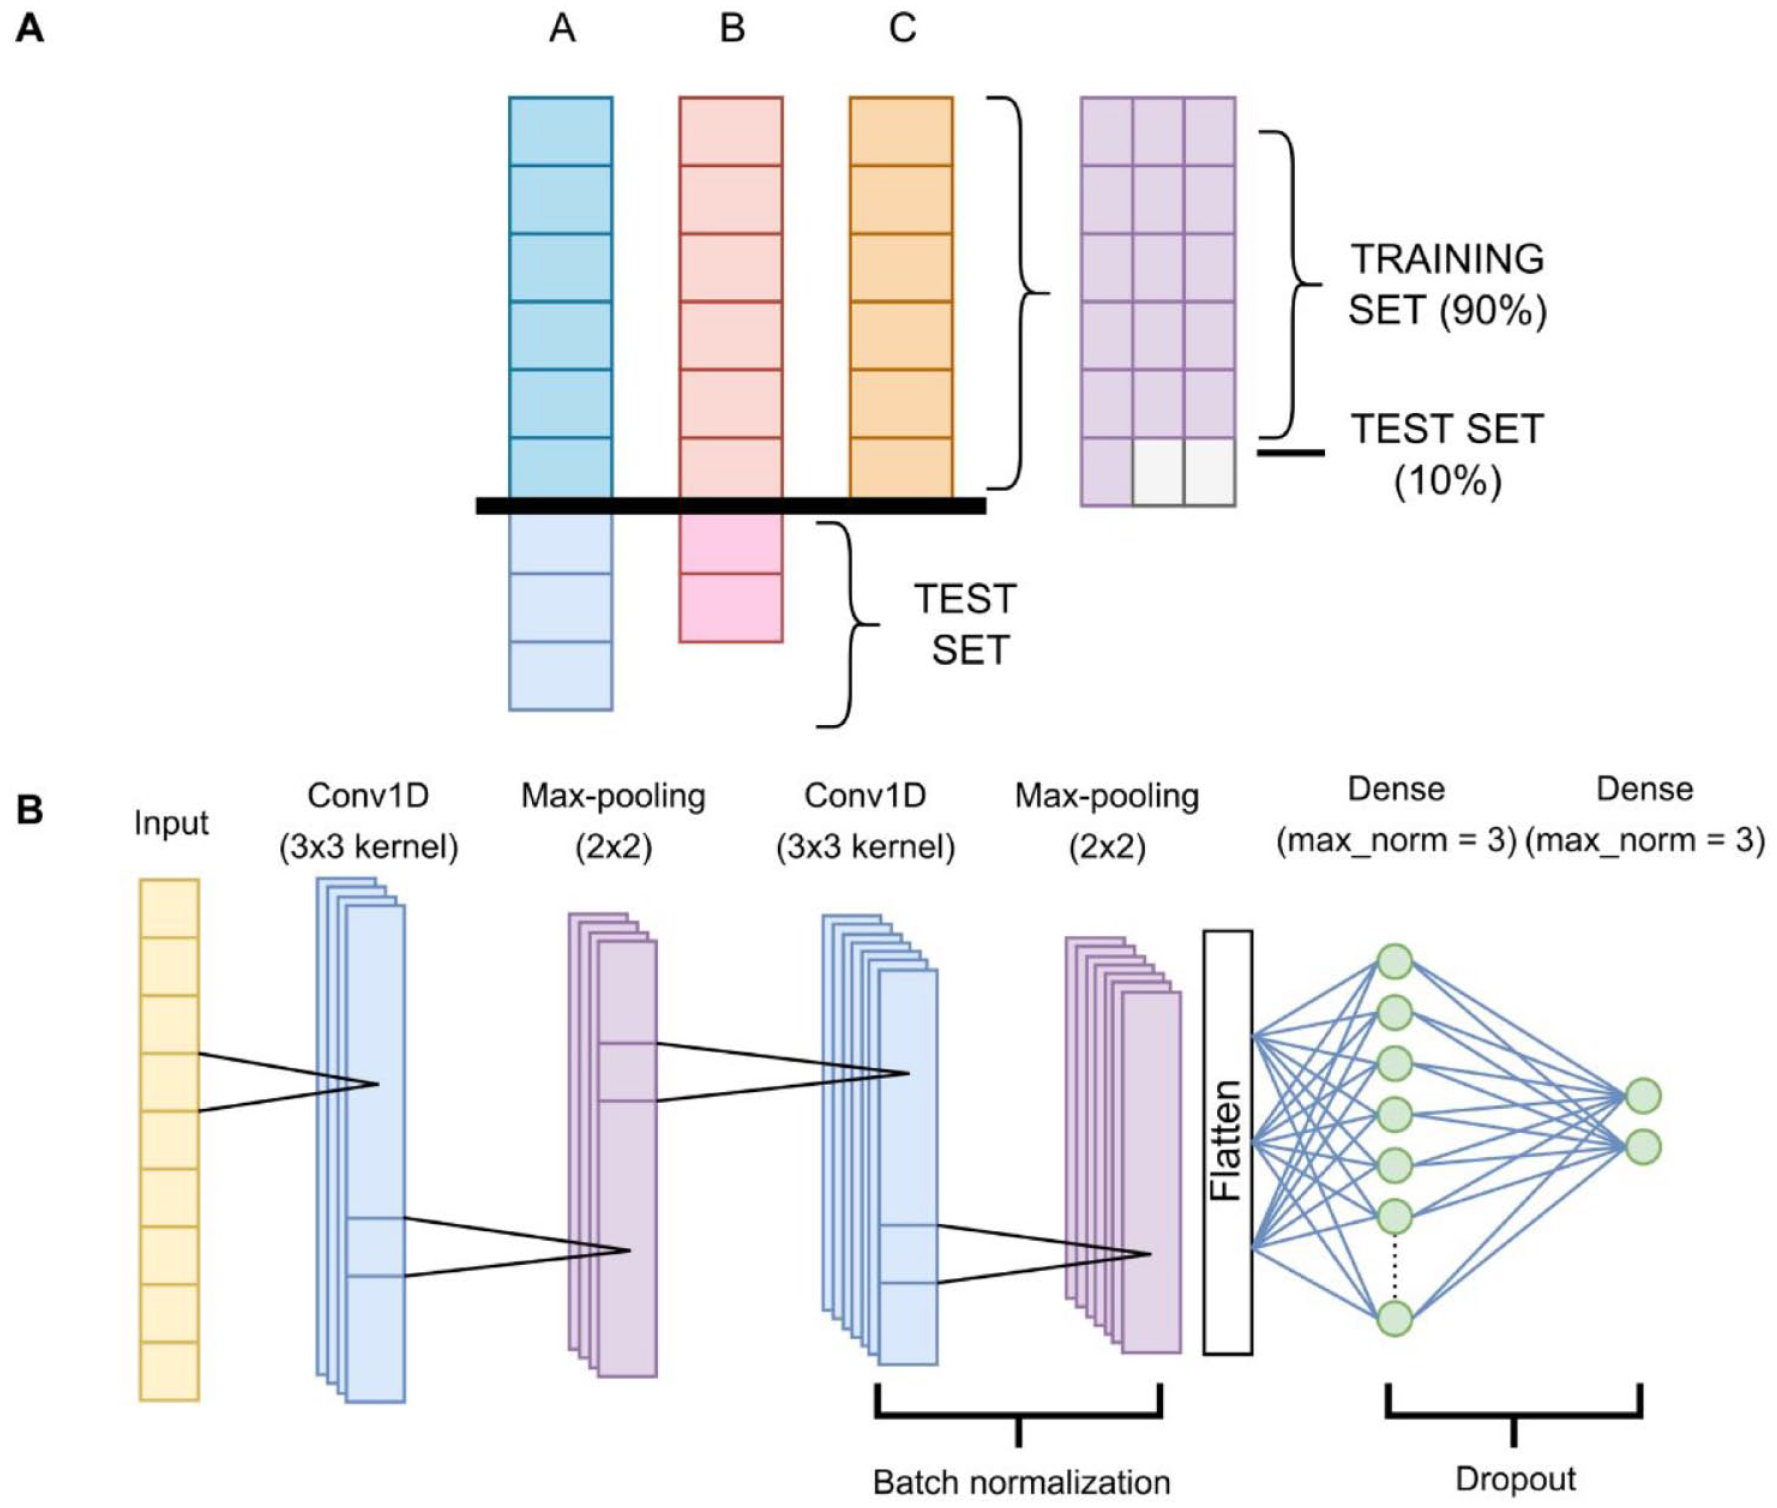
Training and test split, and neural network architecture. (A) A, B and C are the classes that the model will try to predict, A with size = 9, B with size = 8, and C with size = 6. As C is the smallest class, for building the training set, we take 6 random samples of each class, which would leave 3 samples from class A and 2 samples from class B out. This yields 18 data points. Here, we take 90% of those (16) for training the model, and 10% (2) for testing it. Added to these 2 test samples would be the 3 samples from class A and the 2 samples from class B that were left aside. (B) Diagram of the neural network for all phases. The first convolutional layer outputs 16 filters. The second convolutional layer outputs 32 filters. The first dense layer varies in number of neurons. The final layer has 2 neurons, except for phase 3, which has 3 neurons due to having 3 classes. All layers have an ReLU activation function and use a He initializer, except for the last one, which applies softmax and uses the default Tensorflow initializer.
Machine learning models
We developed a general CNN architecture depicted in Figure 1B for all 4 phases, which consists mainly of 2 convolutional 1-dimensional (1D) layers, 2 max-pooling layers, and 2 dense layers. Convolutional layers apply a filter to a subset of consecutive data in order to make certain features dominate over others, usually images. However, our data are not 2-dimensional (2D), but 1D, so we applied 1D convolutions instead of 2D convolutions. Max-pooling layers choose the maximum value from each patch of data and pass it to the next layer. Dense layers are linear layers that fully connect all neurons in it with the neurons of the previous layer and apply a mathematical function to every data point. Also, there is a batch normalization after the second convolutional layer, so it standardizes the data and prepares it for the dense layers, and a dropout layer between the dense layers, with the aim of dropping some neurons and reducing overfitting. Along with CNN, we trained an RF model for all phases as a baseline and candidate model.
Random forests were trained and tested with all 20 encodings, whereas the neural networks were not able to run GAAC encoding due to its low number of features (5), which caused the convolutions fail as a result of a minimum of features needed according to the convolution kernels and max-pooling dimensions; hence, we ran the training and testing with 19 encodings.
Benchmarking
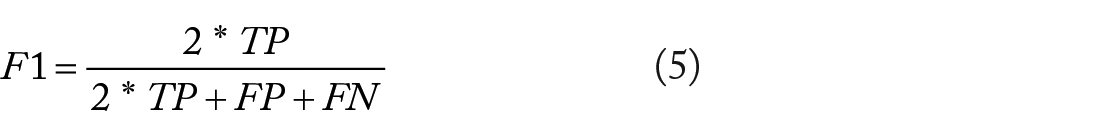
Owing to the imbalance of the testing data, we decided to use the MCC 31 as the primary score for the models, so we based our choices of the best models on this score. We also measured the SP, SN, ACC, and F1-score. These scores are calculated as equations (1) to (5) specified below. For phase 3, as it is a multiclass classification task, we got the 5 scores for each class and averaged them over the total count of samples using equation (6). After all the scores were gathered, we selected the fold with the best MCC score for the prediction for each combination of encoding and machine learning method (eg, CNN or RF)


Web server implementation
The Malivhu web server was developed in Python and the front end is built on the Django framework, whereas the backend is based on Python scripts that run on our HPC as SLURM jobs due to the time and resources submissions can take. The neural networks were trained using the Tensorflow 32 wrapper, Keras, 33 whereas the RF models were trained using the scikit-learn 34 Python library. For secondary structure prediction, we use PSIPRED. 35 For tertiary structure prediction, we use AlphaFold. 36 For displaying the tertiary structures, we use NGL Viewer. 37 For displaying the interaction network in phase 4, we use Cytoscape.js. 38
Workflow
The Malivhu workflow works on the previously described 4-phase process, with a previous preprocessing step which evaluates all sequences by their length, and if any sequence is shorter than 31, the whole process completely stops (Figure 2).

Workflow of the Malivhu backend. The user inputs a viral protein set and a human protein set. Viral proteins go through a preprocessing phase, which evaluates if all sequences are longer than 31 amino-acids. If not, the process is aborted. If they are, they go to phase 1, where Malivhu filters proteins from virus belonging to the ssRNA(+) class, discarding those proteins that do not pass the filter. Those that pass go to phase 2, where it filters viral proteins that belong to the Coronaviridae family, discarding those proteins that do not pass the filter. Coronaviridae proteins go to phase 3, where Malivhu filters those proteins that belong to the SARS or MERS species, again discarding those proteins that do not come from any of those species. These proteins go to phase 4 plus the human proteins, where it uses BLAST to find whether the SARS proteins belong to SARS-CoV or SARS-CoV-2. After the viral proteins are split in 3 groups (SARS-CoV, SARS-CoV-2, and MERS), they go to their respective machine learning model to predict their interactions with all human proteins.
Results
Phase 1—ssRNA(+) virus proteins vs other sources
After training and testing all encodings and some combinations for all the 4 main models, whereas composition of k-spaced amino acid pair (CKSAAP) performed the best for the CNN as a single encoding for both 5-fold and 10-fold cross-validation with 0.933 and 0.935, respectively, the winning CNN model was trained with 5-fold cross-validation using the dipeptide deviation from expected mean (DDE) + dipeptide composition (DPC) combination for the protein encodings, getting a 0.9742 MCC, whereas the one 10-fold cross-validation was close with 0.973 MCC. In contrast, the RF models did not perform well on this phase, getting at most 0.6731 MCC with 10-fold cross-validation using CKSAAP encoding (Table 3). The receiver operating characteristic (ROC) (Figure 3A) and precision-recall (PR) (Figure 4A) curves show that the area under the curve (AUC) is 1.0 for the training set, whereas for the independent test set, it is quite close to 1.0 (0.9964 and 0.9988, respectively), which indicates that the classifier doing a close to perfect distinction between ssRNA(+) proteins and other proteins.
Phase 1 independent-testing results between CNN and RF models with 5-fold and 10-fold cross-validations.
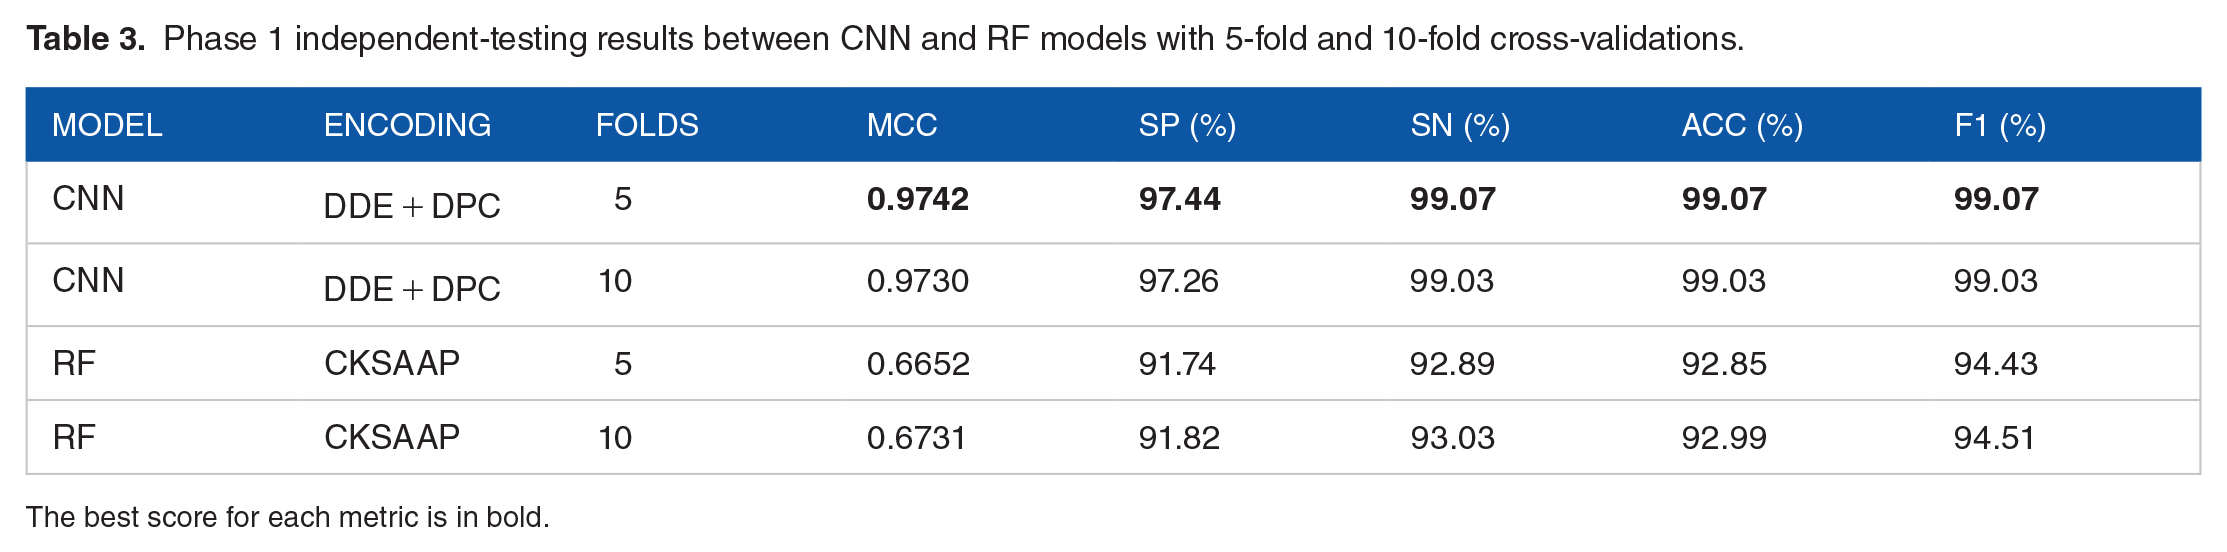
The best score for each metric is in bold.
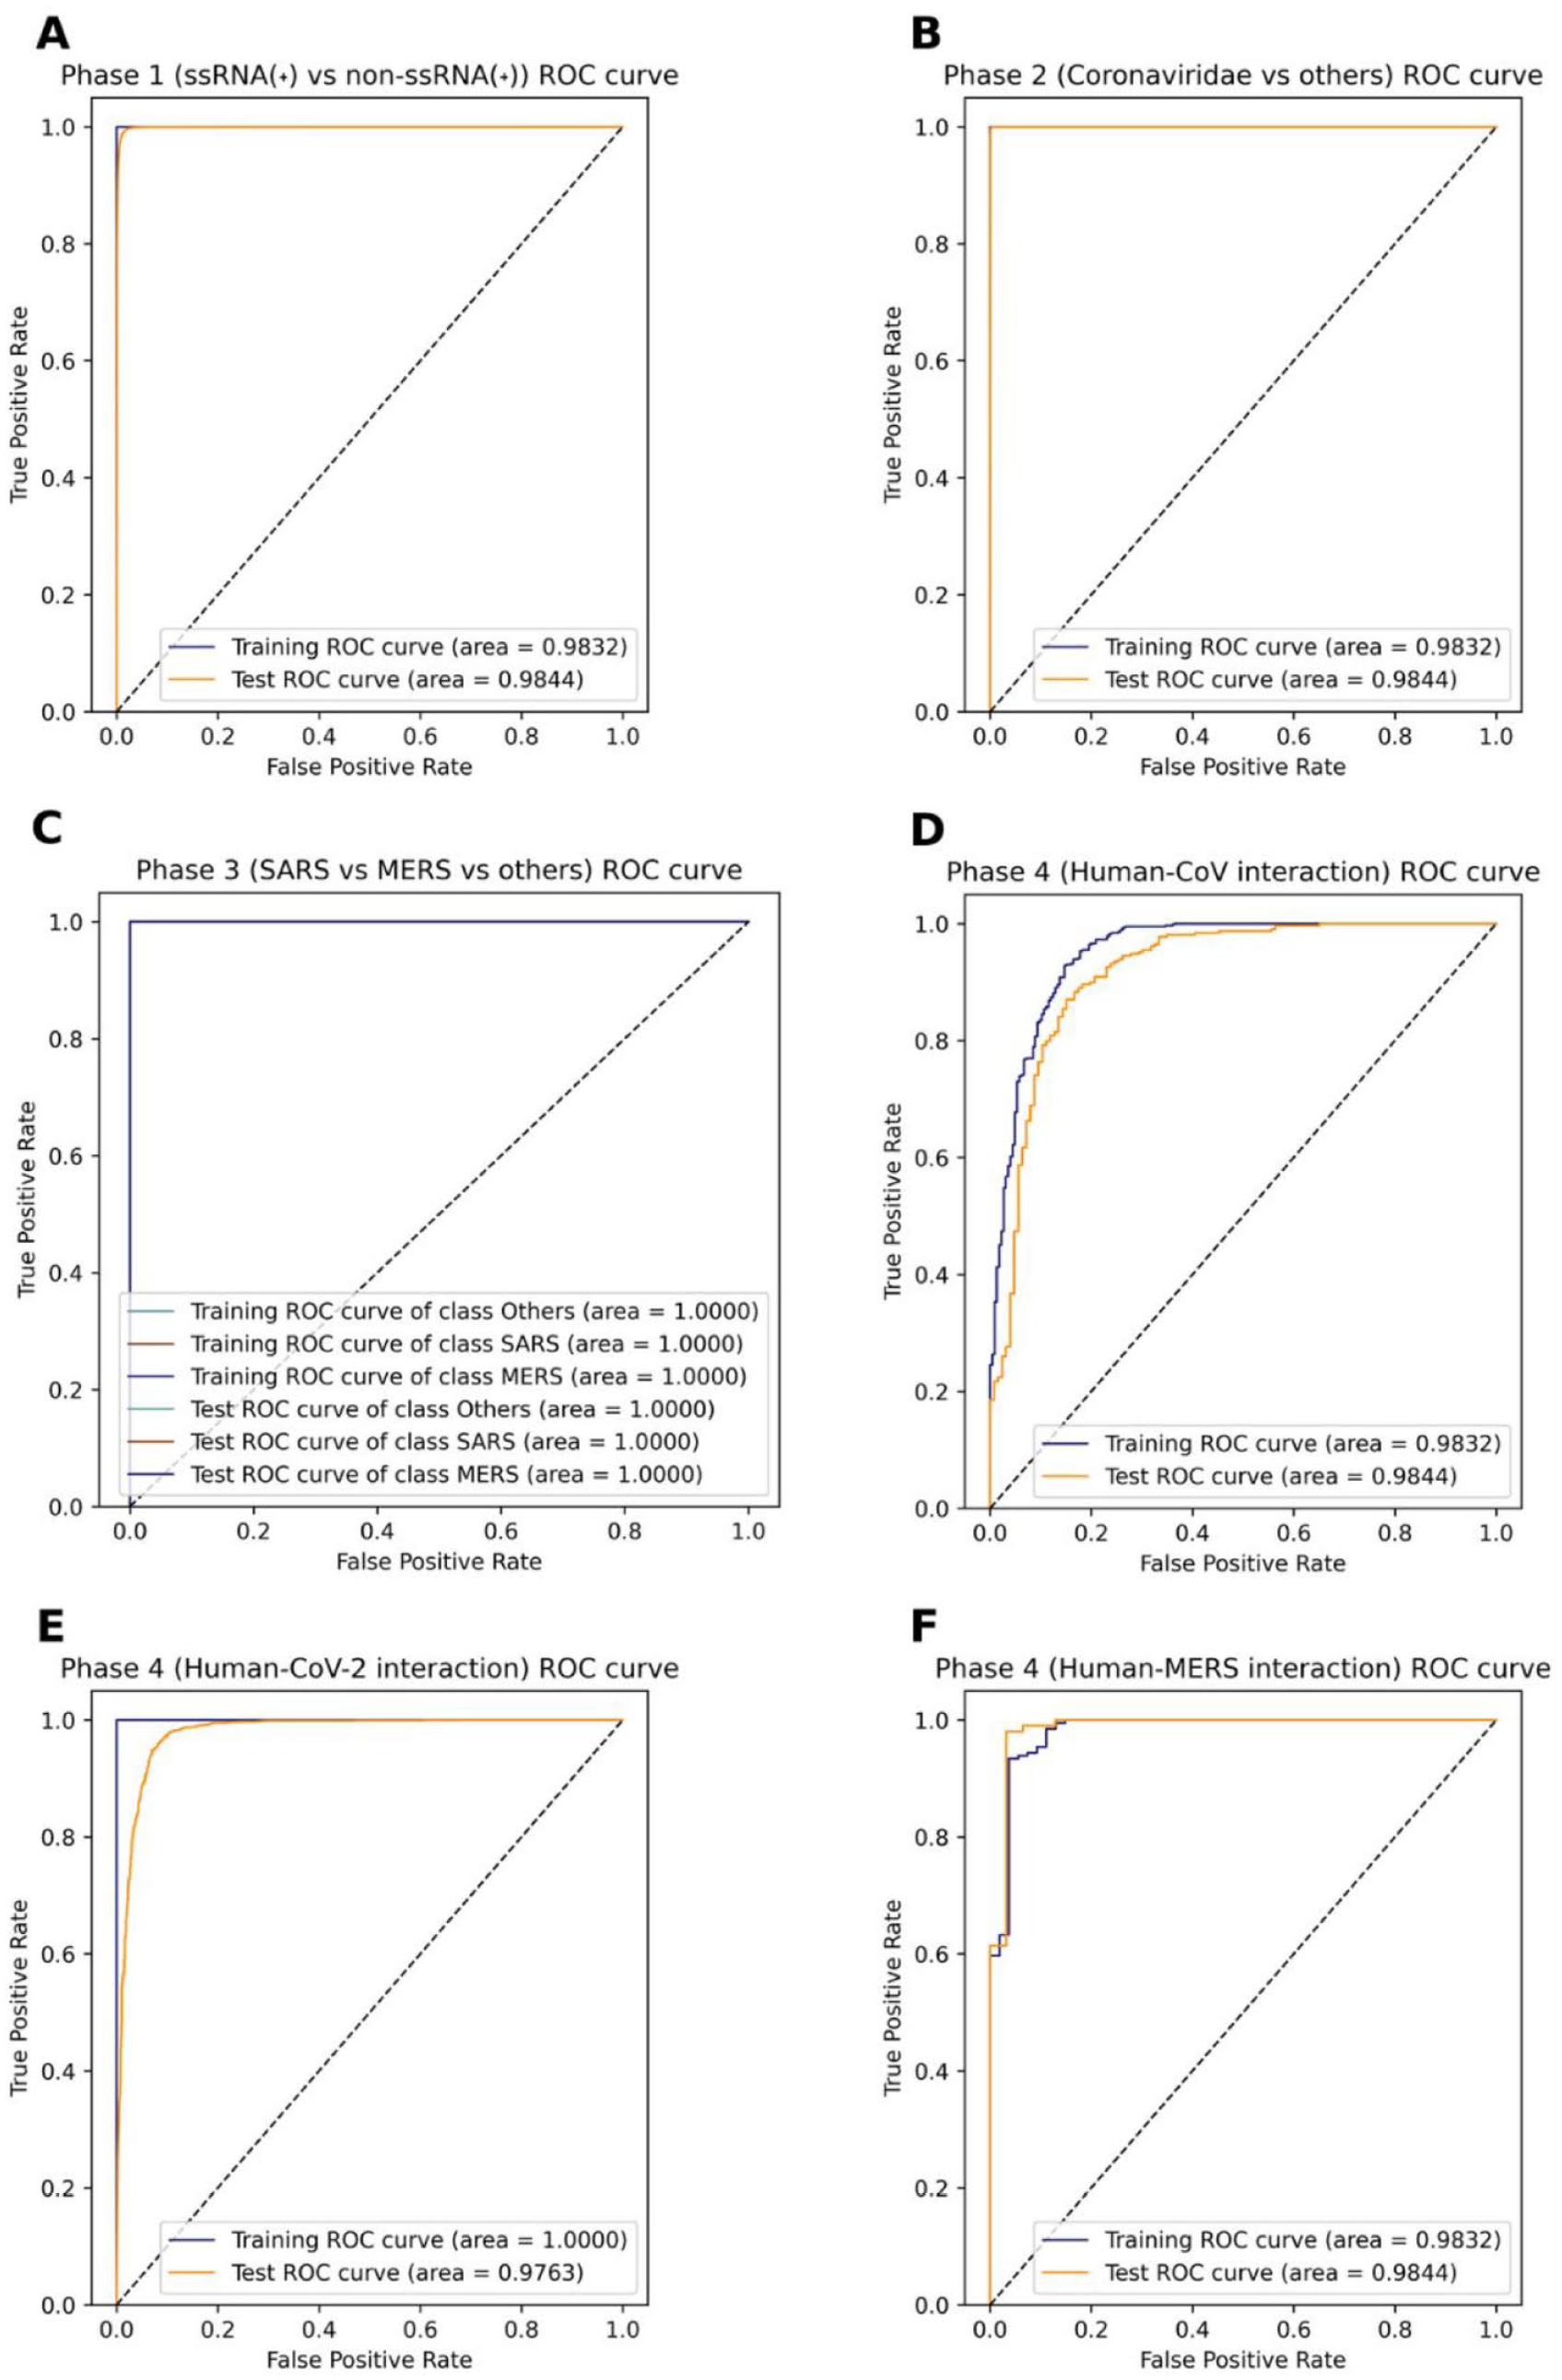
ROC curves for every phase. (A) ROC curve for phase 1, which filters ssRNA(+) proteins. (B) ROC curve for phase 2, which filters Coronaviridae proteins. (C) ROC curve for phase 3, which filters SARS and MERS proteins. This graph shows 6 labels in the legend due to the model being a multiclass predictor instead of a binary one, like other phases, but all lines followed the same behavior. (D) ROC curve for prediction of human-SARS proteins. (E) ROC curve for prediction of human-SARS2 proteins. (F) ROC curve for prediction of human-MERS proteins.

PR curves for every phase. (A) PR curve for phase 1, which filters ssRNA(+) proteins. (B) PR curve for phase 2, which filters Coronaviridae proteins. (C) PR curve for phase 3, which filters SARS and MERS proteins. This graph shows 6 labels in the legend due to the model being a multiclass predictor instead of a binary one, like other phases, but all lines followed the same behavior. (D) PR curve for prediction of human-SARS proteins. (E) PR curve for prediction of human-SARS2 proteins. (F) PR curve for prediction of human-MERS proteins.
Phase 2—Coronaviridae proteins vs other ssRNA(+) virus proteins
The results for phase 2 were incredibly close for all main models, and the scores were outstanding, with CKSAAP encoding yielding the best predictions for every model. Here, the RF models got more than 0.99 (or 99%) in all metrics, being the 10-fold model performing slightly better in the independent tests. Simultaneously, the CNN for both 5-fold and 10-fold cross-validations had the same score for MCC, SN, ACC, and F1, and SP was higher in the 5-fold model by just 0.01%, respectively. As MCC is the main criteria to choose a model, we picked the 5-fold cross-validation CNN model to be ran on Malivhu despite every single model having high scores (Table 4). Phase 2 presents almost perfect ROC (Figure 3B) and PR (Figure 4B) curves with an AUC of 1.0 for training set both PR and ROC, while getting 0.9997 for ROC and 0.9998 for PR for the independent test set, which shows that here the model comfortably distinguishes between Coronaviridae and non-Coronaviridae proteins.
Phase 2 independent-testing results between CNN and RF models with 5-fold and 10-fold cross-validations.

The best score for each metric is in bold.
Phase 3— severe acute respiratory syndrome and Middle East respiratory syndrome proteins vs other Coronaviridae proteins
Among all phases, the best scores were obtained by phase 3 (Table 5). Here, RF beat phase 2 CNN best MCC (0.9965), obtaining 0.9976 using Composition/Transition/Distribution (Composition) (CTDC) encoding and 5-fold cross-validation. However, the most astonishing result is the CNN getting 1.0 in every single score with 10-fold and 3 different encoding combinations for both training and testing phases. Owing to the perfect scores obtained by a basic encoding, we did not try any combinations (Additional file 4: Table S9). This indicates that both SARS and MERS species are easily identifiable among the Coronaviridae family. It is also remarkable how GAAC was one of the 2 best encodings for the 10-fold RF model while only having 5 features (Additional file 4: Table S9). Phase 3 generated perfect ROC (Figure 3C) and PR (Figure 4C) curves, having an AUC of 1.0 with both training and test sets, except for the non–SARS-MERS class PR curve, which had 0.9999. These results confirm what the metrics say about the impeccability of the model’s ability to predict each class.
Phase 3 independent-testing results between CNN and RF models with 5-fold and 10-fold cross-validations.

The best score for each metric is in bold.
Phase 4—interaction between human proteins and SARS-CoV, SARS-CoV-2, and Middle East respiratory syndrome proteins
For phase 4, we trained and tested the interactions for all 3 viruses separately (Additional file 4: Table S10), so each one has a different model. In general, the scores were not as good as the previous phases, especially the MCC and the SP, possibly caused by 3 reasons: data set imbalance, data set size (in the cases of SARS-CoV and MERS), and a small overfitting (in the case of the CNNs). For SARS-CoV, the RF models performed better than the CNN models, where the 10-fold model with Composition/Transition/Distribution (Distribution) (CTDD) encoding got the best results with an MCC of 0.8303, but the SN, ACC, and F1 score were over 93% (Table 6), whereas the RF model with 10-fold cross-validation achieved 0.8722 MCC and over 94% in SN, ACC, and F1 score. On the contrary, the ROC (Figure 3D) and PR (Figure 4D) curves show a more optimistic result, where all curves have an AUC of more than 0.95, which means that despite having a lower MCC, it still has a high degree of confidence when predicting the interactions.
Phase 4—SARS-CoV independent-testing results between CNN and RF models with 5-fold and 10-fold cross-validations.

The best score for each metric is in bold.
For SARS-CoV-2, the MCC and F1 were slightly better than in SARS-CoV, and the SP improved by more than 6 points, even though the SN and ACC decreased by 0.2%. For these interactions, the CNN models performed better than the RF models in all metrics using the CKSAAP encoding, having both 5-fold and 10-fold cross-validation models similar scores, where the MCC and SP were 0.886 and 93.06% for 5-fold cross-validation, respectively (Table 7). Here, the ROC and PR curves show that the model perfectly adjusts to the training set, while it still somewhat struggles with the test data set, but still has high AUC values of 0.9763 for ROC (Figure 3E) and 0.9815 for PR (Figure 4E) for independent tests.
Phase 4—SARS-CoV-2 independent-testing results between CNN and RF models with 5-fold and 10-fold cross-validations.

The best score for each metric is in bold.
Interestingly enough, even if it had the smallest data set, MERS was the virus species in phase 4 which had the best scores. Nonetheless, probably due to the data set size, the RF models had the best scores, except for SP. In this case, the RF with 10-fold cross-validation achieved the highest MCC (0.9153), followed by the RF with 5-fold cross-validation, which had an MCC of 0.8940, both higher than the one achieved by both CNN. In addition, the 10-fold RF model has 3 possible encodings, but for simplicity, we chose pseudo-amino acid composition (PAAC) as the encoding for Malivhu (Table 8). On the same line as the other phase 4 viruses, the PR (Figure 3F) and ROC (Figure 4F) curves had an AUC above 0.97, showing that the model predicts with a high degree of certainty notwithstanding the small data set.
Phase 4—MERS independent-testing results between CNN and RF models with 5-fold and 10-fold cross-validations.
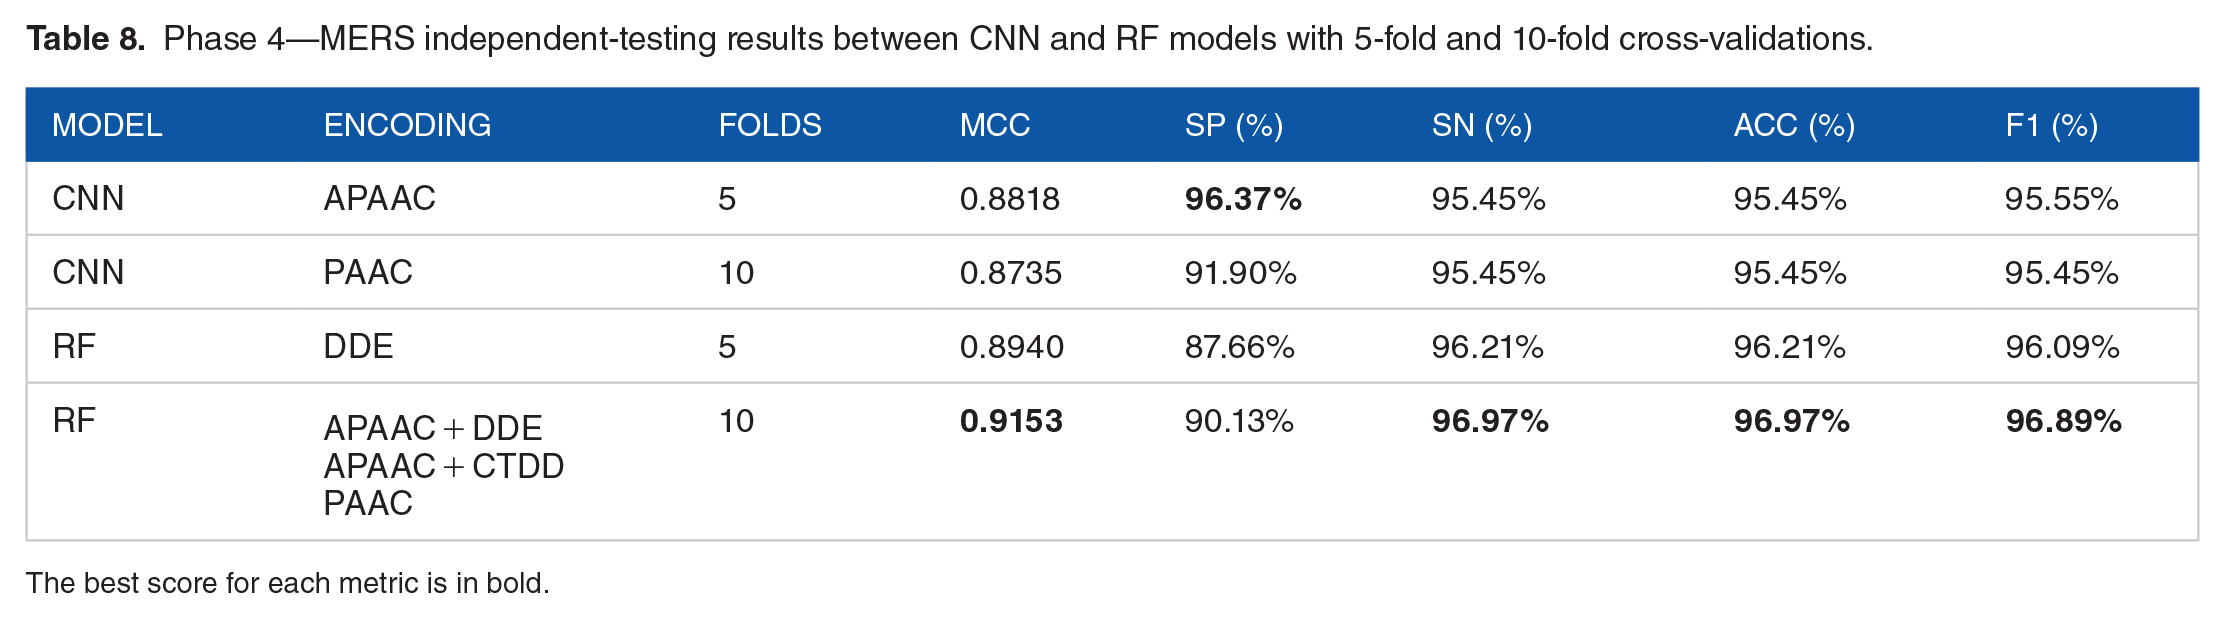
The best score for each metric is in bold.
Comparison with other human-virus protein-protein interaction prediction tools
We compared the Malivhu performance against 2 human-virus PPI prediction tools that also use machine learning, namely HVPPI 39 and LSTM-PHV. 40 As LSTM-PHV web server only allows sequences up to 1000 amino-acids long, we removed from our phase 4 test sets those interactions that contained sequences longer than this limit. After this filtering, the SARS-CoV data set was left with 117 interactions, the SARS-CoV-2 data set with 1618, and the MERS data set with 38 (Table 9).
Phase 4 data set for comparison with other human-virus PPI prediction tools.

The tests show that Malivhu got accuracies over 90% for all 3 viruses, resulting in 94.87% for SARS-CoV, 95.92% for SARS-CoV-2, and 92.11% for MERS. HVPPI obtained 42.74% for SARS-CoV, 41.78% for SARS-CoV-2, and 31.58% for MERS. Finally, LSTM-PHV got 66.67% for SARS-CoV, 63.84% for SARS-CoV-2, and 57.89% for MERS (Table 10).
Phase 4 accuracy prediction with Malivhu, HVPPI, and LSTM-PHV.

Web server
Malivhu can run up to its 4 phases sequentially, or the users can choose to skip the first 3 phases and run only phase 4 specifying the strain that the viral proteins come from. For phases 2 and 3, previous phases must be run too. All sequences must have, at least, 31 amino-acids and they must be in a valid FASTA format. The user can also input their e-mail, so the server can send a notification when it finishes predicting the selected phases.
The results page displays the score for each prediction in each phase for every protein and PPI. The user can predict the secondary and tertiary structure of the proteins in phases 1 to 3, and the secondary structure of proteins in phase 4. The secondary structure will be displayed in PSIPRED format, whereas the tertiary structure can be viewed as a 3-dimensional (3D) model and downloaded as a PDB file or an image. If the phase 4 was executed, the resulting table shows that each human protein contains the symbol name, gene tissue expression (GTEx), gene ontology (GO), KEGG, subcellular location information, given that these entries have a UniProt ID or Swiss-Prot ID in their names, and an mass spectometry interaction statistics (MiST) score for experimentally verified interactions found in Gordon et al. 15 Along with this, the user can view the interactions network between the viral and human proteins interactively and will be able to download the image and the network JSON, and the nodes (or proteins) in the network contain links to UniProt and NCBI, whenever available according to the entry name, and also a prediction of all submitted human proteins against all popular proteins belonging to SARS-CoV, SARS-CoV-2, and MERS. Each node in these networks is linked to NCBI and UniProt, depending on whether they are found in these or not.
Discussion
In this study, we demonstrate significant differences between ssRNA(+) viral proteins and other proteins, as well as the ease of identifying Coronaviridae proteins. In addition, we show that proteins from SARS and MERS exhibit distinct characteristics compared with other Coronaviridae species. These findings suggest that the protein divergence within the SARS/MERS viruses is substantial enough to classify them into separate groups from other viral proteins. Furthermore, our benchmarks indicate an increase in the classification difficulty when predicting interactions between proteins from different species compared with distinguishing the origin of a protein. Despite this challenge, Malivhu significantly outperforms other tools, likely attributed to having a specific model for each virus rather than a general model for any virus. Even without the need to predict interactions, Malivhu serves as a reliable tool for verifying the classification of viral proteins.
Protein-protein interaction prediction worked better with RF than CNN for human-SARS-CoV and human-MERS, and, while human-SARS-CoV-2 PPI prediction could use some more work, the results were satisfactory when looking at the ACC, ROC AUC, and PR AUC values. Nonetheless, there is already a big enough data set to improve the results with a better model; hence, we should be able to raise the prediction power. This can be achieved not only using standard convolutional networks but also using other novel architectures, layers, and techniques like transformers or residual neural networks for raw amino acid sequences due to their sequential nature, while training with linear layers other descriptors, combining the output of those layers into 1 vector and pass it to a final set of layers. With new deep learning methods based on transformers being developed for natural language processing, such as XLNet, 41 BERT, 42 or UniLM, 43 and scientists applying transformer and attention-based deep learning models for drug-target interactions prediction,44,45 compound-target interactions prediction,46,47 and PPIs prediction,48,49 highlighting PRoBERTa, a PPI predictor reporting up to 99% accuracy, it might be worth testing these architectures. This, in addition to applying dimensionality reduction to the encoded proteins, so the models have to compute less variables and achieve convergence with more ease, and using more encoding combinations that do not only mix high-scoring representations but also separate approaches that can depict different perspectives of a protein, which by themselves might not yield a good prediction, but when complemented with other encodings that contain unrelated attributes, it can show a full picture of the protein and further help the model to make more accurate classifications.
In addition, we establish evidence of how different encodings and combinations can work for different situations, making them situational, so there is no best encoding for every model, even though generally the CKSAAP encoding seems to be excellent when there is a large amount of data, albeit not so much for RF models with a small data set (Additional file 4: Tables S9 to S14).
Malivhu can grow its prediction capabilities by not only including SARS and MERS viruses, but other viral species too, focusing on viruses that affect humans. However, this also requires more interactions found in the laboratories to increase the data set size due to the dependence of deep learning models on the training data size, 50 and therefore, the ability for the model to learn. Following this reasoning, the next step might be including well-studied viruses like the ones that cause hepatitis, the herpesviruses, or the ever-changing influenza, all following the same 4-phase procedure. Nevertheless, the main priority remains on enhancing the existing phase 4 models.
Applications of Malivhu
Since its inception, the main objective for Malivhu was to predict human-virus interactions, especially SARS and MERS. Thus, whenever a person wants to verify if a certain set of viral proteins from those species interact with a set of human proteins, they can input their FASTA files and get the probabilities of interaction, so they can proceed to perform experiments to confirm if the positive interactions are true. Computational predictions are exceptionally useful for scientists, so they do not spend time and resources testing interactions that otherwise, with a tool like Malivhu, would have been discarded immediately.
Despite being a tool that was mainly for predicting interactions, its first 3 phases can also be helpful for finding out whether a set of proteins belong to a ssRNA(+), Coronaviridae, or SARS or MERS. Considering that these phases were trained with, not only whole proteins but also fragments of these, the utility it provides increases greatly, allowing researchers to input their incomplete and unconfirmed sequences to see whether they belong to any of these groups or not. Moreover, Malivhu also lets the user predict the secondary structure and download the PSIPRED file for all proteins, as well as letting them predict the tertiary structure, plus being able to view these structures and download the files for further applications.
Supplemental Material
sj-xlsx-1-bbi-10.1177_11779322241263671 – Supplemental material for Malivhu: A Comprehensive Bioinformatics Resource for Filtering SARS and MERS Virus Proteins by Their Classification, Family and Species, and Prediction of Their Interactions Against Human Proteins
Supplemental material, sj-xlsx-1-bbi-10.1177_11779322241263671 for Malivhu: A Comprehensive Bioinformatics Resource for Filtering SARS and MERS Virus Proteins by Their Classification, Family and Species, and Prediction of Their Interactions Against Human Proteins by David Guevara-Barrientos and Rakesh Kaundal in Bioinformatics and Biology Insights
Supplemental Material
sj-xlsx-2-bbi-10.1177_11779322241263671 – Supplemental material for Malivhu: A Comprehensive Bioinformatics Resource for Filtering SARS and MERS Virus Proteins by Their Classification, Family and Species, and Prediction of Their Interactions Against Human Proteins
Supplemental material, sj-xlsx-2-bbi-10.1177_11779322241263671 for Malivhu: A Comprehensive Bioinformatics Resource for Filtering SARS and MERS Virus Proteins by Their Classification, Family and Species, and Prediction of Their Interactions Against Human Proteins by David Guevara-Barrientos and Rakesh Kaundal in Bioinformatics and Biology Insights
Supplemental Material
sj-xlsx-3-bbi-10.1177_11779322241263671 – Supplemental material for Malivhu: A Comprehensive Bioinformatics Resource for Filtering SARS and MERS Virus Proteins by Their Classification, Family and Species, and Prediction of Their Interactions Against Human Proteins
Supplemental material, sj-xlsx-3-bbi-10.1177_11779322241263671 for Malivhu: A Comprehensive Bioinformatics Resource for Filtering SARS and MERS Virus Proteins by Their Classification, Family and Species, and Prediction of Their Interactions Against Human Proteins by David Guevara-Barrientos and Rakesh Kaundal in Bioinformatics and Biology Insights
Supplemental Material
sj-xlsx-4-bbi-10.1177_11779322241263671 – Supplemental material for Malivhu: A Comprehensive Bioinformatics Resource for Filtering SARS and MERS Virus Proteins by Their Classification, Family and Species, and Prediction of Their Interactions Against Human Proteins
Supplemental material, sj-xlsx-4-bbi-10.1177_11779322241263671 for Malivhu: A Comprehensive Bioinformatics Resource for Filtering SARS and MERS Virus Proteins by Their Classification, Family and Species, and Prediction of Their Interactions Against Human Proteins by David Guevara-Barrientos and Rakesh Kaundal in Bioinformatics and Biology Insights
Footnotes
Acknowledgements
The authors acknowledge the help and support from the members of the KAABiL lab (![]() ), especially to Naveen Duhan for their valuable input and suggestions to improve Malivhu. The authors also thank Shelby McCowan (Bioinformatics System Administrator) for helping to maintain and install the tools needed on an HPC cluster.
), especially to Naveen Duhan for their valuable input and suggestions to improve Malivhu. The authors also thank Shelby McCowan (Bioinformatics System Administrator) for helping to maintain and install the tools needed on an HPC cluster.
Author Contributions
David Guevara-Barrientos: Methodology, investigation, writing—original draft preparation, review and editing, visualization.
Rakesh Kaundal: Conceptualization, supervision, project administration, writing—review and editing.
Availability of Data and Materials
The data sets supporting the results of this article are available in the Malivhu repository, https://kaabil.net/malivhu/datasets/. Malivhu is under MIT license and is publicly available on GitHub (https://github.com/usubioinfo/malivhuweb), and the version used in this study is available at Zenodo (DOI: 10.5281/zenodo.6510493). The instructions on how to use Malivhu are available at ![]() .
.
Declaration of conflicting interests
The author(s) declared no potential conflicts of interest with respect to the research, authorship, and/or publication of this article.
Funding
The author(s) disclosed receipt of the following financial support for the research, authorship, and/or publication of this article: The authors acknowledge the support to this study from the faculty start-up funds to RK from the Center for Integrated BioSystems (CIB)/Department of Plants, Soils, and Climate, USU. This research was partially supported by Utah Agricultural Experiment Station (UAES), and approved as journal paper number 9813. The funding body did not play any role in the design of this study; the collection, analysis, or interpretation of data; or in the writing of this manuscript.
Supplemental Material
Supplemental material for this article is available online.
References
Supplementary Material
Please find the following supplemental material available below.
For Open Access articles published under a Creative Commons License, all supplemental material carries the same license as the article it is associated with.
For non-Open Access articles published, all supplemental material carries a non-exclusive license, and permission requests for re-use of supplemental material or any part of supplemental material shall be sent directly to the copyright owner as specified in the copyright notice associated with the article.