
Abstract
The Parkinson disease (PD) is the second most common neurodegenerative disorder affecting the central nervous system and motor functions. The biological complexity of PD is yet to reveal potential targets for intervention or to slow the disease severity. Therefore, this study aimed to compare the fidelity of blood to substantia nigra (SN) tissue gene expression from PD patients to provide a systematic approach to predict role of the key genes of PD pathobiology. Differentially expressed genes (DEGs) from multiple microarray data sets of PD blood and SN tissue from GEO database are identified. Using the theoretical network approach and variety of bioinformatic tools, we prioritized the key genes from DEGs. A total of 540 and 1024 DEGs were identified in blood and SN tissue samples, respectively. Functional pathways closely related to PD such as ERK1 and ERK2 cascades, mitogen-activated protein kinase (MAPK) signaling, Wnt, nuclear factor-κB (NF-κB), and PI3K-Akt signaling were observed by enrichment analysis. Expression patterns of 13 DEGs were similar in both blood and SN tissues. Comprehensive network topological analysis and gene regulatory networks identified additional 10 DEGs functionally connected with molecular mechanisms of PD through the mammalian target of rapamycin (mTOR), autophagy, and AMP-activated protein kinase (AMPK) signaling pathways. Potential drug molecules were identified by chemical-protein network and drug prediction analysis. These potential candidates can be further validated in vitro/in vivo to be used as biomarkers and/or novel drug targets for the PD pathology and/or to arrest or delay the neurodegeneration over the years, respectively.
Introduction
The Parkinson disease (PD) is the world’s second most common neurodegenerative disorder that mainly affects motor functions. Lack of dopamine due to the death of dopamine-producing cells in substantia nigra pars compacta (SNpc) of the midbrain is the major trigger of PD pathology. However, Tanner and Goldman 1 precise disease etiology is still relatively unclear. 2 PD clinical symptoms, age of onset, and progression from mild to severe form are slow in most cases, making the PD challenging to diagnose, particularly in early stages. Furthermore, PD clinical symptoms differ from person to person and may overlap with other neurological conditions in many cases. The 4 standard clinical motor features—tremor, muscle rigidity, bradykinesia (slowing down of spontaneous and automatic movements), and postural instability—are still widely used to diagnose PD. 3 In advanced stages of PD, clinical features like dementia, difficulty in swallowing, chewing, speaking, fatigue, emotional changes, and urinary and sleeping problems become common. 4 PD occurs more commonly in men than females in an estimated ratio of 3:2; however, PD is most often diagnosed in individuals above the age of 60 years. Early-onset PD, also known as young-onset PD, is seen in people with symptomatic manifestation before 50 years. The median life expectancy following the diagnosis is 7 to 15 years. 1
Most PD is sporadic; however, several cases of early-onset familial PD are reported in many countries. For monogenic PD, although identifying associated genetic variants does not affect the choice of therapy, genetic testing is available for several variants. Genetic testing is available for leucine-rich repeat kinase 2 (LRRK2), parkin (PRKN), Parkinsonism-associated deglycase (DJ-1 or PARK7), synuclein alpha (SNCA), and PTEN-induced putative kinase 1 (PINK1). Overexpression in α-synuclein inhibits mitochondrial complex I on dopamine-producing cells. 5 The α-synuclein aggregates in Lewy bodies accumulate in the SN and the brain’s necrotic regions. 6 Deficiency of mitochondrial complex I is also common in this part of the brain.
In addition, loss of function mutations in PARK2 and PINK1 are associated with mitochondrial dysfunction. The LRRK2 mutations abnormally up-regulate the kinase activity, triggering the dysregulation of downstream mitogen-activated protein kinase (MAPK) signaling, and leading to dopamine loss in the neuronal cells of the brain regions. It also contributes to the abnormal regulation of aggregation of α-synuclein. 7 LRRK2 has been the focus of clinical trials aiming to develop therapies for particular genetic forms of PD. Current guidelines still do not recommend genetic testing in routine clinical practice; however, this may change in the future.
No standard disease-modifying cure for PD is currently available. Therefore, main therapeutic strategies focus on disease-related symptoms and disease progression. 8 PD medications focus on increasing dopaminergic neurotransmission and reducing the functional discomfort to provide relief from the symptoms. 9 In cases where medicines fail to show a positive response, deep brain stimulation (DBS) surgery is an alternative option. 10
Despite the implemented noticeable progress in the treatment for of PD, biomarker identification for early diagnosis and elucidation of the precise molecular mechanism of the disease remains the biggest challenge, which requires unconventional methods and tools to look at multi-dimensional data. Several biomarker techniques are emerging as potential diagnostic tests for PD and other related pathologies. The 2 most explored techniques are skin biopsy that uses immunofluorescence to measure phosphorylated alpha-synuclein within skin nerve fibers, and the other technique is real-time quaking-induced conversion (RT-QuIC) assay that detects abnormal clusters of alpha-synuclein in the skin, cerebrospinal fluid (CSF), and/or blood. Although they exhibit high sensitivity and specificity, unfortunately, these tests lack the ability to distinguish between PD and other synucleinopathies and are not yet recommended as a clinical diagnostic tool.
Gene expression microarray data in PD have been used for biomarker identification, drug repurposing, and novel drug target identification in the recent past.11,12 Examining gene expression changes in PD individuals compared with healthy controls could highlight the pathophysiology process leading to dysfunction and identify expression signature for the disease. 13 In addition to the brain tissue, the association between the pathology of disease and gene expression can also be explored in the blood. Aiming to develop novel biomarkers for PD, several studies suggested the use of expression analysis in blood.14-16 Blood-based PD new biomarkers are a promising non-invasive and simple alternative to complicated brain tissue biopsy or costly magnetic resonance imaging (MRI)/computed tomography (CT) scans. However, understanding the genetic architecture and the functional role of PD pathogenesis remains a challenge as well, due to polygenic inheritance and contributions of unknown environmental factors. In this study, we propose to compare the fidelity of blood to SN tissue gene expression data from PD patients to provide a systematic approach to predict the key genes of PD and regulatory pathways to understand their functions and interactions in pathogenesis.
Method
Microarray data sets’ collection and pre-processing
Raw blood and SN tissue gene expression microarray data from PD patients and healthy controls were downloaded from the Genome Expression Omnibus (GEO) database. The blood data sets include GSE22491, GSE6613, GSE54536, and GSE72267 and SN tissue data sets include GSE20163, GSE20164, GSE7621, GSE20141, and GSE49036. Each set includes at least 10 samples. Details are shown in Supplementary Table S1. The robust multi-array average (RMA) in R-affy and Lumi packages were used to perform the background data correction and normalization of expression of genes. The RMA technique was chosen over other packages due to its power to detect small differential change, stable variance on a log scale, and minimize false-positive results. Similarly, we have used the Bioconductor Package (Lumi pipeline) exclusively built for the Illumina microarray platform (BeadChip).17-20
Identification of differentially expressed genes
To investigate differentially expressed genes (DEGs) in each GEO data set, we used the linear model for microarray analysis (LIMMA) package in R.
21
We applied the Empirical Bayes method to reduce the standard errors. Simple t-test, moderate t-test, and f-test were calculated for steady and reproducible results. The limma package was used to determine the DEGs between PD individuals and healthy controls. Differentially expressed genes are characterized as genes with P < 0.05,
Meta-analysis of DEGs of gene expression data sets
The meta-analysis of the pre-processed gene expression data sets was performed with the metaMA package 22 and limma package 21 in R. The combined probability test method of Fisher and false discovery rate (FDR) adjustment using the multiple testing correction method of Benjamini and Hochberg (BH) 23 were applied to reduce the background noise. Meta-analysis was conducted separately for blood and SN tissue data sets (Supplementary Table S1). Bayesian Regularized Correlation Weighting (BRCW) was used to screen for common DEGs in at least 2 gene expression profile data sets (http://jura.wi.mit.edu/bioc/tools/compare.php, accessed on September 30, 2021).
DEGs functional and pathway enrichment analysis
Functional annotation such as biological process (BP), molecular function (MF), and cellular component (CC), and Kyoto Encyclopedia of Genes and Genomes (KEGG) pathway analysis were performed using the Database for Annotation Visualization and Integrated Discovery (David v.6.8). 24 Functional annotations and pathways with a P-value < .05 were considered significantly enriched. Data visualizing were done using ggplot2—an open-source data visualization package in R. 25
Construction of a protein-protein interaction network
We adopted the simple concept of 1 gene to 1 protein and developed the DEGs protein-protein interaction (PPI) network. The PPI network was constructed using the STRING database v.11.5, accessed on December 14, 2021. 26 Network visualization and analysis were done in Cytoscape software 3.9.
Topological properties of the PPI network
Topological analysis helps to understand a network structure, relevant substructures, and mechanisms. The topological characteristics of the PPI network of DEGs are defined by measurements of degree distribution (P(k)), clustering coefficient (c(k)), neighborhood connectivity (CN(k)) and centrality betweenness (
Identification of key genes
Centrality measurements mentioned above can characterize the most influencing genes in a complex PPI network, which are capable of fast information propagation, reception, and sensitivity to the local and global perturbations. It can also be used as a method to identify critical key genes. Centrality parameters were computed using Cytoscape plugins, including cytoHubba, 29 Network Analyzer, 27 and CytoNCA. 28
Mapping synaptic location and function of DEGs
To refine identified terms from Gene Ontology (GO) and validate the relevance of identified DEGs in the neuronal processes, Synaptic Gene Ontologies database (SynGO) (https://syngoportal.org, accessed on January 5, 2022), an evidence-based, expert-curated knowledge for synapse biology, was used. 30 We mapped DEGs from blood and SN tissues with brain-expressed genes as background in SynGO. SynGO annotations comprise CC and BP domains. Gene Ontology and pathway enrichment analysis of overlapping genes in the SynGO database were performed with Metascape (https://metascape.org/, accessed on January 5, 2022). 31
Druggability analysis
We used key genes shared between blood and SN tissues to build chemical-protein interaction network using the Comparative Toxicogenomics Database (CTD) with Network Analyst to generate networks, which were then filtered based on a degree value of 10. 32 The resulting filtered networks were visualized using Cytoscape. Potential pharmacologic target has been analyzed by the web-utility L1000FDW 1000 (https://maayanlab.cloud/L1000FWD, accessed on February 17, 2022). 33 The criterion of having a q-value less than 0.05 was used to select the significant drugs in this study. The results included the top 5 drugs that have already been marketed. The detailed workflow is shown in Figure 1.

Schematic workflow of the study. DEGs indicate differentially expressed genes; GEO, Genome Expression Omnibus; PD, Parkinson disease; PPI, protein-protein interaction.
Result
Identification of differentially expressed genes
Based on the inclusion and exclusion criteria specified in the methods section, 9 microarray mRNA data sets with 161 blood samples with GEO accession numbers GSE22491, GSE6613, GSE54536, and GSE72267 and 99 SN tissue samples with accession numbers GSE20163, GSE20164, GSE7621, GSE20141, and GSE49036 of PD patients and healthy controls (Supplementary Table S1) were selected for this analysis. After applying the statistical threshold of P < .05,

(A) Venn diagram shows the number of common DEGs among blood and SN tissue. (B) Intersection of the up- and down-regulated gene lists from blood and SN tissue data sets. Seven genes are up-regulated, and 6 are down-regulated in both blood and SN tissues. DEGs indicate differentially expressed genes; SN, substantia nigra.
Functional and pathway enrichment analysis
For deeper insights into biology of the disease, we independently conducted a comprehensive functional annotations (GO) and pathways (KEGG) enrichment of DEGs of blood and SN (Supplementary File 2). The significant enrichment of up- and down-regulated DEGs is depicted in Figure 3 for blood and SN tissue, respectively. Down-regulated genes were enriched in few BPs in the blood, including nucleotide-binding oligomerization, domain-containing signaling, extrinsic apoptotic signaling, cell adhesion, and cell cycle pathways. In comparison, up-regulated genes were significantly enriched in cell proliferation regulation, negative transcription regulation, and canonical Wnt signaling pathways (Figure 3A and B). Major MFs of down-regulated genes in blood were protein binding, protein serine/threonine kinase activity, and extracellular matrix structural constituents. The enriched MF of up-regulated genes was RNA transcription factor and ion channel binding. Interestingly, KEGG pathway (KP) analysis of blood DEGs showed dysregulation in the AMP-activated protein kinase (AMPK) signaling and tumor necrosis factor (TNF) signaling for down- and up-regulated genes, respectively (Supplementary File 2 and Figures 3 and 4). In contrast, enriched BP of SN tissue down-regulated genes are nervous system development, dopamine-receptor signaling, dopamine biosynthetic, aminergic neurotransmitter loading into synaptic vesicle, synaptic transmission, and neurotransmitter biosynthetic processes. The BP of up-regulated genes of SN tissue includes hydrolysis coupled proton transport, synaptic vesicle recycling, axonal fasciculation, neuron migration, negative regulation ERK1 and ERK2 cascades, and synaptic vesicle recycling. Enriched pathways in KEGG for the down-regulated SN tissue genes include impairment in the calcium signaling, calcium reabsorption, and phenylalanine metabolism. However, up-regulated genes showed significant enrichment in MAPK signaling pathway (Supplementary File 2 and Figure 3C and D). Gene Ontology and KEGG enrichment analysis of 13 common DEGs are shown in Supplementary Figure S1 and Supplementary Table S2.
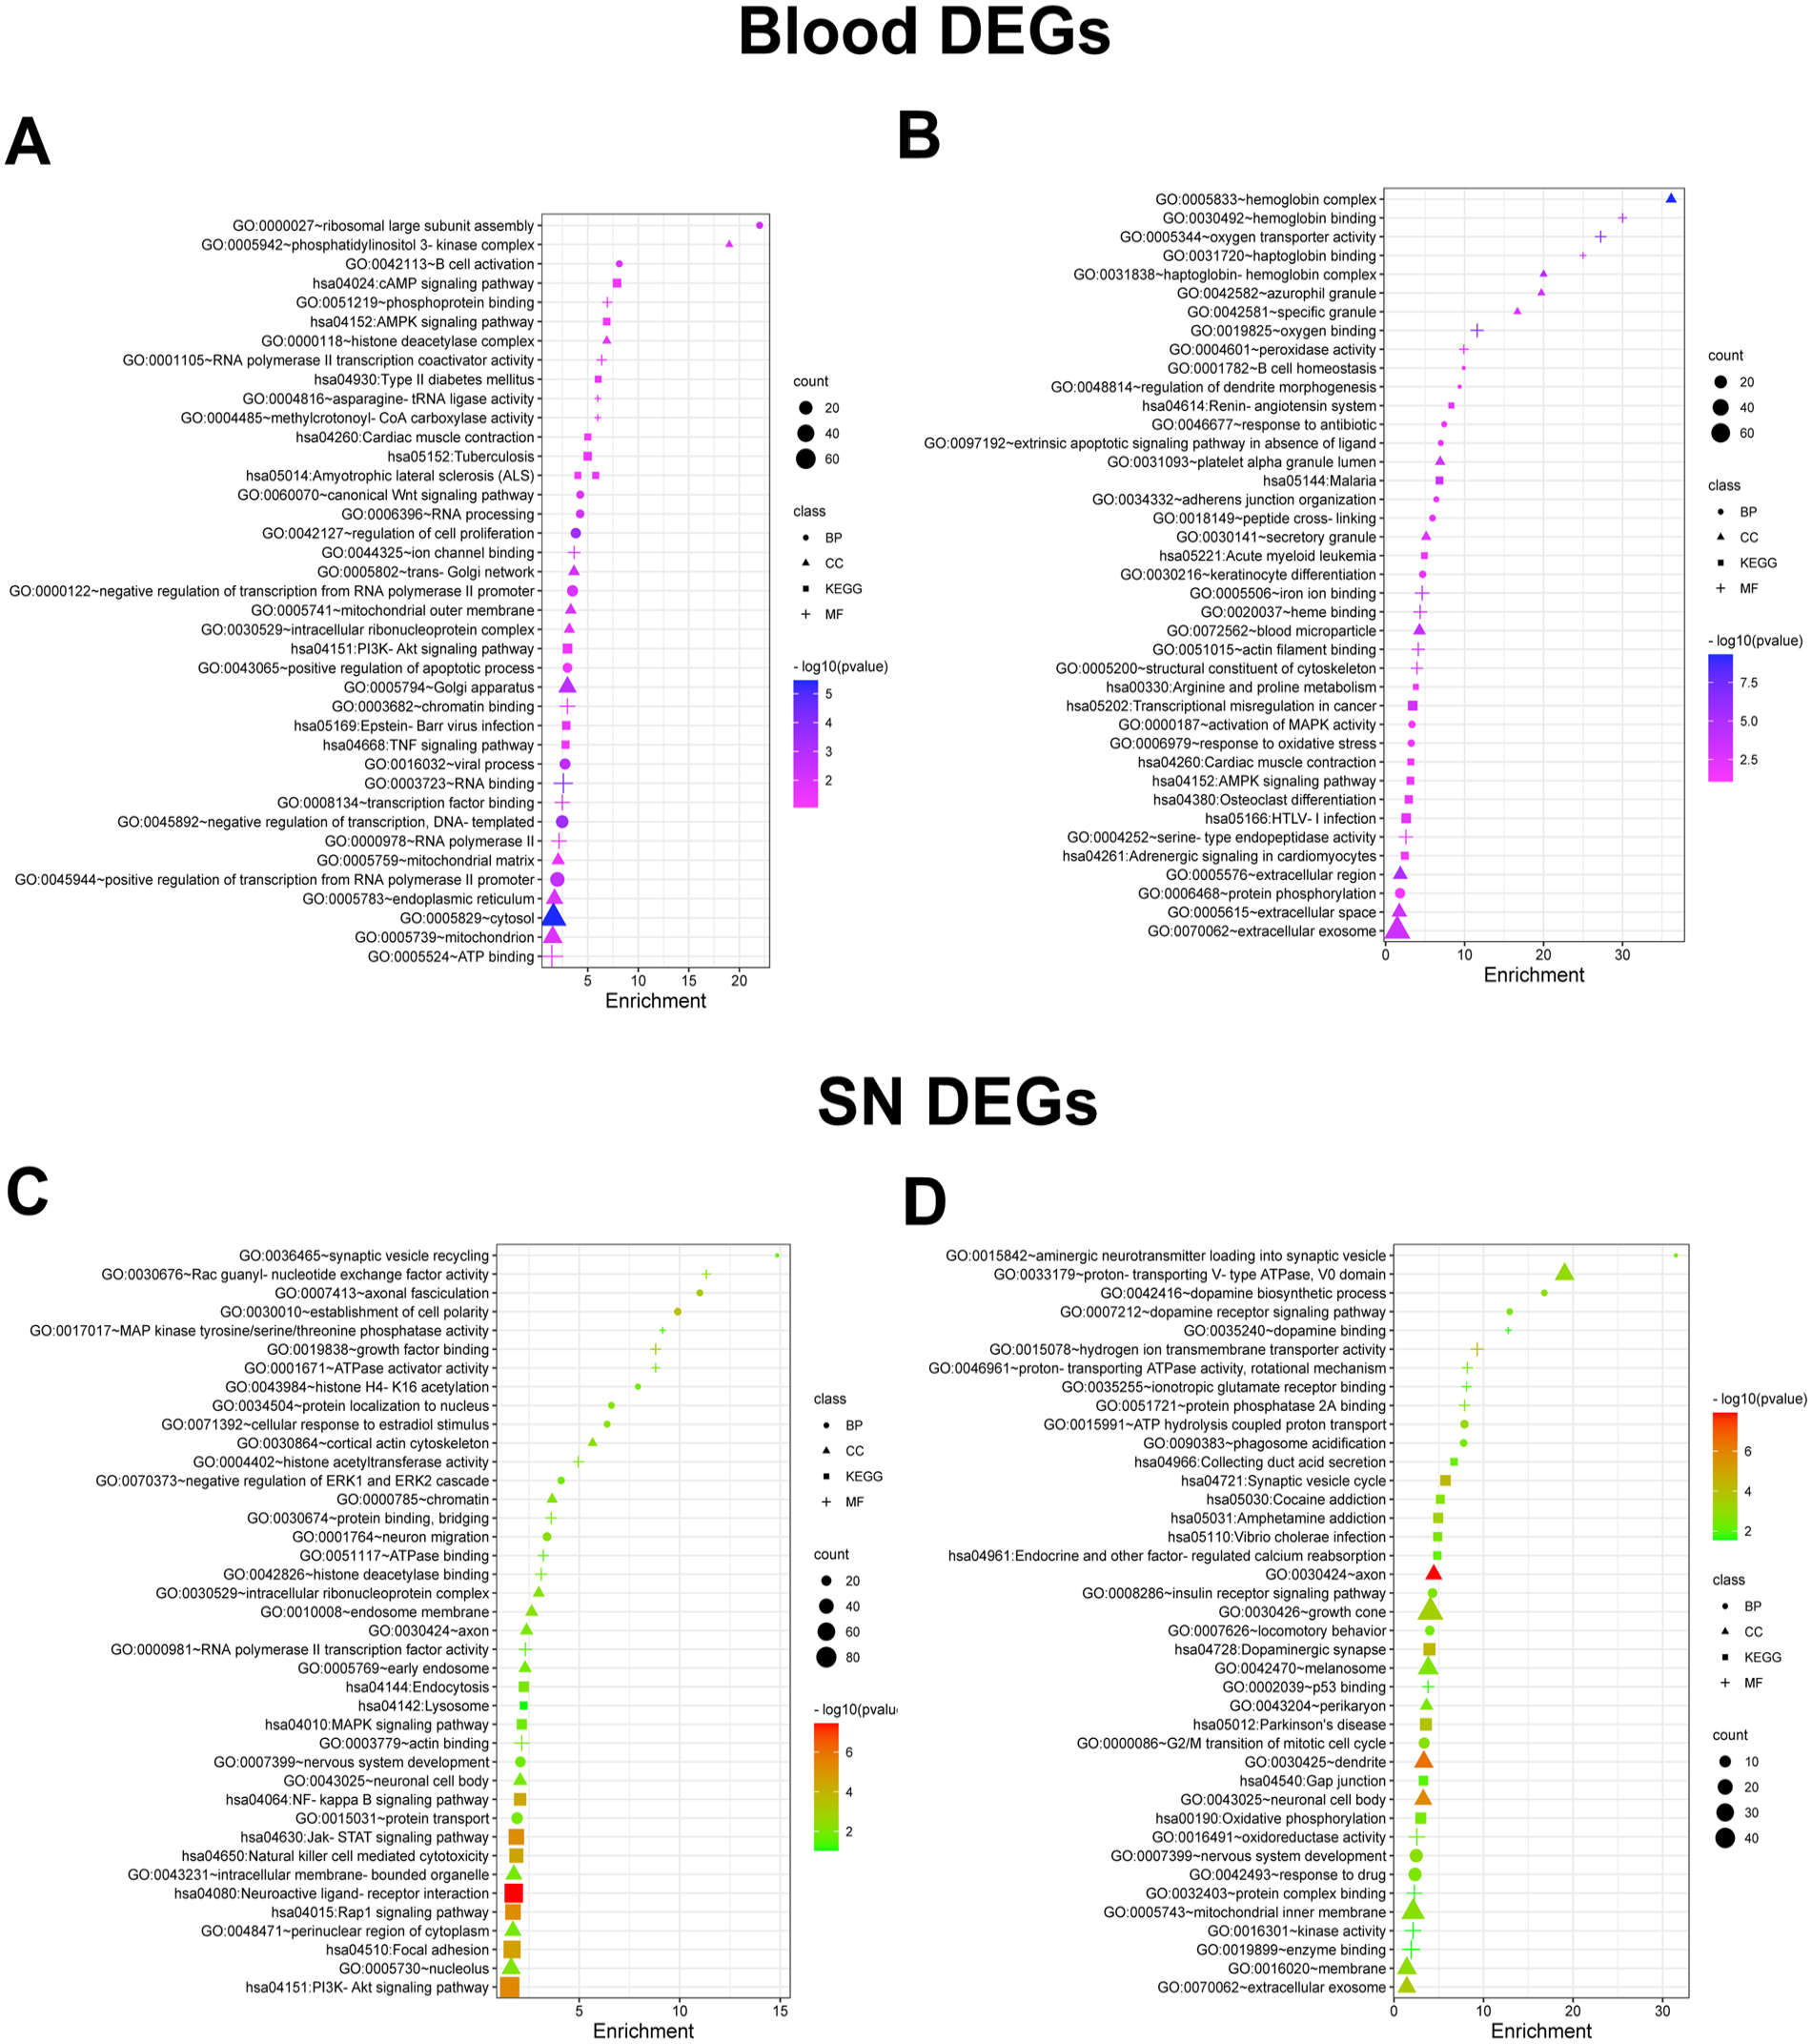
Functional enrichment analysis. Dot plots of top 10 GO annotations and pathways of up-regulated (A and C) and down-regulated genes (B and D) in blood and SN tissue, respectively. The size of the dots represents the number of significant genes associated with the GO and pathway term and the color of the dots represent the P-value. BP indicates biological process; CC, cellular component; DEG, differentially expressed gene; KEGG, Kyoto Encyclopedia of Genes and Genomes; MF, molecular function; SN, substantia nigra.
Mapping of DEGs with all brain expressed genes analysis
We used the curated tool SynGO to identify over-represented genes in the brain. SynGO analysis showed enrichment in ontological categories correlated with synaptic signaling and synapse organization for inhibitory neuronal genes both in blood and SN DEGs. When we searched SynGO with blood DEGs, 43 out of 540 (8%) were synapse function-related (Supplementary File 3 and Figure 4A and B). The BPs were significantly enriched across all main synaptic functions such as transport, signaling, metabolism, and pre- and post-synapse. From brain SN tissue, 99 DEGs out of 1024 (9.5%) were brain-enriched genes (Supplementary File 3 and Figure 4C and D). In addition, we retrieved CCs for 34 and 88 and BPs for 28 and 78 blood and brain SN DEGs, respectively, from SynGO (Figure 4). Moreover, identified genes with SynGO were significantly related to PD pathophysiologies such as chemical synaptic transmission, synaptic vesicle recycling, neuronal synaptic plasticity, learning or memory, positive regulation of transferase activity, and cell morphogenesis (Supplementary Figure S2). However, several identified proteins were not found in the currently annotated SynGO proteins, including general cellular and metabolic proteins that reside in the synapse (Supplementary File 3).

Sunburst plot showing the SynGO cellular components (A and C) and biological processes (B and D) annotations for the DEGs. Inner rings are parent terms of more specific child terms in the outer rings, color-coded according to enrichment Q-value. In particular, there was a broad and significant coverage of synapse-specific proteins distributed across both pre- and post-synapse functions. DEGs indicate differentially expressed genes; SN, substantia nigra.
PPI network and key gene identification
All 1564 non-redundant pooled DEGs from both blood and SN tissue were queried separately and/or combined to search the STRING database to generate their molecular interactome (Figure 5). First, we selected the top 10 ranking genes based on the network topological parameters. We identified key genes in blood and SN tissue, which have significantly higher hub, bottleneck, and centrality values, indicating their strong regulatory role in the gene network (Figure 5D). Using Network Analyzer and cytoHubba plugin in Cytoscape software, 10 hub genes from blood (Figure 5A and E) (SRC, ESR1, FOS, XPO1, mTOR, RPL11, RPLP0, RPL6, RPS5, and SUMO1) were identified. Similarly, 10 SN tissue hub genes (CDK1, CDC5L, BDNF, FOS, CREBBP, RPS6, CAT, XPO1, SMARCA4, and RAB5A) (Figure 5B and F) were identified. Finally, the combined PPI of blood and SN DEGs is shown in Figure 5C. The top 10 hub genes from the combined DEGs of blood and SN tissue are SRC, ESR1, CDK1, CREBBP, CAT, FOS, mTOR, BDNF, SUMO1, and XPO1 (Figure 5C and G). Further functional analysis showed that these hub genes were strongly/significantly associated with PD and other neurodegenerative disorders such as Alzheimer, Huntington, Amyotrophic Lateral Sclerosis (ALS), and Lewy body dementia (Supplementary Figure S3). These key genes were mainly mapped to 3 key regulatory pathways of PD (a) mTOR, (b) autophagy, and (c) AMPK signaling (Supplementary Figure S4). We mapped 6, 2, and 3 key DEGs to mTOR, autophagy, and AMPK pathways, respectively (Supplementary Figure S4).

PPI network analysis. PPI network of total DEGs in blood (A) and SN tissue (B). Green circles represent the up-regulated DEGs, blue circles represent the down-regulated DEGs, and red circles represent the key genes. (C) PPI network of total DEGs in PD. Green circles represent the blood DEGs, blue circles represent the SN DEGs, and red circles represent the PPI network of key genes. (D) The topological property of the network: the behaviors of degree distributions (P(k)), clustering coefficient (C(k)), neighborhood connectivity (CN(k)), betweenness (CB(k)), closeness (CC(k)), and eigenvector (CE(k)) measurements as a function of degree k. (E–G) Key genes identified by the network topological parameters in each PPI. DEGs indicate differentially expressed genes; PD, Parkinson disease; PPI, protein-protein interaction; SN, substantia nigra.
Druggability analysis
Druggability analysis, including chemical-protein interaction network, is an important and effective method for rapid target identification, uncovering new indications for existing therapeutic agents and for advancing drug discovery. We built a chemical-protein interaction network using common DEGs with a similar pattern of expression (either up-regulated or down-regulated) in blood and SN tissue samples and key genes identified by network topological parameters (Figure 6). Proteins with the highest degree of interaction include FOS, CDK1, CXCR4, ESR1, CAT, and SRC. Valproic acid and estradiol were the most enriched chemical in common genes and key genes. Druggability analysis predicted potential drugs that target common genes or/and key genes (Tables 1 and 2). The top drugs with the highest anti-similar signature score predicted from common genes and key genes were Cyclosporin and Selumetinib, respectively.

Chemical-protein interaction network. Network designates the relationship of common DEGs, key genes, and chemical crosstalk. Genes and chemicals are classified by their degree of centrality. Node size and color are proportional to the degree of connection. Circular nodes represent the genes, and squares nodes represent the chemicals. DEGs indicate differentially expressed genes.
Top drugs predicted for PD from shared DEGs with a similar expression pattern in both Blood and SN tissue.

Abbreviations: DEG, differentially expressed genes; PD, Parkinson disease; SN, substantia nigra.
Top drugs predicted for PD from key genes.

Abbreviation: PD, Parkinson disease.
Discussion
High throughput microarray-based global gene expression profiles have been commonly used in recent years to classify DEGs and pathways underlying the pathogenesis of PD. Most of these studies are predominantly from the single tissue types. The expression profile of the brain regions identifies genes associated with changes in cellular structure or pathology but is difficult to obtain the tissue. There is an increasing interest in the discovery of PD blood biomarkers. For example, low blood serum urate concentrations have increased the risk of PD. 34 Therefore, predicting such candidate genes before experimental analysis will save time and effort. In this study, we performed a meta-analysis of microarray data sets from blood and SN tissue, to study DEGs, and PPI regulatory networks. Blood DEGs revealed protein phosphorylation and regulation of dendrite morphogenesis processes that are highly functionally related to neuronal plasticity. 35 DEGs like CASP9, BCL2, MAP2K6, and GRIN1, are known to be involved in PD 36 and other neurodegenerative diseases.37,38 Negative regulation of ERK1 and ERK2 cascades, MAPK signaling, Wnt pathways, NF-κB, and PI3K-Akt signaling pathway was some of the highly enriched processes of SN DEGs (Figure 3). ERK1 and ERK2 cascades are involved in various types of synaptic plasticity 39 and neuronal death, 40 a hallmark of PD. ERK1 and ERK2 activate the mTOR signaling pathway, a key regulator of protein synthesis. 41 Other highly dysregulated processes such as neurotransmitter loading into synaptic vesicle, synaptic transmission, and dopaminergic synapse (Figure 3) are strongly linked to PD pathology as well. 42
To highlight uniquely expressed brain-specific genes, we queried the database with SynGO tool. SynGO showed significant enrichment of DEGs of both tissues correlated with synaptic signaling and synapse organization of inhibitory neuronal genes. All these enriched BPs are strongly involved in PD development.42,43 This finding demonstrates the coverage of a broad spectrum of synaptic proteins in PD in identified DEGs. Moreover, the imbalance of synaptic function could result in the accumulation of α-synuclein, in the form of Lewy bodies and Lewy neurites that affect neurotransmitter release and vesicle recycling.44,45
We also established a complete PPI network associated with DEGs to understand the disease’s primary regulatory genes. We considered the network’s hubs, motifs, and modules equally when identifying candidate genes and regulatory pathways rather than focusing solely on over-represented hub genes.17-20,46,47 We identified 10 PD key genes with higher centrality scores in the interactive regulatory networks. SRC, ESR1, and SUMO1 were found only in blood, and CREBBP, BDNF, CDK1, and CAT were only found in SN tissue. Three genes—mTOR, XPO1, and FOS—were down-regulated in blood samples and up-regulated in SN tissue (log2FC was 1.403, 1.64, and 1.41, respectively). In PD, such genes are involved in critical molecular mechanisms of neurodegeneration,48,49 including mTOR, autophagy, and AMPK signaling pathways. 50 The mTOR and AMPK are central autophagy regulators. Both activation and inactivation of mTOR and AMPK signaling are involved in PD and their dysregulation can be detrimental to cell survival and disease progression. 48 In our results, mTOR is down-regulated in blood but up-regulated in SN tissue (log2FC was −0.8 and 1.63, respectively). We found that in SN tissue, genes involved in the mTOR pathway, mTOR and XPO1, were up-regulated, although SN genes in the AMPK signaling pathway, SRC and BDNF, were down-regulated. Mammalian target of rapamycin signals through 2 distinct complexes known as mTORC1 and mTORC2, and their respective functions are dependent on specific protein associations. 51 Aberrant association of different proteins within complexes likely affects their activity. As we found that the total mTOR pathway is changed between blood and SN tissue, the decreased level of mTOR in peripheral mononuclear blood cells may be due to a compensatory mechanism to restore the normal functioning of downstream cellular processes or tissue and age-related changes. 52 In SN tissue, the increased expression level of mTOR seen in our analysis could be explained by the α-synuclein accumulation, a genetic and pathological hallmark of PD involved in membrane trafficking and vesicle cycling. 53 mTOR/p70S6K signaling has been reported as a contributor to the accumulation of A53T α-syn protein-linked Parkinsonism. Accumulating evidence indicates that restoring perturbed mTOR signaling in PD models can prevent neuronal death. Although only scant data are available concerning mTORC2 regulation, mTORC1 has been widely studied and increased expression of mTORC1 has been observed in many neurodegenerative diseases. 54 Selective inhibition, but not total, of mTOR has been reported to protect neurons by enhancing α-synuclein clearance in PD models. 54 Selective inhibition mTORC1 by rapamycin is neuroprotective, whereas prosurvival mTORC2-Akt signaling inhibition by RTP801 or complete blockade of mTOR by Torin1 causes neuron death. 55 As mTOR activation suppresses autophagy, subset inhibition of mTOR activity via mTORC1 represents a plausible therapeutic approach. 56 Autophagy activation has been demonstrated to be an effective strategy for increasing neurodegenerative disease-causing proteins clearance. Enhancing α-synuclein clearance through autophagy may be an effective therapeutic technique. 57 It would be promising to combine an mTOR-dependent, such as rapamycin, and mTOR-independent autophagy inducer like curcumin and trehalose 58 to arrest the neuronal death in PD. Of note, mTOR regulatory network genes were also seen in autophagy, fatty acid synthase (FAS), and thyroid-stimulating hormone (TSH) pathways. TSH levels are affected by various motor and non-motor PD conditions. 59
XPO1 (Exportin 1/CRM1) was also identified as key regulatory gene in the mTOR network. It mediates the translocation of hundreds of proteins and several RNAs, including genes in oncogenesis, anti-inflammatory, and antioxidant factors, into the cytoplasm 60 . Aberrant XPO1 function, up-regulated in SN tissue samples, causes alteration in the cell apoptosis, DNA damage repair, and chromosome stability. 61 Such dysregulation was found after the diverse types of neuronal damage,62,63 XPO1-dependent nuclear export is necessary for axonal damage onset, 62 and another hallmark of neurodegenerative disorders, including PD. 64 In the brain of aged mice, enhanced activity of XPO1 disrupts neuronal homeostasis by contributing to autophagy impairment, which in turn causes neuronal senescence. 65 XPO1 inhibition can affect many inflammatory and immune pathways associated with neurological disorders, including signal transduction cascades involving NF-κB/NLRP3 and FOXO. Therefore, XPO1 is considered an effective target to modulate inflammation by regulating the nuclear-cytoplasmic localization of important proteins. In a preclinical demyelination mouse model, XPO1 selective inhibitor (KPT-335) was shown to reduce motor symptoms, suppress inflammatory demyelination and axonal damage, and attenuate disease progression. 66 A recent study showed that XPO1 inhibitor KPT-8602 ameliorates PD by inhibiting NF-κB/NLRP3 pathway. 49
AMPK signaling pathway, a critical cellular energy sensor, was also dysregulated. AMP-activated protein kinase activation promotes catabolic pathways that generate ATP and inhibits anabolic processes. 67 It also has neuroprotective properties. 68 In PD, the role AMPK signaling pathway is still controversial. AMP-activated protein kinase activation showed a neuroprotective effect in PD models in vitro 68 and in vivo. 69 The neuroprotective effects of AMPK activation on PD were related to induced autophagy, mitochondrial biogenesis, and antioxidant gene expression. Other reports demonstrate that AMPK hyperactivation promotes neuronal degeneration in toxin-induced models of PD. 70 A recent study reported dexmedetomidine as a potential drug for managing pain associated with PD. 71 Dexmedetomidine was found to exhibit a protective effect over dopaminergic neurons in PD animal models, where it also alleviates pain by dampening the activation of dorsal horn of the spinal cord astrocytes via the AMPK/mTOR/NF-κB pathway. Ultimately, the beneficial effect of AMPK signaling seems to be obtained when precisely modulating its indirect activity during mild, chronic, and slowly progressing insult. Further investigation to identify specific targets related to the AMPK signaling pathway in PD, like mTOR pathway, may be more favorable to make therapeutic intervention possible.
To predict therapeutic targets and screen for drug molecules, we built a chemical-protein interaction network using shared genes and key genes. We found valproic acid and estradiol are neuroprotective in neurodegenerative diseases, including the PD. 72 Finally, drug prediction analysis results in several potential therapeutic alternatives for PD, including Staurosporine, Curcumin, Cyclosporin, Forskolin, Droxinostat, and Everolimus. Some predicted drugs have direct or/and indirect activity in neurodegenerative diseases, including PD. 73
Conclusions
In conclusion, this study explores molecular pathway and genetic factors of PD. We found that ERK1 and ERK2 cascades, TNF, MAPK, Wnt, mTOR, and AMPK signaling pathways play essential roles in PD pathogenesis. We identified 13 common genes with a similar pattern of expression in the blood and brain tissue which might play a crucial role in PD development and could serve as potential genetic biomarkers. In addition, 10 key genes were identified, with mTOR, AMPK, and autophagy being the most highly enriched pathways. Finally, potential drug molecules were identified by chemical-protein network and drug prediction analysis. Thus, we hope our work will provide and promote interest and encourage further investigation of identified genes and pathways as potential PD drivers.
Supplemental Material
sj-docx-10-bbi-10.1177_11779322231166214 – Supplemental material for Potential Biomarkers for Parkinson Disease from Functional Enrichment and Bioinformatic Analysis of Global Gene Expression Patterns of Blood and Substantia Nigra Tissues
Supplemental material, sj-docx-10-bbi-10.1177_11779322231166214 for Potential Biomarkers for Parkinson Disease from Functional Enrichment and Bioinformatic Analysis of Global Gene Expression Patterns of Blood and Substantia Nigra Tissues by Ramu Elango, Babajan Banaganapalli, Abdulrahman Mujalli, Nuha AlRayes, Sarah Almaghrabi, Majid Almansouri, Ahmed Sahly, Gada Ali Jadkarim, Md Zubbair Malik, Hussam Ibrahim Kutbi, Noor Ahmad Shaik and Eman Alefishat in Bioinformatics and Biology Insights
Supplemental Material
sj-docx-9-bbi-10.1177_11779322231166214 – Supplemental material for Potential Biomarkers for Parkinson Disease from Functional Enrichment and Bioinformatic Analysis of Global Gene Expression Patterns of Blood and Substantia Nigra Tissues
Supplemental material, sj-docx-9-bbi-10.1177_11779322231166214 for Potential Biomarkers for Parkinson Disease from Functional Enrichment and Bioinformatic Analysis of Global Gene Expression Patterns of Blood and Substantia Nigra Tissues by Ramu Elango, Babajan Banaganapalli, Abdulrahman Mujalli, Nuha AlRayes, Sarah Almaghrabi, Majid Almansouri, Ahmed Sahly, Gada Ali Jadkarim, Md Zubbair Malik, Hussam Ibrahim Kutbi, Noor Ahmad Shaik and Eman Alefishat in Bioinformatics and Biology Insights
Supplemental Material
sj-tif-1-bbi-10.1177_11779322231166214 – Supplemental material for Potential Biomarkers for Parkinson Disease from Functional Enrichment and Bioinformatic Analysis of Global Gene Expression Patterns of Blood and Substantia Nigra Tissues
Supplemental material, sj-tif-1-bbi-10.1177_11779322231166214 for Potential Biomarkers for Parkinson Disease from Functional Enrichment and Bioinformatic Analysis of Global Gene Expression Patterns of Blood and Substantia Nigra Tissues by Ramu Elango, Babajan Banaganapalli, Abdulrahman Mujalli, Nuha AlRayes, Sarah Almaghrabi, Majid Almansouri, Ahmed Sahly, Gada Ali Jadkarim, Md Zubbair Malik, Hussam Ibrahim Kutbi, Noor Ahmad Shaik and Eman Alefishat in Bioinformatics and Biology Insights
Supplemental Material
sj-tif-2-bbi-10.1177_11779322231166214 – Supplemental material for Potential Biomarkers for Parkinson Disease from Functional Enrichment and Bioinformatic Analysis of Global Gene Expression Patterns of Blood and Substantia Nigra Tissues
Supplemental material, sj-tif-2-bbi-10.1177_11779322231166214 for Potential Biomarkers for Parkinson Disease from Functional Enrichment and Bioinformatic Analysis of Global Gene Expression Patterns of Blood and Substantia Nigra Tissues by Ramu Elango, Babajan Banaganapalli, Abdulrahman Mujalli, Nuha AlRayes, Sarah Almaghrabi, Majid Almansouri, Ahmed Sahly, Gada Ali Jadkarim, Md Zubbair Malik, Hussam Ibrahim Kutbi, Noor Ahmad Shaik and Eman Alefishat in Bioinformatics and Biology Insights
Supplemental Material
sj-tif-3-bbi-10.1177_11779322231166214 – Supplemental material for Potential Biomarkers for Parkinson Disease from Functional Enrichment and Bioinformatic Analysis of Global Gene Expression Patterns of Blood and Substantia Nigra Tissues
Supplemental material, sj-tif-3-bbi-10.1177_11779322231166214 for Potential Biomarkers for Parkinson Disease from Functional Enrichment and Bioinformatic Analysis of Global Gene Expression Patterns of Blood and Substantia Nigra Tissues by Ramu Elango, Babajan Banaganapalli, Abdulrahman Mujalli, Nuha AlRayes, Sarah Almaghrabi, Majid Almansouri, Ahmed Sahly, Gada Ali Jadkarim, Md Zubbair Malik, Hussam Ibrahim Kutbi, Noor Ahmad Shaik and Eman Alefishat in Bioinformatics and Biology Insights
Supplemental Material
sj-tif-4-bbi-10.1177_11779322231166214 – Supplemental material for Potential Biomarkers for Parkinson Disease from Functional Enrichment and Bioinformatic Analysis of Global Gene Expression Patterns of Blood and Substantia Nigra Tissues
Supplemental material, sj-tif-4-bbi-10.1177_11779322231166214 for Potential Biomarkers for Parkinson Disease from Functional Enrichment and Bioinformatic Analysis of Global Gene Expression Patterns of Blood and Substantia Nigra Tissues by Ramu Elango, Babajan Banaganapalli, Abdulrahman Mujalli, Nuha AlRayes, Sarah Almaghrabi, Majid Almansouri, Ahmed Sahly, Gada Ali Jadkarim, Md Zubbair Malik, Hussam Ibrahim Kutbi, Noor Ahmad Shaik and Eman Alefishat in Bioinformatics and Biology Insights
Supplemental Material
sj-xlsx-5-bbi-10.1177_11779322231166214 – Supplemental material for Potential Biomarkers for Parkinson Disease from Functional Enrichment and Bioinformatic Analysis of Global Gene Expression Patterns of Blood and Substantia Nigra Tissues
Supplemental material, sj-xlsx-5-bbi-10.1177_11779322231166214 for Potential Biomarkers for Parkinson Disease from Functional Enrichment and Bioinformatic Analysis of Global Gene Expression Patterns of Blood and Substantia Nigra Tissues by Ramu Elango, Babajan Banaganapalli, Abdulrahman Mujalli, Nuha AlRayes, Sarah Almaghrabi, Majid Almansouri, Ahmed Sahly, Gada Ali Jadkarim, Md Zubbair Malik, Hussam Ibrahim Kutbi, Noor Ahmad Shaik and Eman Alefishat in Bioinformatics and Biology Insights
Supplemental Material
sj-xlsx-6-bbi-10.1177_11779322231166214 – Supplemental material for Potential Biomarkers for Parkinson Disease from Functional Enrichment and Bioinformatic Analysis of Global Gene Expression Patterns of Blood and Substantia Nigra Tissues
Supplemental material, sj-xlsx-6-bbi-10.1177_11779322231166214 for Potential Biomarkers for Parkinson Disease from Functional Enrichment and Bioinformatic Analysis of Global Gene Expression Patterns of Blood and Substantia Nigra Tissues by Ramu Elango, Babajan Banaganapalli, Abdulrahman Mujalli, Nuha AlRayes, Sarah Almaghrabi, Majid Almansouri, Ahmed Sahly, Gada Ali Jadkarim, Md Zubbair Malik, Hussam Ibrahim Kutbi, Noor Ahmad Shaik and Eman Alefishat in Bioinformatics and Biology Insights
Supplemental Material
sj-xlsx-7-bbi-10.1177_11779322231166214 – Supplemental material for Potential Biomarkers for Parkinson Disease from Functional Enrichment and Bioinformatic Analysis of Global Gene Expression Patterns of Blood and Substantia Nigra Tissues
Supplemental material, sj-xlsx-7-bbi-10.1177_11779322231166214 for Potential Biomarkers for Parkinson Disease from Functional Enrichment and Bioinformatic Analysis of Global Gene Expression Patterns of Blood and Substantia Nigra Tissues by Ramu Elango, Babajan Banaganapalli, Abdulrahman Mujalli, Nuha AlRayes, Sarah Almaghrabi, Majid Almansouri, Ahmed Sahly, Gada Ali Jadkarim, Md Zubbair Malik, Hussam Ibrahim Kutbi, Noor Ahmad Shaik and Eman Alefishat in Bioinformatics and Biology Insights
Supplemental Material
sj-xlsx-8-bbi-10.1177_11779322231166214 – Supplemental material for Potential Biomarkers for Parkinson Disease from Functional Enrichment and Bioinformatic Analysis of Global Gene Expression Patterns of Blood and Substantia Nigra Tissues
Supplemental material, sj-xlsx-8-bbi-10.1177_11779322231166214 for Potential Biomarkers for Parkinson Disease from Functional Enrichment and Bioinformatic Analysis of Global Gene Expression Patterns of Blood and Substantia Nigra Tissues by Ramu Elango, Babajan Banaganapalli, Abdulrahman Mujalli, Nuha AlRayes, Sarah Almaghrabi, Majid Almansouri, Ahmed Sahly, Gada Ali Jadkarim, Md Zubbair Malik, Hussam Ibrahim Kutbi, Noor Ahmad Shaik and Eman Alefishat in Bioinformatics and Biology Insights
Footnotes
Funding:
The author(s) disclosed receipt of the following financial support for the research, authorship, and/or publication of this article: This project was funded by the Deanship of Scientific Research (DSR) at King Abdulaziz University, under grant no. G-673-140-1441. The authors, therefore, acknowledge the DSR for technical and financial support.
Declaration Of Conflicting Interests:
The author(s) declared no potential conflicts of interest with respect to the research, authorship, and/or publication of this article.
Author Contributions
RE, BB, and NAS contributed to the conceptualization. RE and BB contributed to the data curation. RE, BB, AM, and NAS contributed to the formal analysis. RE contributed to the funding acquisition. RE, BB, NAS, AM, and ZM contributed to the methodology. RE contributed to the project administration. RE, NA-R, SA, MM, and HIK contributed to the resources. AM, EA, and BB contributed to the software. RE and NAS contributed to the supervision. AM and BB contributed to the visualization. RE, BB, AM, AS, ZM, EA, IK, and NAS contributed to writing original draft and review. RE, BB, and AM contributed equally.
Data Availability Statement
All data sets analyzed for this study are included in the article/Supplementary Material.
Supplemental material
Supplemental material for this article is available online.
References
Supplementary Material
Please find the following supplemental material available below.
For Open Access articles published under a Creative Commons License, all supplemental material carries the same license as the article it is associated with.
For non-Open Access articles published, all supplemental material carries a non-exclusive license, and permission requests for re-use of supplemental material or any part of supplemental material shall be sent directly to the copyright owner as specified in the copyright notice associated with the article.