
Abstract
Background:
A challenge in developing machine learning regression models is that it is difficult to know whether maximal performance has been reached on the test dataset, or whether further model improvement is possible. In biology, this problem is particularly pronounced as sample labels (response variables) are typically obtained through experiments and therefore have experiment noise associated with them. Such label noise puts a fundamental limit to the metrics of performance attainable by regression models on the test dataset.
Results:
We address this challenge by deriving an expected upper bound for the coefficient of determination (R2) for regression models when tested on the holdout dataset. This upper bound depends only on the noise associated with the response variable in a dataset as well as its variance. The upper bound estimate was validated via Monte Carlo simulations and then used as a tool to bootstrap performance of regression models trained on biological datasets, including protein sequence data, transcriptomic data, and genomic data.
Conclusions:
The new method for estimating upper bounds for model performance on test data should aid researchers in developing ML regression models that reach their maximum potential. Although we study biological datasets in this work, the new upper bound estimates will hold true for regression models from any research field or application area where response variables have associated noise.
Background
Machine learning (ML) based regression analysis, which is used to discover complex relationships between sample features and labels (supervised learning), is frequently applied in diverse biological fields including metabolic engineering, 1 protein engineering, 2 and systems biology.3-5 A key question when developing these supervised ML models is whether there is sufficient information in the available data to accurately predict sample labels. For a given dataset, the performance of the best possible function for mapping input features to sample labels should thus be estimated to serve as a benchmark in ML model development. This level of performance is typically referred to as Bayes optimal error for classification problems. 6 In many classical ML problems—such as image classification, handwriting recognition and speech recognition—human-level performance at the task is very high and can therefore be used as a heuristic to estimate maximal performance.7,8 However, for biological multi-dimensional data, human-level performance is low and is therefore not a good performance estimate. On the contrary, in biology one often seeks to train ML models for the explicit purpose of recognizing patterns and gaining insights that were obscured from the human intellect.9,10 Therefore, without a clear performance benchmark against which to bootstrap biological regression models, it is difficult to know whether further model development is worth-while and when the performance limit has been reached.
When testing the performance of trained ML regression models on holdout data, the discrepancy between predicted labels and observed labels in a test dataset is evaluated using metrics such as the mean squared error (MSE) and the coefficient of determination (R2). 11 Sample labels used in regression analysis of biological systems are typically real numbers obtained through measurements in a set of laboratory experiments. Such measurements inextricably have experimental noise and measurement error associated with them,12-14 thus affecting the quality of the sample labels. Because of such label noise a ML model with an MSE of 0 or R2 of 1 (perfect prediction) cannot be achieved; there is an upper bound that cannot be surpassed. Methods to estimate this upper bound are underdeveloped, although some progress has been made recently.15,16 Moreover, the resources invested into model development have diminishing returns on model performance as one approaches the upper bound. Knowing the best expected MSE or R2 (i.e. the upper bounds) of a specific regression problem and dataset enables the discrepancy between current and potential model performance to be quantified, thus giving researchers a means to assess the cost-benefit trade-off of further model development.
In the present study, we mathematically derive a method to estimate upper bounds for the regression model performance metrics MSE and R2 on holdout data directly from the experimental noise associated with response variables in a dataset and independently of their predictors. Using Monte Carlo simulations, we show that this method is highly accurate and outperforms existing ones. Furthermore, by applying the method to real biological modeling problems and datasets, including protein sequence data, transcriptomics data and genomics data, we demonstrate how the new upper bound estimates can inform model development.
Methods
Enzyme catalytic temperature optima dataset
We first collected Topt of 5675 enzymes with known protein sequences from BRENDA.
17
Of these 3096 enzymes were successfully mapped to a microbial optimal growth temperature (OGT) database.
18
To obtain a clean dataset with less noise we carried out several steps: (1) Enzymes for which the Topt entry contained “assay at” in the BRENDA “comments” field were removed from the raw dataset. (2) If a subset of all enzymes from a specific organism had the same EC number and exactly the same Topt, then these were removed. This was done to address an issue with non-perfect matching between experimental data from the literature and Uniprot identifiers (186 enzymes). (3) Enzymes with multiple Topt values having standard deviations greater than 5 were removed (96 enzymes). After these steps, 1902 enzymes remained in the cleaned dataset, of which 1232 were with known OGT. In both raw and cleaned datasets, any sequences shorter than 30 residues or containing letters that are not in 20 standard amino acids were discarded and for enzymes still with multiple Topt values the average value was used. Estimation of label noise: For enzymes with multiple Topt values in BRENDA, the variance for each enzyme was calculated. Subsequently, the average variance for all those enzymes was calculated and used as the estimation of experimental noise
Protein transcription level dataset
Genomic data including open reading frame (ORF) boundaries of Saccharomyces cerevisiae C288 was obtained from the Saccharomyces Genome Database (https://www.yeastgenome.org/)19,20 and published data.21,22 Coding regions were extracted based on ORF boundaries and codon frequencies were normalized to probabilities. Processed raw RNA sequencing Star counts were obtained from the Digital Expression Explorer V2 database (http://dee2.io/index.html) 23 and filtered for experiments that passed quality control. Raw mRNA data were transformed to transcripts per million (TPM) counts 24 and genes with zero mRNA output (TPM < 5) were removed. Prior to modeling, the mRNA counts were Box-Cox transformed. 25
Yeast pangenome and quantitative traits dataset
The gene presence/absence (P/A) encoding of S. cerevisiae pan genome were obtained from Li et al. 26 The 35 quantitative traits were obtained from Peter et al. 27
Monte Carlo simulations on expected
score
Given the true functions between features and labels
Randomly generate 1000 samples from
Randomly generate a noise vector
Add noise to
Calculate
Calculate upper bound for
Repeat steps 1 to 6 for 1000 times.
A linear function
Monte Carlo simulations on data cleaning
Define a linear function
Randomly generate feature of 1000 samples as
Randomly generate a noise vector
Calculate observed target values via
Assume we only know the first
Repeat steps 1 through 4 for a total of 100 times.
Feature extraction for enzymes in Topt dataset
The 5494 features from iFeature were broken up into 20 sub-feature sets according to their types, and their predictive power was evaluated using 5 different regression models (linear, elastic net, Bayesian ridge, decision tree and random forest regressors).
A total of 20 different sets of protein features were extracted with iFeature
28
using default settings: amino acid composition (AAC, 20 features), dipeptide composition (DPC, 400), composition of k-spaced amino acid pairs (CKSAAP, 2400), dipeptide deviation from expected mean (DDE, 400), grouped amino acid composition (GAAC, 5), composition of k-spaced amino acid group pairs (CKSAAGP, 150), grouped dipeptide composition (GDPC, 25), grouped tripeptide composition (GTPC, 125), Moran autocorrelation (Moran, 240), Geary autocorrelation (Geary, 240), normalized Moreau-Broto (NMBroto, 240), composition-transition-distribution (CTDC, 39; CTDT, 39; CTDD, 195), conjoint triad (CTriad, 343), conjoint k-spaced triad (KSCTriad, 343), pseudo-amino acid composition (PAAC, 50), amphiphilic PAAC (APAAC, 80), sequence-order-coupling number (SOCNumber, 60) and quasi-sequence-order descriptors (QSOrder, 100). In total, we obtained 5494 features from iFeature. Furthermore, we additionally obtained features in the form of sequence embedding representations encoded by a deep learning model UniRep,
29
which is a Multiplicative Long-Short-Term-Memory (mLSTM) Recurrent Neural Networks (RNNs) that was trained on the UniRef50 dataset.
30
A total of 1900
Supervised classical ML methods
Input features were first scaled to a standard normal distribution by
Supervised deep ML methods
To test the performance of a deep neural networks on the prediction of enzyme Topt, architectures were tested that comprised up to 9 convolutional neural network (CNN) layers 32 followed by 2 fully connected (FC) layers. 33 Batch normalization 34 and weight dropout 35 were applied after all layers and max-pooling 36 after CNN layers. The Adam optimizer 37 with MSE loss function and ReLU activation function 38 with uniform 7 weight initialization were used. In total, 26 hyper-parameters were optimized over a predefined parameter space (Table S3) using a tree-structured Parzen estimators approach 39 at default settings for 1000 iterations.40,41 The Keras v2.2 and Tensorflow v1.10 software packages were used.
Prediction of Topt for enzymes from BRENDA and CAZy
Sequences and associated OGT values for the BRENDA database was obtained from Li et al. 42 For the CAZy database, enzyme information including protein name, EC number, Organism, GenBank id, Uniprot id, PDB id and CAZy family id were obtained from http://www.cazy.org/. 43 1 346 471 proteins with unique GenBank identifiers were obtained. Protein sequences were first downloaded from NCBI ftp site: https://ftp.ncbi.nih.gov/ncbi-asn1/protein_fasta/. Then only those sequences that were present in the CAZy dataset were kept by matching GenBank identifier. 924 642 sequences could be mapped to an OGT value by cross-referencing the source organism name and an OGT dataset. 18 Only the species names were checked, ignoring strain designations, for instance S. cerevisiae S288 C was considered as S. cerevisiae. For Topt prediction on the BRENDA and CAZy data, the model with the best performance was selected, which in this case was the random forest model trained only on amino acid frequencies and OGT. The model was then trained on all samples in the training dataset. For the prediction, (1) the 20 amino acid frequencies were extracted with iFeature 28 and OGT values of their source organisms were mapped; (2) all these 21 features were normalized by subtracting the mean and then divided by the standard deviation obtained from the training dataset; and (3) these data were used as input of the model for the prediction of the Topt values.
Theoretical Analysis
Starting from first principles, we mathematically derived a method to estimate upper bounds of model performance on holdout data in terms of R2 and benchmarked the upper bound estimates against existing methods.
Estimating the theoretical upper bound of regression model performance
Given a set of samples with experimentally determined labels
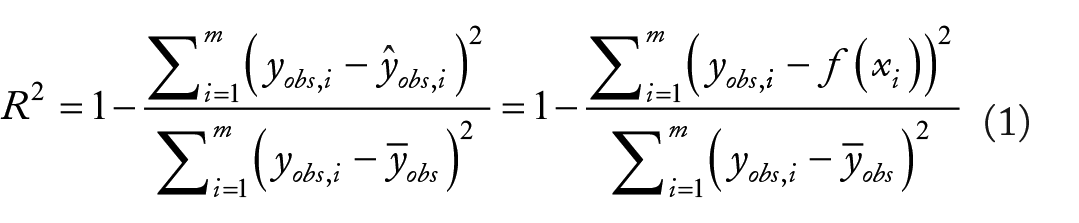
where

and in which
We refer to this upper bound estimate as
The new upper bound estimate

Schematic diagram depicting the estimation of the upper bound of model performance
upper bound estimates outperform existing methods
In recent publications it has been proposed that, given a set of experimentally measured values
To directly compare
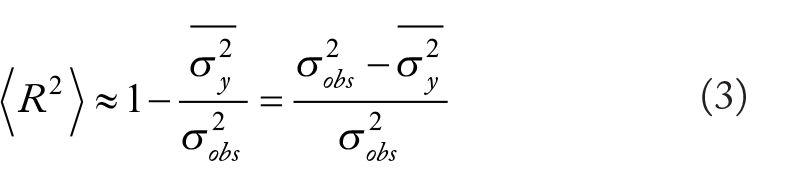
Monte Carlo simulations of the upper bound of
Since
In the above analysis, idealized conditions were used in that all features were known. Conversely, in real-world ML applications, typically only an incomplete set of features is known. To more accurately simulate this real-world situation, we performed Monte Carlo simulations using incomplete feature sets (see section “Monte Carlo simulations on data cleaning”). We also evaluated how ML model performance is affected by removal of the most noisy sample labels (Figure 2C). As anticipated, models trained with the full feature set (10/10) outperformed those trained with a subset of features, with the model containing all 10 features reaching the
Experimental Case Studies
We next explored the applicability of
Using the theoretical upper bound to inform modeling
We first tackled the problem of obtaining models to accurately predict enzyme optimal catalytic temperatures (Topt) using features extracted from their protein primary structures. A dataset comprising the Topt of 5343 individual enzymes was collected from the BRENDA
17
database. Here, using enzymes for which Topt values had been measured in multiple experiments, the experimental noise
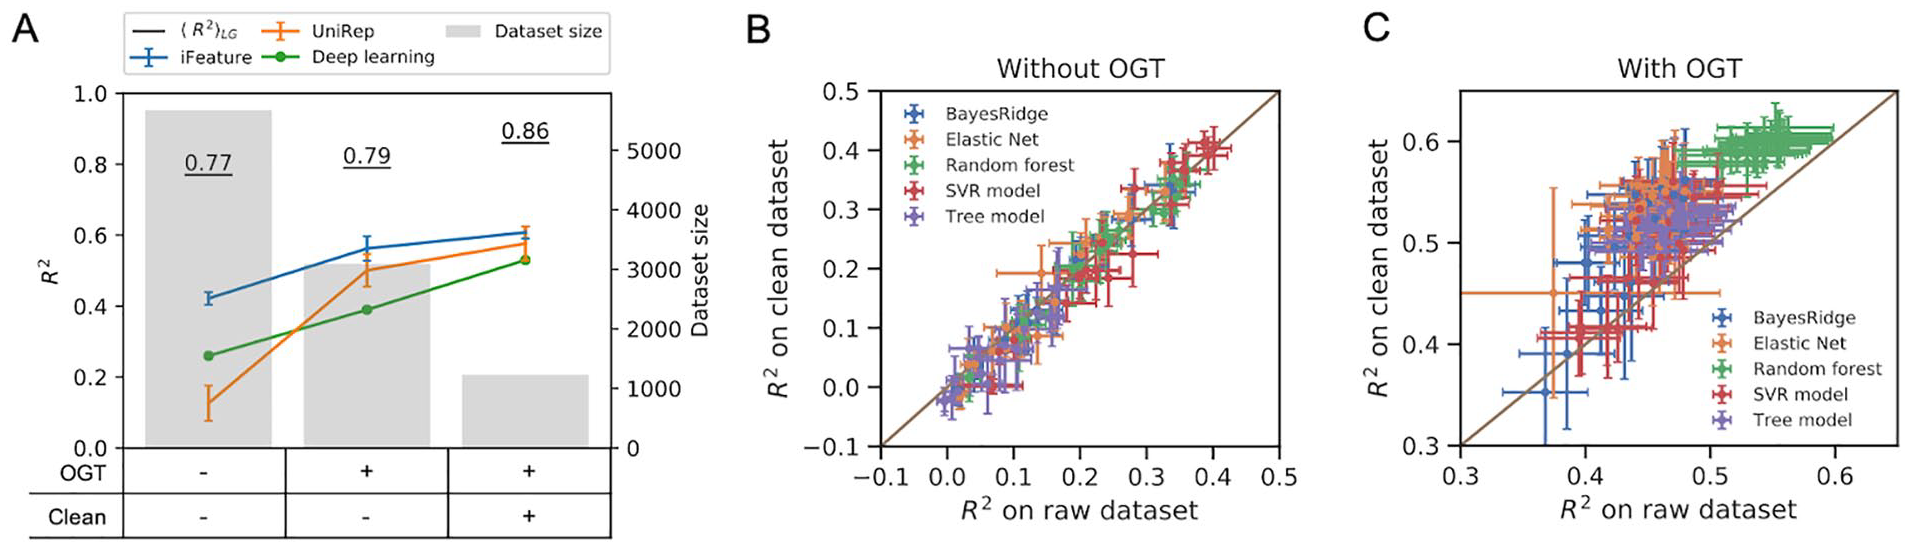
Development of machine learning models for the prediction of enzyme optimal temperature (Topt). (A) Performance of classical models using iFeatures
28
and UniRep encoding
29
feature sets as well as a deep neural networks with one-hot encoded protein sequence as input. (B, C) Comparison of model performance on raw and clean dataset (B) with; and (C) without optimal growth temperature (OGT) as one of the features. The features calculated by iFeature were grouped into 20 sub-feature sets as described in the “Methods” section. Error bars show the standard deviation of
First, we performed feature engineering by including the OGT of the organism, from which the enzyme was derived, as an additional feature into the iFeature and UniRep feature sets. Consequently, the dataset size decreased to 2917 enzymes, as 55% of the samples were omitted due to unknown OGT values of their source organisms. This led to models improved by 33% and 384%, respectively (Figure 3A), and the best resulting
As a side note, we used the improved model (a random forest trained on amino acid composition and OGT) to update Topt annotation of BRENDA enzymes in the Tome package 42 and also extended it to carbohydrate-active (CAZy) enzymes 43 (Figure S6) (https://github.com/EngqvistLab/Tome).
Further analyses of
in relation to experimental noise
We next explored how the amount of experimental noise in the response variables can affect the

Amount of experimental noise affects estimates of
Finally, for some datasets it may not be feasible to estimate the experimental noise, for instance, if the values for replicates in an experiment are not available. We thus analyzed how

Discussion
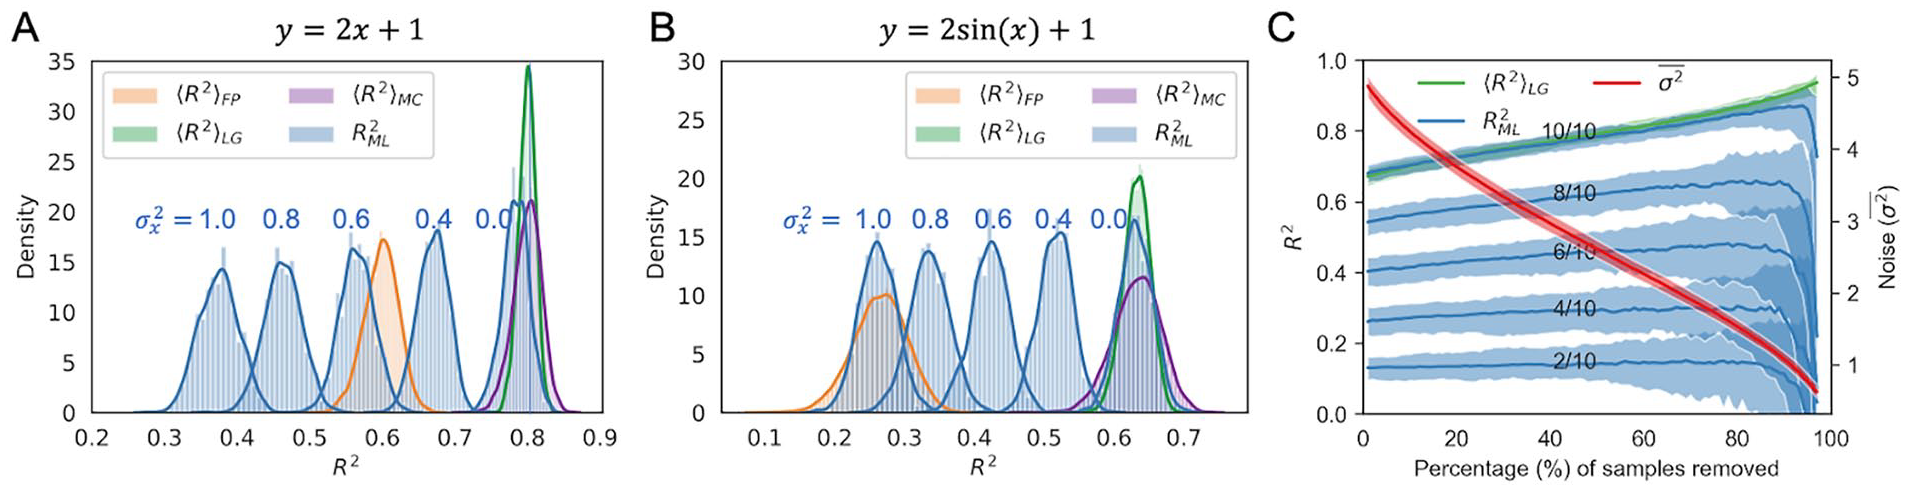
In the present study, we establish a method to estimate an upper bound for expected ML regression model performance on holdout data. This addresses an important need in the ML field as human performance on multi-dimensional data is poor and cannot be used to bootstrap regression model performance,9,10 an approach that is common when developing ML systems for image analysis.7,8 The coefficient of determination upper bound (model performance) for regression analysis is:
Our case studies demonstrate how calculating the
To conclude, our method for estimating upper bounds for model performance on holdout data should aid researchers from diverse fields in developing ML regression models that reach their maximum potential.
Supplemental Material
sj-pdf-1-bbi-10.1177_11779322211020315 – Supplemental material for Performance of Regression Models as a Function of Experiment Noise
Supplemental material, sj-pdf-1-bbi-10.1177_11779322211020315 for Performance of Regression Models as a Function of Experiment Noise by Gang Li, Jan Zrimec, Boyang Ji, Jun Geng, Johan Larsbrink, Aleksej Zelezniak, Jens Nielsen and Martin KM Engqvist in Bioinformatics and Biology Insights
Footnotes
Funding:
The author(s) disclosed receipt of the following financial support for the research, authorship, and/or publication of this article: GL and JN have received funding from the European Union’s Horizon 2020 research and innovation program under the Marie Skłodowska-Curie program, project PAcMEN (grant agreement no. 722287). JN also acknowledges funding from the Novo Nordisk Foundation (grant no. NNF10CC1016517), the Knut and Alice Wallenberg Foundation. JZ and AZ are supported by SciLifeLab funding. The computations were performed on resources at Chalmers Centre for Computational Science and Engineering (C3SE) provided by the Swedish National Infrastructure for Computing (SNIC).
Declaration of conflicting interests:
The author(s) declared no potential conflicts of interest with respect to the research, authorship, and/or publication of this article.
Author Contributions
GL and MKME conceptualized the research. GL and JG mathematically derived the
Availability of Data and Materials
The tome package is available on GitHub (https://github.com/EngqvistLab/Tome/). The annotated Topt values and sourceorganism OGTs for enzymes in the BRENDA and CAZy databases are available as flatfiles on Zenodo (https://zenodo.org/record/3578468#.XffgbpP0nOQ, DOI: 10.5281/zenodo.3578467). Other scripts and datasets are available on GitHub (![]() ).
).
Supplemental Material
Supplemental material for this article is available online.
References
Supplementary Material
Please find the following supplemental material available below.
For Open Access articles published under a Creative Commons License, all supplemental material carries the same license as the article it is associated with.
For non-Open Access articles published, all supplemental material carries a non-exclusive license, and permission requests for re-use of supplemental material or any part of supplemental material shall be sent directly to the copyright owner as specified in the copyright notice associated with the article.