
Abstract
The TempO-Seq S1500+ platform(s), now available for human, mouse, rat, and zebrafish, measures a discrete number of genes that are representative of biological and pathway co-regulation across the entire genome in a given species. While measurement of these genes alone provides a direct assessment of gene expression activity, extrapolating expression values to the whole transcriptome (~26 000 genes in humans) can estimate measurements of non-measured genes of interest and increases the power of pathway analysis algorithms by using a larger background gene expression space. Here, we use data from primary hepatocytes of 54 donors that were treated with the endoplasmic reticulum (ER) stress inducer tunicamycin and then measured on the human S1500+ platform containing ~3000 representative genes. Measurements for the S1500+ genes were then used to extrapolate expression values for the remaining human transcriptome. As a case study of the improved downstream analysis achieved by extrapolation, the “measured only” and “whole transcriptome” (measured + extrapolated) gene sets were compared. Extrapolation increased the number of significant genes by 49%, bringing to the forefront many that are known to be associated with tunicamycin exposure. The extrapolation procedure also correctly identified established tunicamycin-related functional pathways reflected by coordinated changes in interrelated genes while maintaining the sample variability observed from the “measured only” genes. Extrapolation improved the gene- and pathway-level biological interpretations for a variety of downstream applications, including differential expression analysis, gene set enrichment pathway analysis, DAVID keyword analysis, Ingenuity Pathway Analysis, and NextBio correlated compound analysis. The extrapolated data highlight the role of metabolism/metabolic pathways, the ER, immune response, and the unfolded protein response, each of which are key activities associated with tunicamycin exposure that were unrepresented or underrepresented in one or more of the analyses of the original “measured only” dataset. Furthermore, the inclusion of the extrapolated genes raised “tunicamycin” from third to first upstream regulator in Ingenuity Pathway Analysis and from sixth to second most correlated compound in NextBio analysis. Therefore, our case study suggests an approach to extend and enhance data from the S1500+ platform for improved insight into biological mechanisms and functional outcomes of diseases, drugs, and other perturbations.
Introduction
High-throughput transcriptomic (HTT) approaches enable genomic screening that can elucidate gene expression alterations under a range of conditions, such as disease states, chemical exposures, and other experimental perturbations. To produce transcriptomic data on a large number of samples at a rapid pace, targeted assays have been developed that allow a much greater degree of multiplexing compared to traditional RNA-Seq methods. TempO-Seq has emerged as a targeted alternative to traditional RNA-Seq, 1 and it is gaining popularity in research endeavors with a toxicogenomic component within the US federal government, academic institutions, and research institutes and initiatives throughout Europe (eg. EuToxRisk).2-4 TempO-Seq is a ligation-based expression profiling assay that does not require RNA purification, complementary DNA (cDNA) synthesis, or capture of targeted RNA. 1 These advancements make TempO-Seq more amenable to HTT study designs that require sensitive transcriptomic detection from thousands of cells.
HTT assays such as TempO-Seq can be used to measure the whole transcriptome as well as any subset of carefully selected genes, such as the S1500+ gene set in multiple species of interest. 5 The human S1500+ gene set was created as a transcriptomic subset representative of a biologically diverse collection of genes that also are hubs of highly correlated gene clusters; the selection process for this gene set involved a hybrid of data-driven procedures and expert nomination. 6 Measurement of the ~3000 genes within the S1500+ gene set can be used to accurately predict human pathway perturbations and biological relationships.6,7 Co-expression patterns from large repositories of microarray and RNA-Seq data can be used in conjunction with this gene set to extrapolate (computationally infer) expression for the rest of the non-measured transcriptome. 6 The use of extrapolation provides researchers with whole genomic coverage through an efficient and accurate targeted expression system.
A principal component (PC) regression approach 8 for extrapolation was suggested with the release of the S1500+ gene set. 6 The methodology originally performed extrapolation in the fold change space but has since been updated and optimized to extrapolate gene expression values rather than simply fold change values. 9
Here, we explore the utility of this extrapolation approach by comparing differentially expressed gene (DEG) and differentially enriched pathway (DEP) calls from an analysis of a TempO-Seq human S1500+ dataset with and without extrapolation applied to the set of measured genes. We also assess the validity of conclusions drawn from downstream analyses with the inclusion of extrapolated gene expression values by performing literature searches. For this case study, we use data on a widely studied endoplasmic reticulum (ER) stress inducer, tunicamycin, in cell cultures derived from cryopreserved primary human hepatocytes (PHH).
Materials and Methods
Complete dataset
The dataset included cryopreserved PHH samples from 54 donors, which were provided by KaLy-Cell (Plobsheim, France). Primary human hepatocytes (PHHs) were thawed using Universal Cryopreservation Recovery Medium (UCRM; IVAL, Columbia, MD, USA), seeded in Universal Primary Cell Plating Medium (UPCM; IVAL) at a density of 70 000 viable cells per well in 96-well BioCoat Corning Collagen I Cellware plates (Corning, Wiesbaden, Germany) and cultured in a 5% CO2 humidified incubator at 37°C. After attachment, media was refreshed using UPCM medium. Cells were treated using one of the four compounds: diethyl maleate, tunicamycin, cisplatin, and tumor necrosis factor alpha (TNFα), for 8 hours at 6 concentrations, beginning 24 hours after plating in William’s E medium supplemented with 100 U/mL penicillin and 100 µg/mL streptomycin. Controls included one untreated sample (untreated control) and one 0.2% dimethyl sulfoxide (DMSO)-treated sample (solvent control) per donor on a plate. Each plate contained samples for 3 donors with no replicates, and there were 3 replicate plates per donor triplicate. After exposure, cells were washed with phosphate-buffered saline (PBS) and lysed with 1× TempO-Seq lysis buffer. Each plate also contained media-only samples with no cells (media-only control) and MicroArray/Sequencing Quality Control (MAQC/SEQC) consortium’s Universal Human Reference RNAs (BioSpyder and Leiden) samples for sequencing and processing controls for TempO-Seq analysis. Samples were stored at −80°C until shipment to BioSpyder Technologies (Carlsbad, CA, USA) for performing their targeted RNA sequencing approach, TempO-Seq. 1 Supplemental Figure 1 depicts the layout of a sample 96-well plate from this study. The TempO-Seq S1500+ human platform, which consists of 2982 probes (Supplemental Table 1), was used to generate these data (https://ntp.niehs.nih.gov/results/tox21/s1500-gene-set-consensus-strategy-index.html). 6
Alignment
FASTQ files of TempO-Seq reads were aligned to the probe sequences from the target platform using Bowtie version 1.2.2 10 with the following parameters: -v 2 -k 1 -m 1–best–strata–trim3 1. This configuration allows up to 2 mismatches and reports the single best alignment. The “–trim3 1” parameter was included to ensure that bowtie will align reads in files with read length = 51 bp to the 50 bp known probe sequences. After alignment, the total sequenced reads and the percentage of reads aligning to the platform manifest were computed.
Quality checks and outlier removal
Samples were flagged and removed from the analysis for values below the following thresholds (Supplemental Figure 2): sequencing depth <100 K, alignment rate <40%, number of aligned reads <100 K, percent of probes with at least five reads <50%. Requiring 100 K reads with 40% aligning to the S1500+ probes is lenient but does filter out samples with obvious sequencing errors in the left tail of the distribution (Supplemental Figure 2). Filtering on the percent of expressed probes eliminates biased samples where the sequenced reads only reflect a small portion of the measured transcriptome. Each TempO-Seq assay or study may require specific tuning of QC thresholds taking into account various elements including but not limited to targeted sequencing depth, number of probes present in assay, and severity of RNA degradation that might be caused by chemical exposure. For example, the threshold value of 50% for percent of probes with at least 5 reads may be reasonable for the S1500+ platform but may be stringent for an assay that measures the whole transcriptome at low sequencing depth.
FastQC 11 was additionally run on all samples to ensure adequate per base quality and per base N content. The quality control (QC) assessment was performed on the full dataset (all chemicals and doses) to identify problematic plates. On plate 53, 94% of all study samples did not pass the quality criteria. Consequently, plate 53 was removed from the rest of the analysis. Note that plates 52, 53, and 54 each contained one replicate from the same set of donors (S1506T, M1367T, and S1379T). Therefore, after removing plate 53, 2 replicates from each of these donors were still available for the analysis.
The QC assessment on the full dataset (all chemicals and doses) also aided in ascertaining sample handling and consistency of the readouts from the same donor. We observed that PHH donors B1463T (Donor ID #25), S1503T (Donor ID #46), and S1501T (Donor ID #12) did not plate well overall based on the sequencing QC metrics, with 99%, 69%, and 46% of samples flagged, respectively. Therefore, all samples from these three donors were removed.
Tunicamycin case study data subset
The original study design included multiple dose exposures of four compounds along with DMSO as control, measured in triplicate per donor, distributed across a total of 56 (96-well) plates. All samples were collectively used during QC, normalization, and extrapolation process. As the core focus of this manuscript is assessing utility and performance of whole transcriptome extrapolation, only data from the highest tunicamycin exposure concentration (10 µM) as well as DMSO samples that passed QC assessment were used during subsequent downstream analyses (ie, only 318 samples corresponding to 3 treated/untreated replicate pairs from 51 donors and 2 treated/untreated replicates from 3 donors is used). We chose Tunicamycin for this case study because (1) tunicamycin is known to elicit robust mode of action and (2) it is the most studied of the 4 chemicals in terms of available published literature characterizing its mode of action and thus providing us with an opportunity to benchmark our analysis against published information.
Quality checks and outlier removal on tunicamycin case study
After quality flagging using the criteria above (Supplemental Figure 2: sequencing depth <100 K, alignment rate <40%, number of aligned reads <100 K, percent of probes with at least five reads <50%) and FastQC 11 checks, 46 samples in the Tunicamycin subset (22 tunicamycin and 24 DMSO) were removed. This included all (3 of 3) tunicamycin (10 μM) and 2 of 3 DMSO samples on plate 53. The removal of plate 53 led to one additional DMSO sample being removed from the Tunicamycin subset. The removal of donors B1463T (Donor ID #25), S1503T (Donor ID #46), and S1501T (Donor ID #12) led to the removal of one additional tunicamycin (10 μM) sample and 2 additional DMSO control samples from the analysis.
None of the remaining samples clustered separately from the rest of the data in principal component analysis (PCA) plots (Supplemental Figure 3). After sequencing QC and outlier detection procedures as described above, there were 268 samples (136 tunicamycin [10 μM] samples and 132 DMSO controls) at 8 hours for downstream analysis.
Normalization
Gene expression values were normalized at the gene level by applying reads per million normalization performed in GeniE. 9 A pseudo-read-count of 1.0 was added to each normalized expression value, and then, the values were log2 transformed.
Extrapolation
Extrapolation to the whole transcriptome (~26 K genes) was performed using GeniE.6,9 This approach incorporates PC regression 8 and has been updated to use a quality-filtered subset (reduced from 125 501 to 64 514 samples) of a large collection of publicly available RNA-Seq data 12 to train the model. Filtering criteria for the training data required samples to meet the following minimum thresholds: 1 000 000 aligned reads, non-zero expression for 35% of whole transcriptome genes, and non-zero expression for 35% of species-specific S1500+ genes. Samples were also required to have 90% of the total reads mapped to at least 1000 genes. The training dataset included 25 599 genes.
Gene and pathway analysis
A customized implementation of conventional Gene Set Enrichment Analysis (GSEA) was employed to simultaneously identify DEG and corresponding DEP 13 as implemented in GeniE. 9 For this project, we used modified 2-sided Student’s t-test statistics for an analysis with donor as a blocking factor (ie, the permutations for the t-statistic and P value calculations for treated vs control was handled per donor to account for donor effect) to measure gene-level differential activity and performed GSEA tests on all Canonical Pathways (C2-CP) and Hallmark pathways from the Molecular Signature Database (MSigDB version 6.2), for which 5 or more genes were present in the assay.14,15 The significant P values, false detection rate, and family-wise error rate (FWER) for gene-/pathway-level activity were computed using 10 000 random permutations of sample labels. False detection rate and FWER calculations were performed separately for all pathways/signatures within each subcategory using GeniE. 9 For a gene to be considered a significant DEG, it was required to have absolute fold change > 1.5 and FWER ⩽ 0.05. Similarly, a significant DEP required absolute Normalized Enrichment Score (NES) > 1.5 and FWER ⩽ 0.05.
DAVID, ingenuity pathway, and NextBio analyses
DAVID analysis, 16 Ingenuity Pathway Analysis (IPA), 17 and NextBio analysis 18 were performed using the significant DEG list (for DAVID and IPA) or fold changes and FWER values (for NextBio) as input for each tool. In the case of measured only analyses, a total of 2711 genes were used as background. For whole transcriptome analysis, the set of measured + extrapolated genes (25 684 genes) were used as background.
DAVID version 6.8 19 , 20 was used with DEG lists as input to determine differentially enriched UniProt Keywords. Keywords were only considered if they were supported by a minimum of 5 genes with expression data and were considered significant for Bonferroni-corrected P value ⩽.05. Ingenuity Pathway Analysis was performed by standard approaches, 17 where analyses were run to identify significant upstream regulators and enriched pathways. Finally, to determine the most positively correlated compounds, NextBio Pharmaco Atlas was run using foldchange and FWER values for all measured or all whole transcriptome (measured + extrapolated) genes as expression biosets.
Analysis workflow
The tunicamycin dataset was run through a full analysis workflow that began with alignment of human S1500+ FASTQ files, QC, detection and removal of outlier samples, conversion of TempO-Seq probes to their Entrez gene IDs, and normalization and log2 transformation. The workflow then continued with an extrapolation step performed to infer expression values of the unmeasured transcriptome, which yielded a whole transcriptome consisting of ~26 K total (measured + extrapolated) genes.
After extrapolation, 2 versions of the dataset were maintained and propagated through the remaining analysis steps. These 2 datasets consisted of normalized log2 transformed expression values for (1) S1500+ measured genes only (termed “measured only” dataset, a total of 2711 genes) and (2) the “whole transcriptome” (measured + extrapolated genes, a total of 25 684 genes). The values were derived from the same 268 samples (136 tunicamycin 10 μM samples and 132 DMSO controls) for both datasets.
The last steps of the analysis workflow were performed separately on each resulting dataset. These steps involved DEG and DEP analyses, including GSEA, DAVID, IPA, and NextBio. Results of the analyses for the whole transcriptome (measured + extrapolated genes) data were then compared to the results based on only the measured S1500+ genes.
Results
Comparison of DEGs
DEGs in tunicamycin-treated versus control hepatocytes from 54 donors were identified directly from the S1500+ gene set data values (2711 genes) or were identified from the measured + extrapolated gene values to include the whole transcriptome (25 684 genes total, including the 2711 measured genes). Comparison of the direct and expanded DEG sets revealed that extrapolation increased the number of identified DEGs by almost 50% (Figure 1).
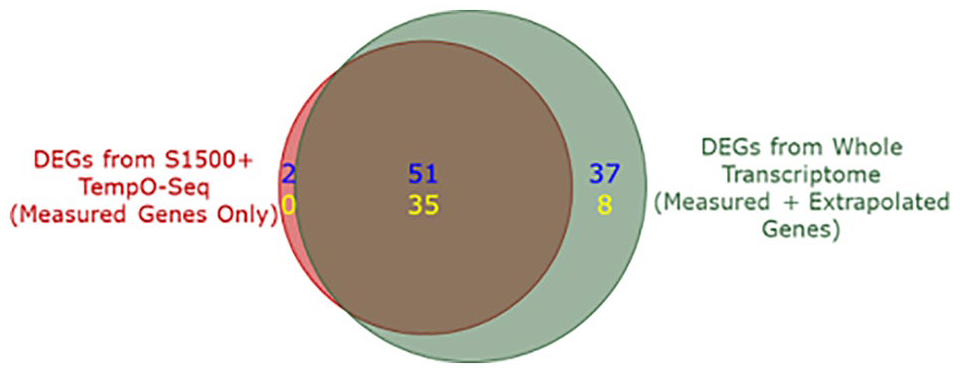
Venn diagram of DEG counts (absolute foldchange > 1.5 and FWER ⩽ 0.05) with and without extrapolation. Counts are broken down into upregulated (blue) and downregulated (yellow) DEGs. DEG indicates differentially expressed gene and FWER indicates family-wise error rate.
Note that 86 measured genes were identified as significant DEGs in both versions of the analysis (with and without extrapolation), while 2 measured genes were significant only if extrapolation was not used, because of the greater impact of multiple testing correction on P values when applied to a larger (measured + extrapolated) versus smaller (measured only) transcriptome. When ranking the measured only significant gene list by FWER (corrected P value), these 2 genes (DDIT4 and GBP5) were the last 2 (ie, least significant). The FWER for DDIT4 and GBP5 was 0.0321 and 0.0355 in measured only analysis, while the FWER increases to 0.0758 and 0.0858 in the measured + extrapolated analysis, leading to those 2 genes not being considered significant per the significance criteria used as described above. However, extrapolating to the whole transcriptome identified a greater number of DEGs overall (131 total DEGs, including 45 DEGs that were identified exclusively in the whole transcriptome analysis, ie, extrapolated genes). If an uncorrected P value was used as a cutoff, all 88 DEGs from the measured only analysis would be identified as significant DEGs after extrapolation (data not shown).
There was an almost complete separation of DMSO and tunicamycin-treated samples in the first 2 PCs, both before and after extrapolating to the whole transcriptome. In addition, a similar percent of variance was captured by these PCs before and after extrapolation (Figure 2A). This provides evidence that DEGs generated from extrapolating to the whole transcriptome maintain a similar level of sample variability present in the original measured data. In addition, overall upregulation and downregulation patterns observed from just the measured DEGs were preserved after the addition of the extrapolated DEGs (Figure 2B). Clustering of samples on the horizontal axis and genes on the vertical axis (88 in the Measured Genes Only Panel and 131 in the Measured + Extrapolated Panel) appeared similar with and without the inclusion of gene expression values for extrapolated genes. Furthermore, both gene-level and sample-level diversity was preserved after extrapolation.
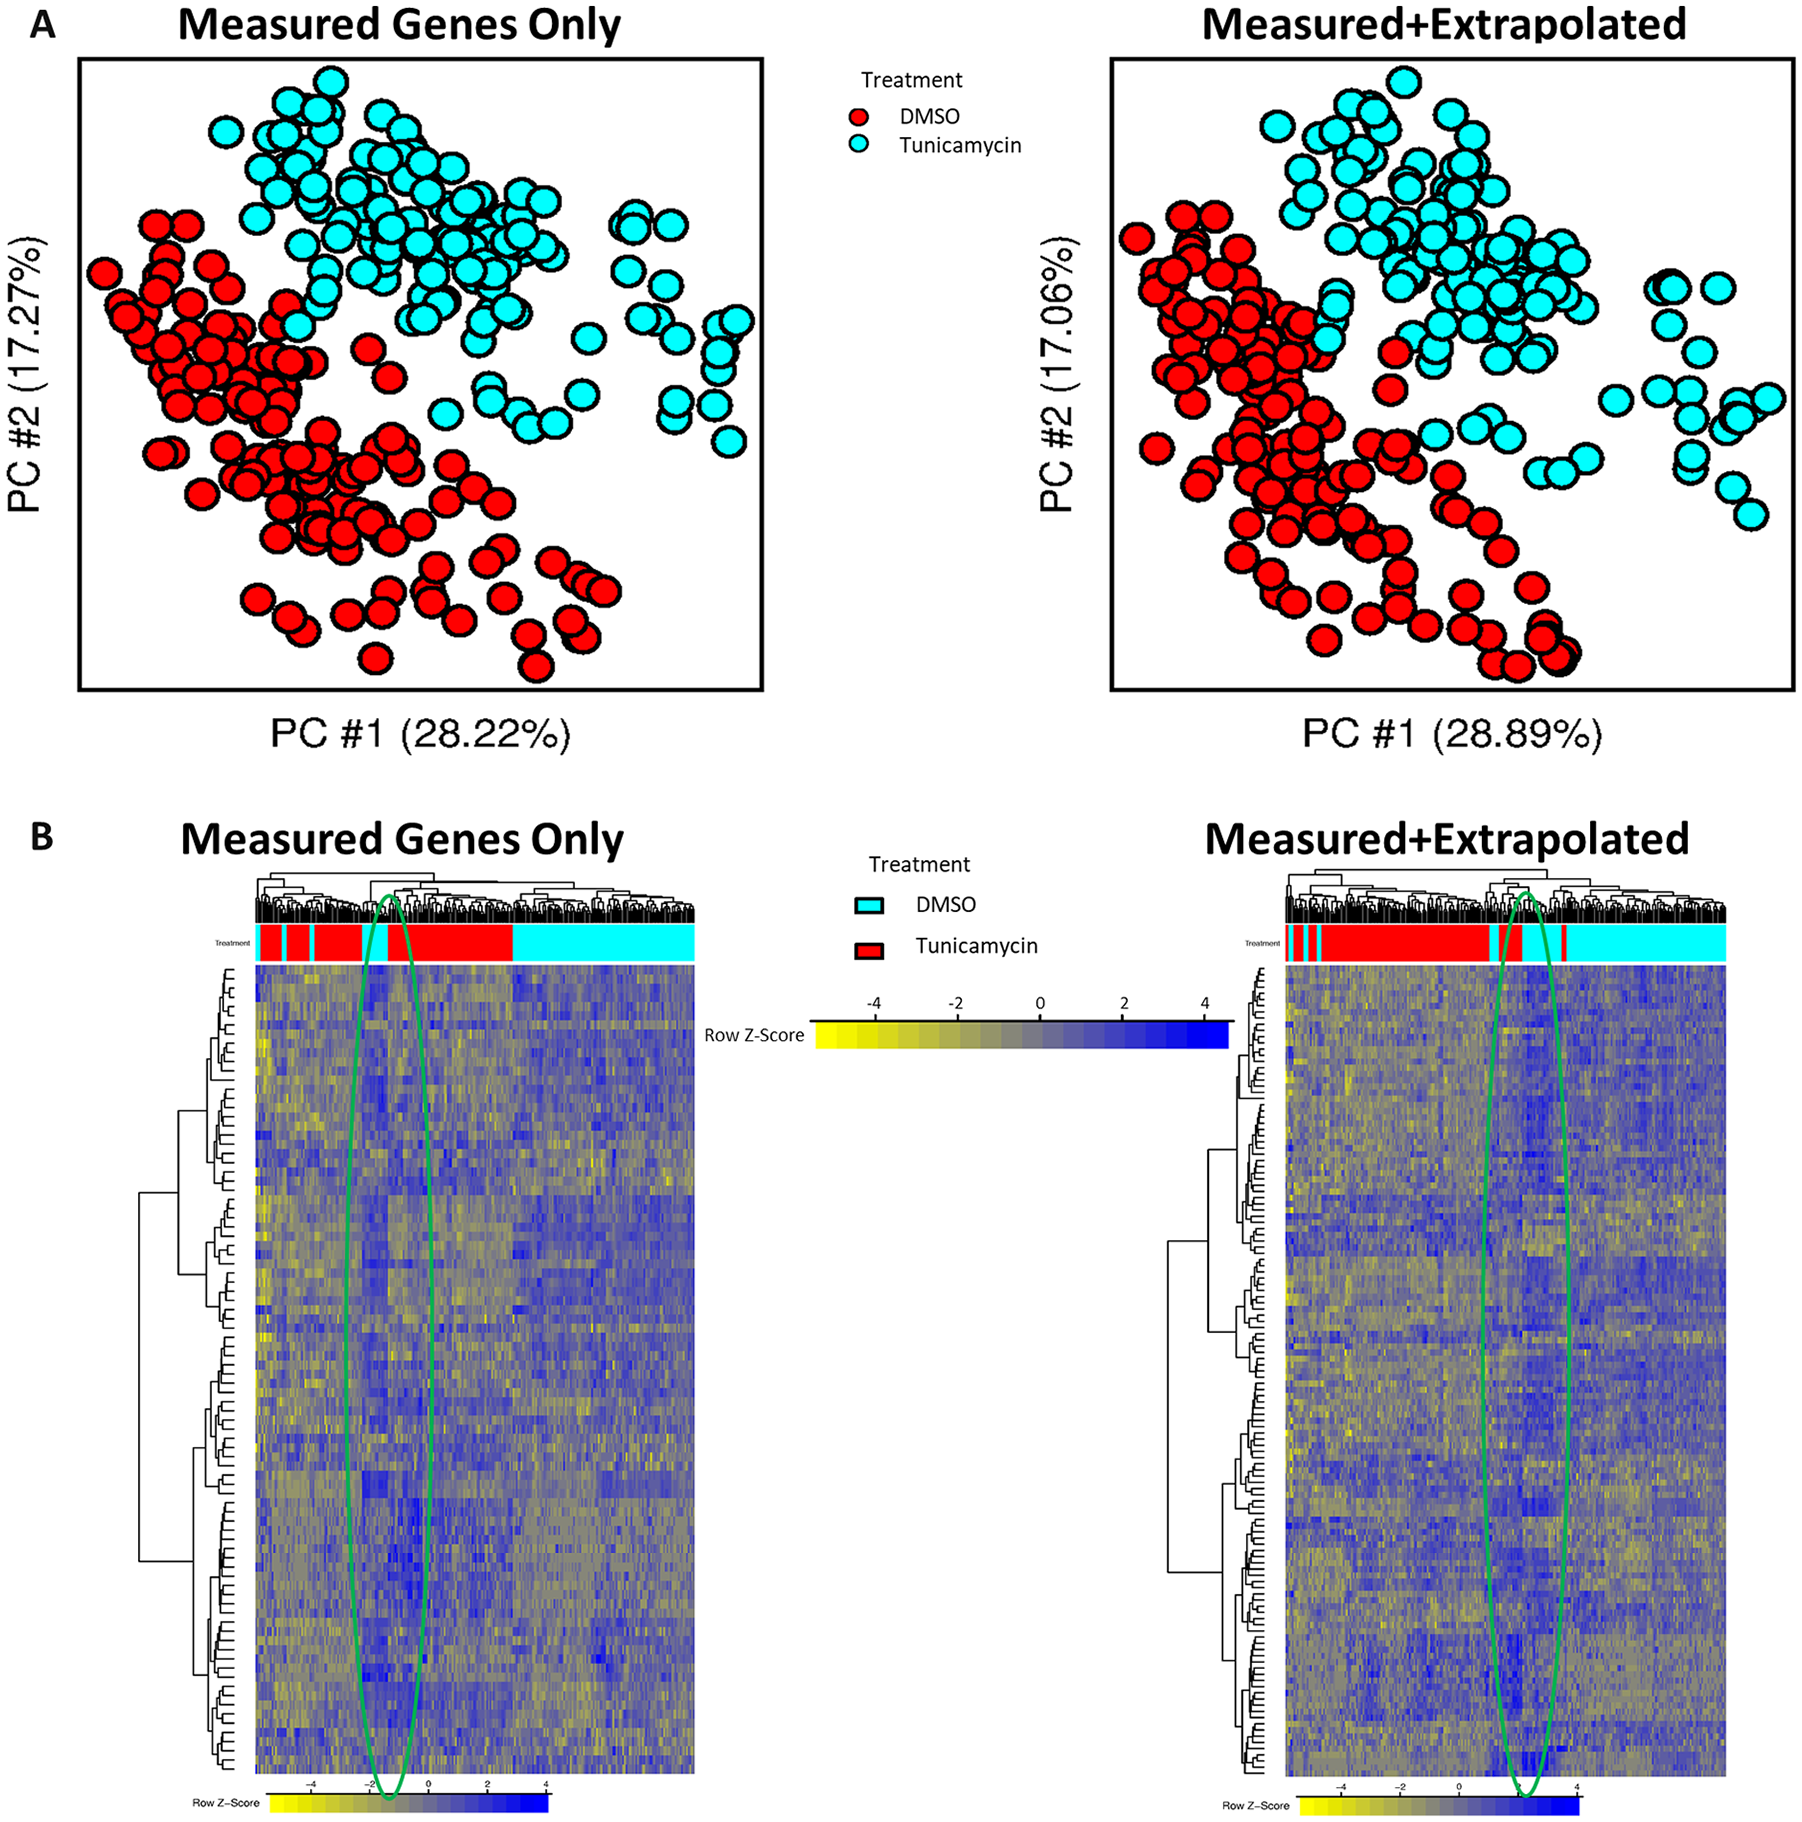
(A) Scatter plot of the first 2 PCs before and after extrapolation. Each dot represents gene expression of a sample based only on the significant DEGs. Values on the x- and y-axes represent the proportion of sample variance explained by the first and second PC, respectively. (B) Expression heatmap of significant DEGs with genes as rows and samples as columns. A band of highly sensitive tunicamycin-treated and DMSO-treated donors is shown circled in green. DEG indicates differentially expressed gene; PC, principal component; DMSO, dimethyl sulfoxide.
To further assess the biological functionality of the whole transcriptome DEGs stemming from extrapolated genes, a literature search was performed for the 45 additional DEGs (37 upregulated and 8 downregulated) that were not represented on the S1500+ platform but were found to be differentially expressed within the whole transcriptome data. Publications related to these genes were identified by searching keywords in PubMed and by assessing Genetic Markers that were recovered from a NextBio 18 search of the term “tunicamycin” (Table 1). The vast majority of these DEGs have already been linked to tunicamycin treatment in one or more previous studies. The literary evidence also confirmed that these genes were regulated in the same direction in response to tunicamycin as estimated by extrapolation, regardless of variations in the dose of tunicamycin, the species, or the tissue of origin. Other DEGs identified by extrapolation may have eluded our literature search, may represent false positives, or may suggest the potential for new discoveries based on this approach.
Upregulated and downregulated genes (absolute foldchange > 1.5 and FWER ⩽ 0.05) from the extrapolated analysis that were not measured in the study.

Published literature evidence stems from a search of PubMed. The NextBio 18 column cites studies (Bioset data) from a Genetic Markers search on the term “tunicamycin” that measured expression of a gene with absolute foldchange > 1.5, P value ⩽ .05, and matching up or down direction in hepatocytes or other liver cells.
GSEA pathway analysis
For further comparison between the measured only and whole transcriptome (measured + extrapolated) DEGs, GSEA pathway analysis was performed. Seventeen significant pathways were captured for the whole transcriptome data, as opposed to 7 total significant pathways for the measured only data (Table 2). Three pathways were common between these 2 datasets (HALLMARK_UNFOLDED_PROTEIN_RESPONSE, REACTOME_DIABETES_PATHWAYS, and REACTOME_UNFOLDED_PROTEIN_RESPONSE). Interestingly, the NES and FWER values remained relatively consistent for these 3 pathways (2.03-2.29), despite the addition of extrapolated expression values for more than twice as many genes for each pathway. Additional pathways identified only after extrapolation (ie, only in the whole transcriptome data) included 3 pathways related to metabolism: KEGG_DRUG_METABOLISM_CYTOCHROME_P450 (FWER = 0.0059), KEGG_METABOLISM_OF_XENOBIOTICS_BY_CYTOCHROME_P450 (FWER = 0.0123), and KEGG_RETINOL_METABOLISM (FWER = 0.0472); the same pathways did not achieve significant FWER values when measured only genes were used for GSEA (FWER = 0.0909, 0.0582, and 0.2084, respectively; data not shown). To further interpret these findings, we searched the Comparative Toxicogenomics Database (CTD) for pathways related to tunicamycin exposure. Interestingly, the top 3 pathways for tunicamycin exposure in CTD (http://ctdbase.org/detail.go?type=chem&acc=D014415, Supplemental Table 2) are also metabolism/metabolic pathways. 45 These results support the premise that additional pathways identified by extrapolating to the whole transcriptome for pathway analyses may help broaden the scope of biological interpretation of data, in this case to better understand biological response to tunicamycin treatment.
A list of significant MSigDB gene sets (absolute NES > 1.5 and FWER ⩽ 0.05) resulting from GSEA pathway analysis of measured only and measured + extrapolated data.

Blue text indicates pathways that were significant in both analyses. The column with “# Genes in Pathway (Measured + Extrapolated)” represents the full size of the pathways; in other words, all genes in that pathway regardless of inclusion in the S1500+ gene set. While conducting the GSEA for the measured only data, the background transcriptome was limited to the total measured genes, and similarly, while conducting GSEA for whole transcriptome (measured + extrapolated) data, the background was adjusted to measured + extrapolated genes “# Genes in Pathway Annotation” represents the total number of genes annotated in the pathway in MSigDB.
Further examination of the significant pathways identified from GSEA of whole transcriptome (measured + extrapolated) data (Table 2, first 17 pathways) revealed that approximately 60% of the genes in each of these pathways were extrapolated. For some of the smaller pathways on the list that are known to be biologically relevant, the parallel analysis based on measured genes only relied on too few genes to capture statistical significance, causing them to be false negatives. For example, “KEGG_N_GLYCAN_BIOSYNTHESIS” (NES = 1.96, FWER = 0.0463 for whole transcriptome; Table 2), which also is listed in CTD as a pathway that is associated with tunicamycin exposure (Supplemental Table 2), only had 6 genes measured on the S1500+ platform but had 40 extrapolated genes. While the measurements based on these 6 genes showed moderate upregulation in the measured genes only analysis (NES = 1.62), the corrected P value (FWER = 0.6419) did not approach the significance threshold. Thus, without adding extrapolated expression values for the whole transcriptome, the analysis was underpowered to identify significance for a pathway with so few measured genes.
Similar effects can be seen for the “PID_ECADHERIN_KERATINOCYTE_PATHWAY” (NES = −2.13, FWER = 0.0031; Table 2), which is within the top 3 pathways identified by GSEA pathway analysis of the whole transcriptome (measured + extrapolated). This smaller pathway comprises genes related to cellular adhesion that have been previously associated with tunicamycin response.46,47 The measured analysis, which was based on only 12 genes (NES = −1.89, FWER = 0.0983), was not able to meet the significance threshold without the addition of the extrapolated genes.
Many other DEPs in the whole transcriptome analysis in Table 2 have evidentiary support linking the pathways to tunicamycin treatment, further supporting the idea that they were false negatives in the measured only analysis. For example, pathways that were enriched in the whole transcriptome analysis are related to ATF4 and PERK, which are each known to be upregulated in the presence of tunicamycin.21,26,34,42,48 The downregulation of the “HALLMARK_ANGIOGENESIS” pathway is consistent with the inhibition of angiogenesis by tunicamycin in mice. 49 In addition, regulation by tunicamycin of Cytochrome P450 metabolism and N-glycan/N-linked glycosylation expression is supported by previous research findings.49-51 In fact, “REACTOME_ASPARAGINE_N_LINKED_GLYCOSYLATION” is the 20th pathway hit in CTD for tunicamycin (Supplemental Table 2).
Table 2 also shows a total of four pathways (namely, HALLMARK_HYPOXIA, HALLMARK_MTORC1_SIGNALING, HALLMARK_TGF_BETA_SIGNALING, and HALLMARK_PI3K_AKT_MTOR_SIGNALING) that were significant when only measured S1500+ genes were used, but not significant when extrapolated genes were added to the analysis. A few possible reasons for this could include the following: (1) extrapolation significantly increases the size of a given pathway, as evident by “#Genes (extrapolated)” column in Table 2. This can result in a lower degree of enrichment of differential activity relative to extended pathway coverage resulting from extrapolation. In other words, when pathway size is increased due to extrapolation, and if additional genes are not highly differentially expressed, it may lower the NES for a given pathway. (2) If the extrapolation is noisier for certain genes belonging to a given pathway, it could possibly impact the pathway analysis results.
However, our results indicated that in most (3 of 4) cases we only see a marginal shift in normalized enrichment score values; however, the FWER values for the same pathways are slightly increased such that it is above the significance threshold. (NES = 1.60, 1.76, and −1.74 and FWER = 0.2484, 0.1013, and 0.1293, for HALLMARK_HYPOXIA, HALLMARK_MTORC1_SIGNALING, and HALLMARK_TGF_BETA_SIGNALING pathways, respectively). Given that the NES values in measured + extrapolated analysis are above the significance threshold indicates that these pathways still display differential activity in both measure and measured + extrapolated analyses; however, the FWER P values lose significance in whole transcriptome analysis for the reasons discussed above. For these reasons, these pathways are not likely to be false positives in the analysis with just measured S1500+ genes. The addition of extrapolated genes to the analysis just downweighs the importance of these pathways when it brings to light the 14 additional pathways discussed above.
DAVID keyword analysis
As a complementary approach to functional analysis of the measured and whole transcriptome (measured + extrapolated) DEG sets, we employed DAVID analysis, which is based on keywords associated with sets of genes. The analysis yielded only four keywords for the measured only dataset, but nine keywords for the whole transcriptome dataset. Furthermore, the majority of the keywords from the measured only dataset (three out of four) were also captured for the whole transcriptome data (Table 3). The exception was “Glycoprotein,” which did not make the significance cutoff when the extrapolated genes were added, with a fold enrichment of 1.59 and a Bonferroni-corrected P value of 0.1093. Glycoprotein as keyword, per definition by DAVID, is a very large category, and it is mapped to several thousand genes. From the total 88 DEGs identified in measured only analysis, 38 are part of Glycoprotein category (38 of 88 or 43%), and a total of 659 genes from Glycoprotein category are among the 2678 total S1500+ measured genes (659 of 2711 or 24%). Whereas from the total of 131 DEGs found in whole transcriptome analysis, 48 genes are part of the Glycoprotein category (48 of 131 or 37%), and a total of 4421 genes from whole transcriptome are mapped to Glycoprotein (4421 of 25 684 or 17%). Given that Glycoprotein is a very large category, and because a large majority of DEGs (38 out of 48) were part of the S1500+ measured gene list, it only appears as a significant result in measured only analysis. When the transcriptome is expanded via extrapolation, the P value for Glycoprotein does not remain significant.
Partial output from DAVID 16 for enriched (Bonferroni-adjusted P value ⩽0.05) keywords for measured only and whole transcriptome (measured + extrapolated) analyses.

Blue text indicates keywords that are significant in both analyses.
Some of the keywords that came up only after extrapolating to the whole transcriptome (ie, “Endoplasmic reticulum” and “Unfolded protein response”) indicate the primary location and use of tunicamycin. Tunicamycin is widely acknowledged to induce stress in the ER and activates the unfolded protein response (UPR) in many studies.35,42,49 The “Unfolded protein response” keyword is also a small and specific category with only 11 measured genes and 35 measured + extrapolated genes. The additional 24 genes were necessary in this case to capture the significance of this keyword.
The keywords “Stress response” and “Cytokine” also have evidence in CTD (21st pathway hit is REACTOME Cellular responses to stress and 37th pathway is REACTOME Cytokine Signaling in Immune system, Supplemental Table 2). Thus, these findings provide additional support for the accuracy and utility of extrapolated data in downstream biological interpretation.
IPA pathway analysis
Next, we used IPA to functionally annotate the DEG regulatory networks. Using DEGs from the measured set only, tunicamycin was the third upstream regulator identified in IPA. Furthermore, using DEGs from the whole transcriptome analysis (measured + extrapolated genes), tunicamycin was the top upstream regulator (Table 4). These results indicate that the addition of extrapolated genes led to an expression pattern most indicative of tunicamycin treatment.
IPA results (top 5) for canonical pathways and upstream regulators based on analysis of the measured only and measured + extrapolated gene sets.

Blue text indicates pathways and regulators that are in the top 5 in both analyses. The results of “tunicamycin” are in bold.
Notably, a key pathway related to the use of tunicamycin, the “Endoplasmic Reticulum Stress Pathway,” only shows up in the top 5 IPA pathways when extrapolated genes are included in the analysis. Likewise, a connection to the immune response (“Communication between Innate and Adaptive Immune Cells”) was among the top 5 canonical pathways identified using the whole transcriptome gene set but not the measured only gene set. Consistently, a role for immune response to tunicamycin is supported by the identification of the Reactome “Immune System” in the top 5 pathways for tunicamycin in CTD (Supplemental Table 2).
We also noted that all P values were lower (ie, pathways and upstream regulators were more significant) after extrapolating to the whole transcriptome, thus indicating that the biological interpretation of data is both broadened and improved in its statistical significance when extrapolation is carried out prior to functional analysis of S1500+ data.
NextBio correlated compound analysis
Finally, we used NextBio 18 to identify the most positively correlated compounds (exposure datasets) using either the measured only dataset or whole transcriptome (measured + extrapolated) dataset as input to Pharmaco Atlas analysis in NextBio. Results indicate that tunicamycin was the sixth most correlated compound identified when only measured genes were used as input. However, when the whole transcriptome was used as input, tunicamycin was the second most correlated compound (Table 5). While one would expect to identify tunicamycin as the top ranked compound in the NextBio analyses, the addition of extrapolated genes does increase both the rank (from 6 to 2) and the score (from 80 to 96) of tunicamycin (Table 5). The only compound to score higher than tunicamycin for the whole transcriptome data was Thapsigargin, the most comparable chemical to tunicamycin in CTD (http://ctdbase.org/detail.go;jsessionid=89CE02187BDB52F4E67C412361CEE84E?type=chem&acc=D014415&view=similarActor). These results indicate that the addition of extrapolated genes led to an expression pattern more indicative of tunicamycin treatment in independent studies within NextBio.
NextBio results (top 6) for most positively correlated compounds from Pharmaco Atlas tab based on analysis of the measured only and measured + extrapolated gene sets.

The “Score” is calculated relative to the score of the most significant result (with score 100). “No. Studies” column lists the number of studies in the search engine that have a significant correlation to the input data. Blue text indicates compounds that are listed in the table in both analyses. The result “tunicamycin” is in bold.
It is also noted that there was one additional study that had tunicamycin RNA expression data significantly correlated with measured only input compared to whole transcriptome (measured + extrapolated) input (15 vs 14 under “No. Studies” column in Table 5). However, when only measured genes were used, there was higher correlation with other compounds, leading to the lower overall score.
Two compounds were found to be significant when only the measured S1500+ genes were used but not with the inclusion of extrapolated genes. Both of these compounds, Spiperone and Gossypol, were only correlated based on the analysis of data from one study. Spiperone, the top hit when extrapolated genes are not included in the NextBio analysis, is an antipsychotic drug with mechanisms related to dopamine regulation and neurotransmitter transport. 52 A preliminary literature review did not point to any obvious link between Spiperone and Tunicamycin, but Spiperone was found to be related to mechanisms of Thapsigargin (ie, calcium inhibition). 53
NextBio’s compound signatures and corresponding mechanism of action mapping database is proprietary. Furthermore, the significant P values for correlation scores are not readily provided so it is not feasible to assess whether differential activity from one Gossypol study can be considered false positive or not. It is possible that this finding might still be captured in measured + extrapolated analysis but does not show up in the top hits.
Discussion
Measurement of expression values for roughly ~3 K genes using the S1500+ platform can be a good surrogate for the whole transcriptome 6 ; however, the rich history of annotated pathways provides a context that is more difficult to explore with a subset of the whole transcriptome using existing tools and established data analytics. Differential expression and pathway analyses like GSEA or IPA can have less power to make significant pathway calls if only a subset of the transcriptome is considered. Therefore, computational extrapolation from surrogate gene sets (eg, S1500+) to the whole transcriptome has been developed as a strategic and resourceful approach that enables near-term action to overcome this challenge by filling in the gaps as we evolve our understanding of biological response pathways.6,54 Adding expression values via computational extrapolation is only useful if it leads to additional biologically accurate conclusions in downstream analysis. Here, we have evaluated the accuracy of conclusions drawn from an analysis that includes extrapolated expression values and uses a well-studied chemical treatment.
In this study, we used human S1500+ data from 268 samples for tunicamycin-exposed and DMSO control PHHs derived from 54 donors as a case study. We compared the results of downstream analyses that were obtained using just the measured genes on the S1500+ platform (~3 K genes) vs the whole transcriptome (~26 K measured + extrapolated genes) based on the S1500+ data. Results indicate that analyses performed after extrapolation to the whole transcriptome lead to (1) results that are similar in nature, that is, enable biological interpretations to existing databases with established bioinformatics tools that are similar to those obtained from the directly measured ~3 K genes from the S1500+ platform; but more importantly, they lead to (2) the discovery of a significant number of additional DEGs and DEPs that make intuitive sense from well-known biological effects of tunicamycin exposure. In particular, the extrapolation procedure for the tunicamycin case study reported here as implemented in GeniE 9 directly enabled the identification of 45 additional DEGs with FWER ⩽ 0.05 (37 activated + 8 repressed). The majority of these DEGs, which were only identified after extrapolation, match known tunicamycin-responsive genes previously reported in the literature. Moreover, a number of these additional DEGs are related to tunicamycin’s major biological response activities, as reported in the literature, of inducing stress in the ER and activating the UPR.35,42,49 For example, the gene ERN1 (endoplasmic reticulum to nucleus signaling 1, also known as IRE1), which is among the extrapolated upregulated DEGs, encodes a protein responsible for triggering the most evolutionarily conserved branch in the UPR. 55 Overall, additional discoveries made possible by extrapolation contribute to a better understanding of the molecular changes caused by exposure to tunicamycin. Furthermore, this method has the potential to reveal other genes for which there is currently no published association to tunicamycin exposure.
Our results indicate that the use of extrapolated gene expression measurements obtained via GeniE web tool 9 greatly improves GSEA and other functional analyses such as enriched keywords identified via DAVID 16 and functional categories discovered via IPA. 17 In the GSEA analysis, a total of 17 pathways were identified as significantly enriched when the extrapolation was performed; by comparison, only 7 pathways were identified when the input was limited to measured genes only. The pathways identified with the whole transcriptome (measured + extrapolated) included a subset of the pathways found in the measured only analysis, but the whole transcriptome dataset enhanced the characterization of tunicamycin response by identifying additional biologically relevant pathways, such as those related to metabolic processes. Similar findings were observed in the DAVID and IPA analyses; 3 of the 4 DAVID keywords from the S1500+ measured genes only analysis (all with Foldchange > 2; Table 3) were found to be significant when the whole transcriptome was used. In addition, “ER,” “Unfolded protein response,” and “Stress response” were identified as significant keywords in DAVID analysis only when extrapolated genes were included in the input. Ingenuity Pathway Analysis also only identified the “Endoplasmic Reticulum Stress Pathway” when extrapolated genes were included in the analysis. In addition, in IPA, “tunicamycin” was identified as the top ranked upstream regulator when extrapolated genes were added to the analysis, whereas it ranked third when only measured genes were used. Similarly, the inclusion of extrapolated genes increased the rank (from 6 to 2) of “tunicamycin” as a correlated compound in NextBio. Therefore, extrapolating to the whole transcriptome before performing downstream analyses increased the similarity of the DEG and DEP datasets with the known expression profile of tunicamycin as an upstream regulator. Many of the connections that were drawn only after extrapolation with established statistical approaches are consistent with the vast research related to tunicamycin exposure, while some are related to its key mode of action as an ER stress inducer. A detailed literature review and confirmation obtained via CTD analyses validated the utility and relevance of the additional pathways and biological insights gleaned from the use of an extrapolated whole transcriptome.
Functional analyses performed using the whole transcriptome (measured + extrapolated) provided additional insights into pathways, upstream regulators, enriched keywords, and correlated compounds that would have been overlooked if genes measured on S1500+ were used alone without extrapolation. Although extrapolation has a clear advantage in terms of the quantity and quality of the identifiable DEGs and DEPs, we noted 2 DEGs and 4 DEPs that were revealed only in the analyses of the measured only (unextrapolated) data. While the 2 DEGs retain significant fold change (fold > 1.5), they did not have significant multiple test corrected P values in measured + extrapolated analysis given that total genes (transcriptome size) considered was significantly larger in measured + extrapolated analysis compared to measured only analysis, therefore impacting the FWER. Similarly, 4 DEPs identified in the analysis of measured S1500+ genes fall out of significance criteria due to the P value not being significant while the NES values were still significant. As noted during the MAQC and SEQC efforts by the U.S. Food and Drug Administration (FDA), a given platform will always produce some unique significant results, and a combination of foldchange ranking and non-stringent P value cutoff leads to higher consistency across studies/platforms for downstream biological interpretation.56,57 We see similar effects here in the agreement between measured only and measured + extrapolated analysis. A primary focus on foldchange or NES with a lax P value cutoff would keep these specific genes/pathways from falling out of significance in the measured + extrapolated analysis. These genes/pathways of borderline significance may just be false-positive results in the measured only analysis. However, due to lack of full transcriptome data (from RNA-seq, microarray or similar platforms), we cannot verify if the said genes/pathways were active or not, and it is possible these were not false hits.
In the future, as more data become available using S1500+ and whole transcriptome TempO-Seq platforms from the same study subjects under the same treatment conditions, one will be able to better address how extrapolation from S1500+ genes to the (measured + extrapolated) whole transcriptome compares to having TempO-Seq measurements from the whole transcriptome platform.
Transcriptomic analyses that involve a large number of samples can greatly benefit from the cost efficiency and scientific rigor offered by the S1500+ platform, which provides a carefully selected set of genes acting as a surrogate for the full transcriptome when paired with bioinformatics analyses such as those described above. 9 Thus, by exploiting the data-driven correlation-based design of the S1500+ gene set to accurately predict expression for the whole transcriptome, researchers can extend their findings for enhanced functional insight, expanding the interpretation of HTT data.
Supplemental Material
SuppFig1_xyz421331433ab07 – Supplemental material for Utility of Extrapolating Human S1500+ Genes to the Whole Transcriptome: Tunicamycin Case Study
Supplemental material, SuppFig1_xyz421331433ab07 for Utility of Extrapolating Human S1500+ Genes to the Whole Transcriptome: Tunicamycin Case Study by Deepak Mav, Dhiral P Phadke, Michele R Balik-Meisner, B Alex Merrick, Scott Auerbach, Marije Niemeijer, Suzanna Huppelschoten, Audrey Baze, Celine Parmentier, Lysiane Richert, Bob van de Water, Ruchir R Shah and Richard S Paules in Bioinformatics and Biology Insights
Supplemental Material
SuppFig2_xyz421331ec383d0 – Supplemental material for Utility of Extrapolating Human S1500+ Genes to the Whole Transcriptome: Tunicamycin Case Study
Supplemental material, SuppFig2_xyz421331ec383d0 for Utility of Extrapolating Human S1500+ Genes to the Whole Transcriptome: Tunicamycin Case Study by Deepak Mav, Dhiral P Phadke, Michele R Balik-Meisner, B Alex Merrick, Scott Auerbach, Marije Niemeijer, Suzanna Huppelschoten, Audrey Baze, Celine Parmentier, Lysiane Richert, Bob van de Water, Ruchir R Shah and Richard S Paules in Bioinformatics and Biology Insights
Supplemental Material
SuppFig3_xyz421331a9bc445 – Supplemental material for Utility of Extrapolating Human S1500+ Genes to the Whole Transcriptome: Tunicamycin Case Study
Supplemental material, SuppFig3_xyz421331a9bc445 for Utility of Extrapolating Human S1500+ Genes to the Whole Transcriptome: Tunicamycin Case Study by Deepak Mav, Dhiral P Phadke, Michele R Balik-Meisner, B Alex Merrick, Scott Auerbach, Marije Niemeijer, Suzanna Huppelschoten, Audrey Baze, Celine Parmentier, Lysiane Richert, Bob van de Water, Ruchir R Shah and Richard S Paules in Bioinformatics and Biology Insights
Supplemental Material
Supp_Table1_xyz4213354553fe2 – Supplemental material for Utility of Extrapolating Human S1500+ Genes to the Whole Transcriptome: Tunicamycin Case Study
Supplemental material, Supp_Table1_xyz4213354553fe2 for Utility of Extrapolating Human S1500+ Genes to the Whole Transcriptome: Tunicamycin Case Study by Deepak Mav, Dhiral P Phadke, Michele R Balik-Meisner, B Alex Merrick, Scott Auerbach, Marije Niemeijer, Suzanna Huppelschoten, Audrey Baze, Celine Parmentier, Lysiane Richert, Bob van de Water, Ruchir R Shah and Richard S Paules in Bioinformatics and Biology Insights
Supplemental Material
Supp_Table2_xyz318951d33fbca – Supplemental material for Utility of Extrapolating Human S1500+ Genes to the Whole Transcriptome: Tunicamycin Case Study
Supplemental material, Supp_Table2_xyz318951d33fbca for Utility of Extrapolating Human S1500+ Genes to the Whole Transcriptome: Tunicamycin Case Study by Deepak Mav, Dhiral P Phadke, Michele R Balik-Meisner, B Alex Merrick, Scott Auerbach, Marije Niemeijer, Suzanna Huppelschoten, Audrey Baze, Celine Parmentier, Lysiane Richert, Bob van de Water, Ruchir R Shah and Richard S Paules in Bioinformatics and Biology Insights
Footnotes
Acknowledgements
The authors gratefully acknowledge the critical reviewing by Dr Debra Taxman and the internal reviews and comments by Dr Stephen S. Ferguson, Biomolecular Screening Branch, DNTP and Dr Amy Wang, Office of the Report on Carcinogens, DNTP.
Funding:
The authors disclosed receipt of the following financial support for the research, authorship, and/or publication of this article: Funding for this project, in part, was provided by the US government including funding to Sciome through NIEHS contract #HHSN273201700001C.
Declaration of conflicting interests:
The author(s) declared no potential conflicts of interest with respect to the research, authorship, and/or publication of this article.
Author Contributions
DM, DPP, RRS, RSP, and MRBM conceived of the idea of the manuscript. DPP, DM, MRBM, and RRS performed data analysis and methods development. MN, SH, AB, CP, LR, and BW performed laboratory data handling. MRBM, RRS, DPP, and DM wrote first draft of manuscript. All other authors (BAM, SA, MN, SH, AB, CP, LR, BW, and RSP) made critical revisions and approved the final version of the manuscript. DM, DPP, and MRBM contributed equally.
Supplemental Material
Supplemental material for this article is available online.
References
Supplementary Material
Please find the following supplemental material available below.
For Open Access articles published under a Creative Commons License, all supplemental material carries the same license as the article it is associated with.
For non-Open Access articles published, all supplemental material carries a non-exclusive license, and permission requests for re-use of supplemental material or any part of supplemental material shall be sent directly to the copyright owner as specified in the copyright notice associated with the article.