
Abstract
The rapid development of high-performance technologies has greatly promoted studies of molecular oncology producing large amounts of data. Even if these data are publicly available, they need to be processed and studied to extract information useful to better understand mechanisms of pathogenesis of complex diseases, such as tumors. In this article, we illustrated a procedure for mining biologically meaningful biomarkers from microarray datasets of different tumor histotypes. The proposed methodology allows to automatically identify a subset of potentially informative genes from microarray data matrices, which differs either in the number of rows (genes) and of columns (patients). The methodology integrates nonnegative matrix factorization method, a functional enrichment analysis web tool with a properly designed gene extraction procedure to allow the analysis of omics input data with different row size. The proposed methodology has been used to mine microarray of solid tumors of different embryonic origin to verify the presence of common genes characterizing the heterogeneity of cancer-associated fibroblasts. These automatically extracted biomarkers could be used to suggest appropriate therapies to inactivate the state of active fibroblasts, thus avoiding their action on tumor progression.
Introduction
Complex human diseases are caused by the interactions of many genetic, environmental, and behavioral factors. Development of high-performance technologies greatly promoted studies on molecular oncology producing large amounts of omic data. The availability of massive volume of experimental data based on cancer researches requires the development of mathematical, statistical, and computational techniques, which automatically extract valuable information useful for a better understanding of pathogenesis mechanisms of complex diseases, such as tumors. Identifying marker genes potentially involved into the development of tumors may facilitate the understanding of cause of disease, thus contributing to the advancement of diagnostic tools and/or to the evaluation of more efficient clinical strategies.
In most of the publicly available data sets, the number of genes is significantly larger than the number of samples. This high dimensionality represents a major problem for an automatic gene array–based cancer analysis. In this scenario, dimensionality reduction methods became indispensable as they can eliminate irrelevant and redundant information, thus reducing the dimensionality as well as the complexity of the original problem, with significant benefits in terms of computational efficiency, model interpretability, and data understanding.
Among linear dimensionality reduction methods, low rank matrix decomposition algorithms have been successfully exploited as alternative approaches for studying various types of high-dimensional biological data, including gene expression data. 1 The application of these algorithms relies on the assumption that large-scale biological data have an intrinsic low-dimensional representation, with the dimension often corresponding to the number of latent information embedded into the original data. These methods transform the space of original data into a lower dimensional more discriminating (informative) space that makes the subsequent analysis more efficient.
Among low-rank reduction mechanisms, nonnegative matrix factorizations (NMFs) emerge as useful approaches for the analysis of microarray data. The intrinsic non-negativity property of these techniques, in fact, produces more intuitive results as many biological measurements are represented by positive values. Nonnegative matrix factorizations demonstrated their ability in a number of tasks, including the identification of sets of genes co-operating in a relatively tightly regulated manner; 2 the discovery of potential relationships in large biological data samples and link genes to these patterns; 3 the detection of distinct genomic subtypes in cancer patients; 4 the inspection of expression data sets including time evolution of the gene expression profile in different samples; 5 and the extraction of gene expression profiles from fibroblasts of cancer blood diseases. 6
In this article, we present a gene extraction methodology, which integrates a NMF method7,8 with the functional enrichment analysis web tool WebGestalt 9 and a gene extraction procedure designed ad hoc to automatically mine different microarray cancer data sets to extract a reduced subset of genes to be further investigated from a biological point of view. An approach for mining multi-omics cell line data with the same row size by joint nonnegative matrix factorization (JNMF) and pathway signature analyses was recently proposed in Fujita et al. 10 The methodology presented in this article instead allows to analyze microarray data matrices, which differ either in the number of rows (genes) and in the number of columns (patients) to verify the presence of common genes characterizing the heterogeneity of different cancer datasets. This proposal enriches the panorama of large-scale data-driven computational methods based on matrix factorization algorithms, which are able to extract concise and useful pieces of information from existing disease-associated data sets.1,11,12 Particularly, through the NMF method, our methodology mines the metagenes, which are the most representative of the information embedded into different tumor datasets and then, by simple intersection set operations allow to extract genes in a natural way to obtain interpretable and useful knowledge readily usable from biologists and analyzed, thanks to functional and visualization approaches based on the WebGestalt tool. The proposed methodology has been used to mine microarray of solid tumors of different embryonic origin to verify the presence of biomarkers characterizing the heterogeneity of cancer-associated fibroblasts (CAF) thus being applicable in clinical practice.
Fibroblasts constitute the most heterogeneous and abundant population of mesenchymal cells in tumor microenvironment (TME). Their presence goes from tumor formation up to the final stage of metastatic diffusion, but their precise functional role in tumor is not fully understood yet. 13 Also, it is not clear how different subtypes of CAF could exert distinct paracrine actions affecting specific tumor oncogenesis.14,15 Therefore, we adopt the proposed procedure to analyze gene expression profiles of CAFs belonging to primary cultures of 3 distinct tumor histotypes (ie, colon of endodermal origin, breast carcinoma of ectodermal origin and ovary of mesodermal origin) to select common biomarkers and characterize activated fibroblast phenotype. Moreover, as it is known that bone marrow (BM) is a CAF recruitment source, 16 we aim at investigating also the existence of common genes among CAF gene expression profiles of selected solid tumors and those of BM of patients with multiple myeloma (MM) and monoclonal gammopathy of undetermined significance (MGUS; MGUS is a benign pathological condition characterized by the proliferation of a plasma cell clone that rarely evolves into a malignant neoplasm. 17 The latter, being a benign pathological condition, simulates a well-differentiated CAF phenotype compared to those of patients with MM.). Using the proposed methodology, we highlight the existence of biomarkers among CAFs of different embryonic origin that uniquely identify them and could be useful for developing or evaluating more efficient clinical strategies.
This article is organized as follows. First, the pipeline of the whole gene extraction methodology is presented, illustrating a general way to pre-process this kind of data, its analysis core (based on the NMF method), and the ad hoc gene landscape extraction procedure. The subsequent section describes the specific biological problem we investigated, as well as the databases of CAF populations used in the experimental session. Then, the functional and pathway analysis performed during the experiments are deeply discussed and the obtained results are highlighted from a biological point of view. Some conclusive remarks conclude the article.
Methods
This section discusses in some detail the main architecture, data pre-processing, and basic NMF approach used in this study.
The ensemble gene extraction methodology
The proposed methodology is based on different operations that integrate the acquisition of data, their mathematical analysis, and the biological exploration of the obtained results.
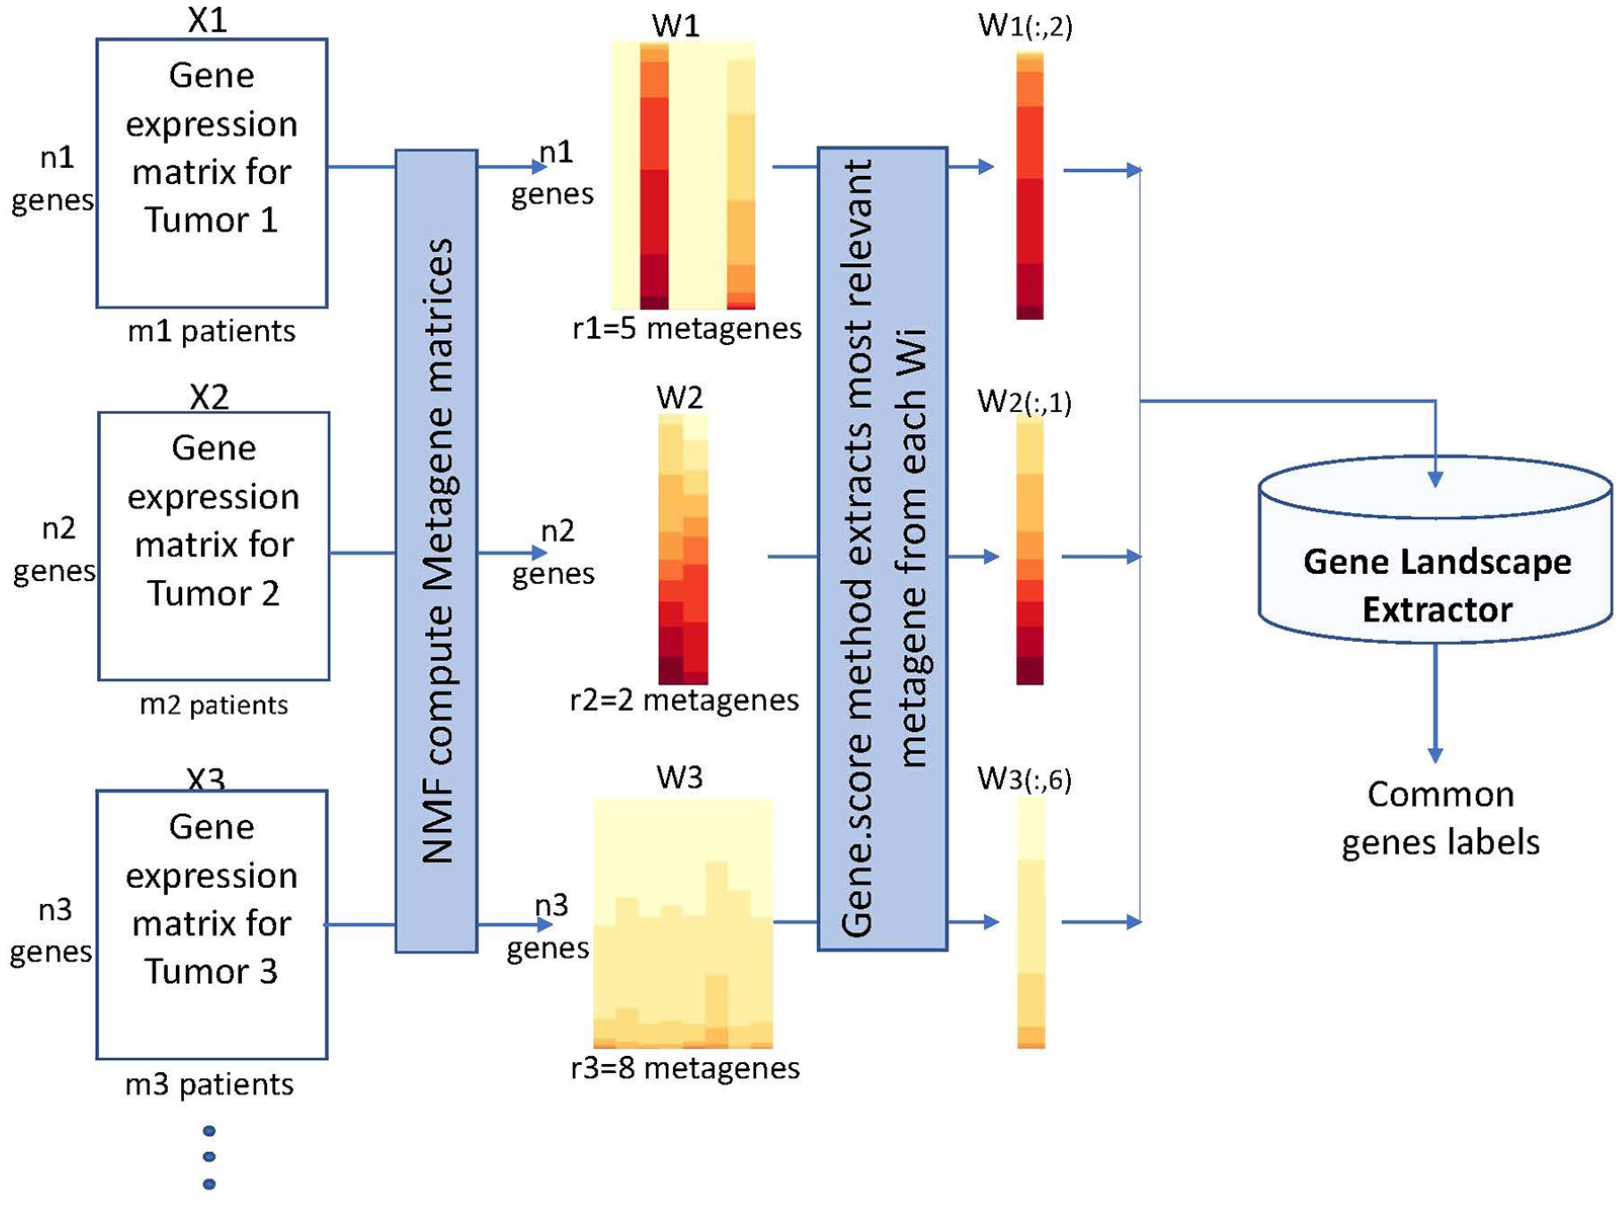
Figure 1 illustrates the work-flow and the main operations performed when selected tumor data sets are provided.

Work flow of the NMF-based methodology for extraction of common genes between different tumor gene expression datasets.
The methodology is mainly based on the integration of 4 parts: the data preparation module, the core module computing NMF of given data matrices, the Gene Landscape extractor devoted to the extraction of common genes between processed results, and the Functional and Visual Analysis module. The first 3 modules combine R/BioConductor platform and the NMF library, which are well established in bioinformatics research,18-20 whereas the biological analysis of the latter module is performed using the well-known web tool WebGestalt.
Data preparation and pre-processing
Working on microarray data requires data sets are imported in the virtual environment as a single different expression set, in which probeset represents gene interrogating a

Possible cases supported by the pre-processing phase.
The pre-processing operations implemented in this module are based on the adjusted median absolute deviation (MAD) of the gene expression values. The use of the MAD (a scale factor is used to consider the MAD as a consistent estimator for the estimation of data standard deviation), which computes the variability of the data from the median, makes the process more robust to outliers. In particular, a tuple probeset id, gene symbol, and the associated expression value are uniquely identified assuming that greater is the MAD higher is the goodness of the hybridization in the experiment. The code and dataset related to data preparation and pre-processing module have been made available at GitHub at https://github.com/flaespo/NMF-for-GSE.
Nonnegative matrix factorization for genetic data sets
After data pre-processing is performed, most omic data sets can be represented as a matrix in which each element contains the measurement of a single molecule in a single experimental condition. In the case of expression data, the resulting high-dimensional data set is re-formulated as a numerical nonnegative matrix with rows being genes and columns representing samples, for example, tissues of various patients (as in this study), development stages, or treatments. This matrix is called “gene expression matrix” and its elements
Nonnegative matrix factorization can be applied to reduce data dimensionality as it decomposes a gene expression matrix X by creating a user-defined number of new column features

for
From an algebraic point of view, NMF finds 2 nonnegative matrices, the metagenes matrix
When NMFs are applied to produce clusters of genes, the rank value r is usually a priori set after trying different values, computing some quality measure of the results, and then choosing the best value according to the adopted quality criteria. In this article, however, we make use of some automatically suggested value accordingly a procedure described in Del Buono and colleagues.8,23 This procedure makes use of cophenetic coefficient, residuals sum of squares, dispersion curve, and consensus matrices to optimally address a proper rank value r for each gene expression matrix X.
Computationally, metagenes and expression profile values can be obtained solving a non-linear constrained optimization problem over the cone of nonnegative matrices

where

is used, which corresponds to the maximum likelihood estimation under an independent Poisson assumption. 24 The minimization problem (1) for the KL divergence function is solved applying the following multiplicative update rules for W and H:

Because of the non-negativity constraint, solutions to NMF are only unique up to scaling and rotation, but appropriately scaling and rotating the columns of W and rows of H will not alter the overall matrix product WH. For this reason, what is of interest in practice is not the values of matrix elements, but their relative magnitudes in each column of W (or row of H). Moreover, taking into account that more genes can participate in more than one biological process, it could be of some beneficial to investigate genes that have relatively large coefficients in each biological process.
To do this, the gene.score scoring method proposed in Kim and Park
25
has been adopted. This method computes a value gene.score (i) i value for each gene i in a metagene
Metagenes in W contain the largest number of genes satisfying this empirical criterion and they can be considered as the most representative of the information hidden onto the gene expression data X. Observe that the metagenes NMF technique extracts are constrained by the dataset used to train them, so a careful selection of datasets is essential: users need to choose those being broad enough to cover the relevant sources of variability.
Gene Landscape Extraction procedure
Referring to Figure 1, let
To compare gene expression matrices derived from different tumor histotypes (in this work from their associated CAF cultures), the most representative metagene
To identify common genes among those extracted by different tumor histotypes, an intersection set operation was performed on the identification labels of genes
Figure 3 provides a logical view of the Gene Landscape Extraction procedure, which represents the novel proposal to extract common genes from microarray matrices which differ in their sizes. Particularly, the microarray matrices
Logical view of the gene landscape extraction. Preprocessed expression data matrices related to 3 different tumors (
Functional and visual analysis
The obtained subset of genes is then analyzed by integrative bioinformatic tools, that is, the WebGestalt tool, 26 to discover the role they cover into the biological process under investigation.
This module performs either functional and pathway enrichment analysis of the genes in
Application to the Analysis of Gene Expression Profiles of CAFs
In this section, we sequentially applied the main modules of the proposed methodology for automatically extract genes from gene expression profiles of CAFs.
Fibroblasts are the most heterogeneous and abundant population of mesenchymal cells in the TME, 27 but their precise functional role in tumor is not fully understood yet. 13 During initial phases of oncogenesis, fibroblasts are activated giving rise to fibroblasts associated with the tumor (CAF), which play a key role in generating a specific extracellular matrix (ECM) in TME. 28 The kinetics of changes in CAF actions might be different in the various types of tumor, partly because of organ-specific transcriptomic profiles of resident fibroblasts 29 and partly as different subtypes of CAF could exert distinct paracrine actions affecting specific tumor oncogenesis.14,15 Currently, either the number of CAF subpopulations present in the tumor stroma and the role assumed by the presence of an individual population or different cell types into tumor initial development stages are unknown.6,16 Some characteristics distinguish CAFs from quiescent fibroblasts as, for instance, metabolic adaptations supporting their need for advanced proliferation and biosynthesis activities. 13 Furthermore, a potentially controversial area of research on CAFs is focused on their origin. In fact, to define and identify origin of fibroblasts, it is fundamental to consider that CAFs are “activated fibroblasts” and unlike the non-activated (quiescent) fibroblasts residing in the tissue, they are an expansion of the cell population proliferating “in situ” or are recruited in the tumor. 30 Recruitment of BM mesenchymal stem cells, differentiation from adipose stem cells, or conversion from endothelial cells through an epithelial-endothelium-mesenchymal transition process are potential origins of CAFs. 13 However, the best documented source of CAFs is the activation of “normal” resident fibroblasts which, with their heterogeneity, imply the existence of different subsets. This heterogeneity may reflect the variability with respect to phenotypic state of both cell and tissue of origin and therefore also the reporting mediators and the mechanisms to be activated.14,31 In fact, CAFs can be distinguished from other types of cells within the tumor by means of exclusion criteria defined by their morphological characteristics and by a lack of expression of non-mesenchymal markers, such as those expressed by endothelial, epithelial, immune, and neuronal cells even if none of these has an absolute specificity. 32 A challenging aspect in CAFs studies is the precise definition of heterogeneous CAF populations in distinct phases of tumor progression through markers informing on their functions.6,33
In this study, we used the proposed NMF-based gene extractor methodology to investigate CAFs heterogeneity to identify the possible presences of genes, which can be biomarkers and characterize activated fibroblast phenotype. Gene expression profiles of CAFs belonging to primary cultures of 3 distinct solid tumor histotypes from patients (ie, colon of endodermal origin, breast carcinoma of ectodermal origin and ovary of mesodermal origin) were considered. Moreover, we also verified the existence of common genes among CAF gene expression profiles of selected solid tumors and those of BM of patients with multiple myeloma (MM) 6 and MGUS. 17
Identification of CAF populations and download of transcriptomic profiles
International Agency for Research on Cancer (IARC) estimates 18.1 million (17.0 million excluding non-melanoma skin cancer) new cancer cases in 2018, causing about 9.6 million of deaths (9.5 million excluding non-melanoma skin cancer). 34
For studying the heterogeneous CAF population, which represents the most abundant cellular component of the TME, representative tumor histotypes with high rate of mortality have been selected: colon carcinoma, breast cancer, ovarian cancer, and MM. The gene expression profiles of CAFs were downloaded from the Gene Expression Omnibus database (GEO) NCBI (a functional public genomic database that supports the submission of MIAME-compliant data) directly from the original publications of each series (https://www.ncbi.nlm.nih.gov/geo/query/acc.cgi?acc=GEO series). 35 Data sets were selected according to the following standards: (a) the GEO platform (GPL) and (b) the number of samples with labels to identify the fibroblasts associated with the tumor (being ⩾7 the total amount of samples for each representative cancer). Table 1 reports GSE series, bibliographical references, GPL, GSM labels, and the numbers of samples and expressed genes for each data set and finally, the rank values adopted to obtain NMF decomposition.
Dataset information: GSE series used, bibliographical references, GEO platforms (GPL570, GPL6244, and GPL2136 indicate Affymetrix Human Genome U133 Plus_2.0 Array, Affymetrix Human Gene 1.0 ST Array, and Micro-CRIBI Human Oligo Array [Operon V2.0], respectively), fibroblast sample labels, representative cancer, number of genes, number of samples, and NMF rank value

Results
Functional analysis
Nonnegative matrix factorization–based methodology identified a subset of 108 genes common to colon, breast, and ovarian tumors. The biological analysis these genes underwent during the functional and visual analysis phase is detailed in the following. Table 2 summarizes the Gene Ontology functional analysis, Table 3 the Pathway enrichment analysis, whereas in Table 4 are detailed all the 108 genes that underwent the biological analysis. Furthermore, considering that the population of CAF in TME is also recruited by the BM, contributing with important percentages on the total CAF population, the gene expression profiles of primary CAFs of MGUS and MM were used to select the presence of genes, which are common among the CAF “in situ” of the analyzed tumors and CAF recruited by the BM.
Gene ontology functional analysis: based on the parameters used, 10 categories are identified as enriched categories and all are shown in this table. 9
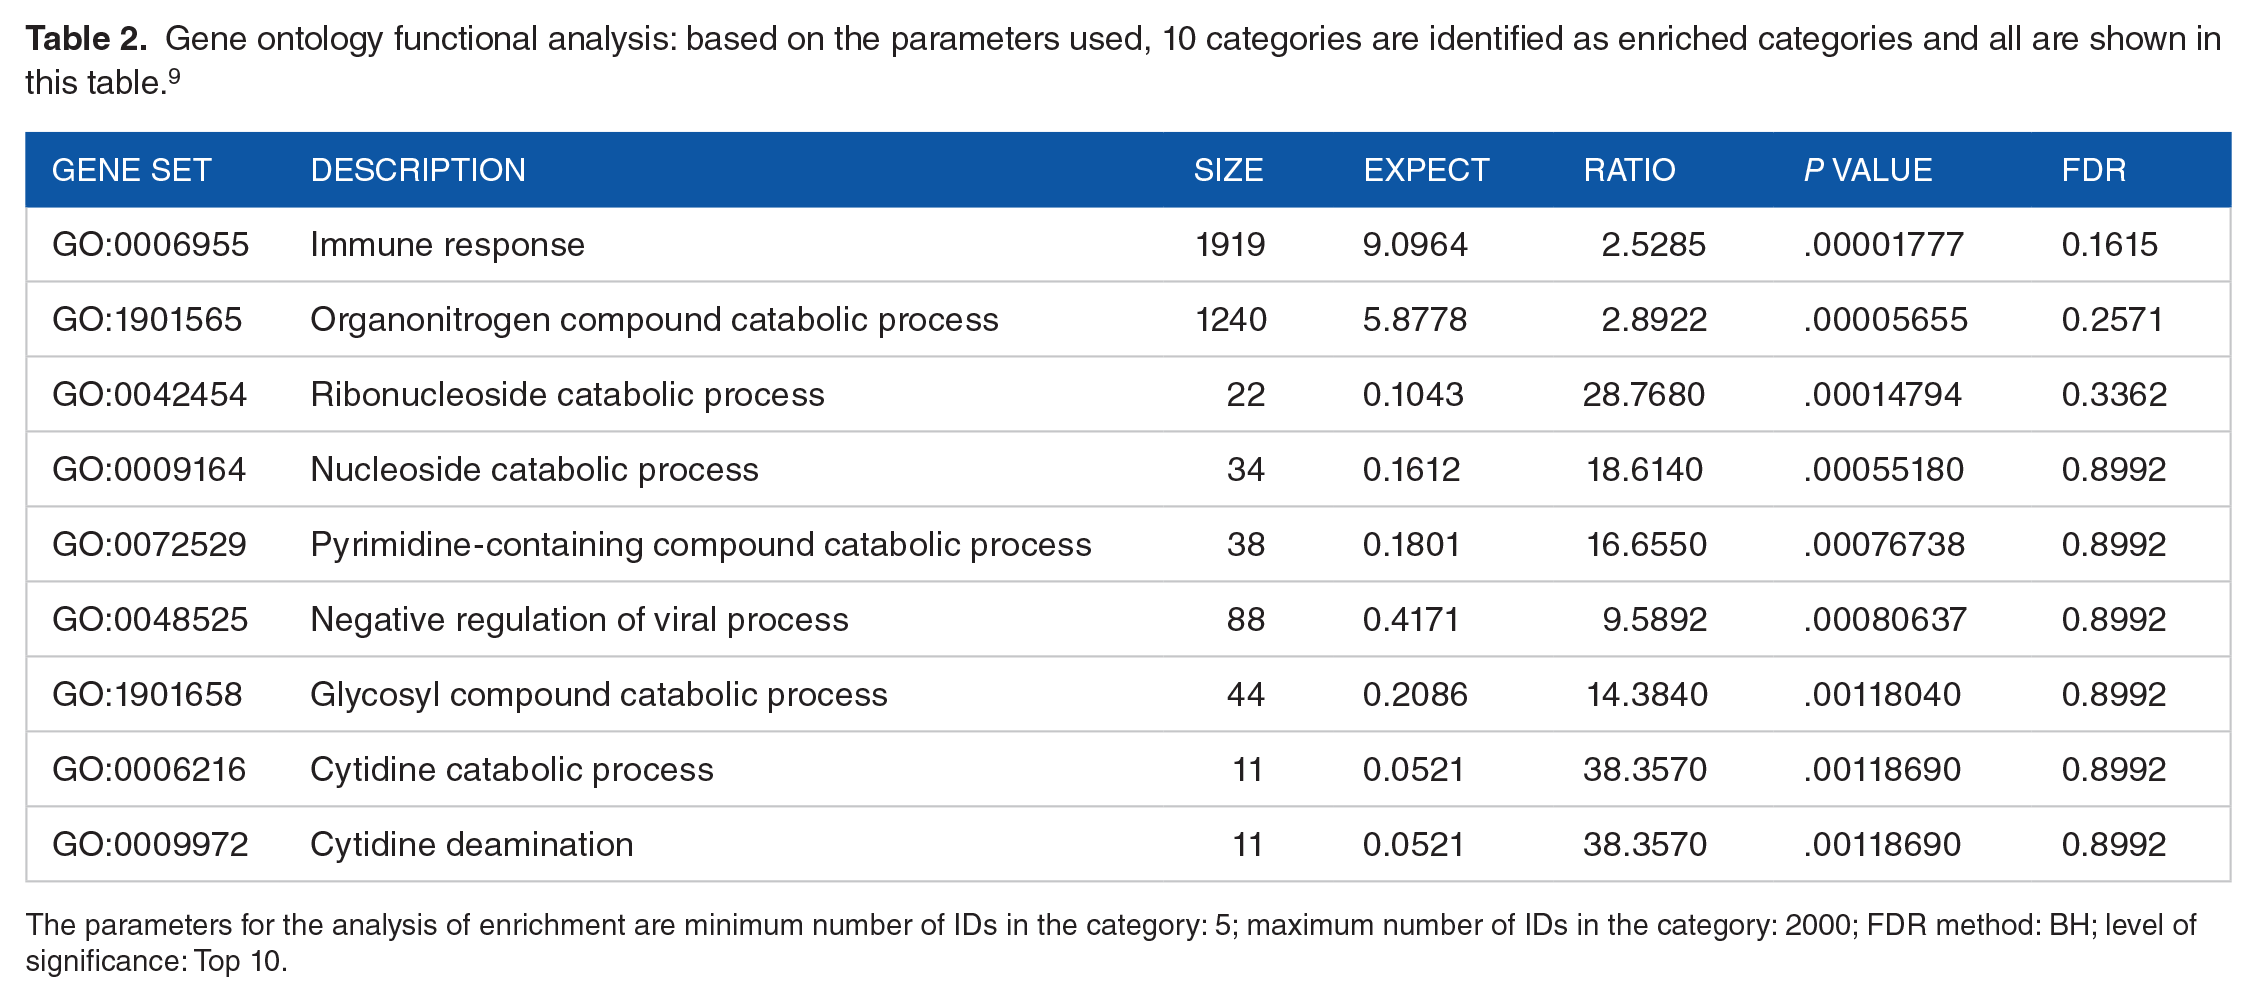
The parameters for the analysis of enrichment are minimum number of IDs in the category: 5; maximum number of IDs in the category: 2000; FDR method: BH; level of significance: Top 10.
Pathway enrichment analysis: based on the parameters used, 10 categories are identified as enriched categories and all are shown in this table. 9
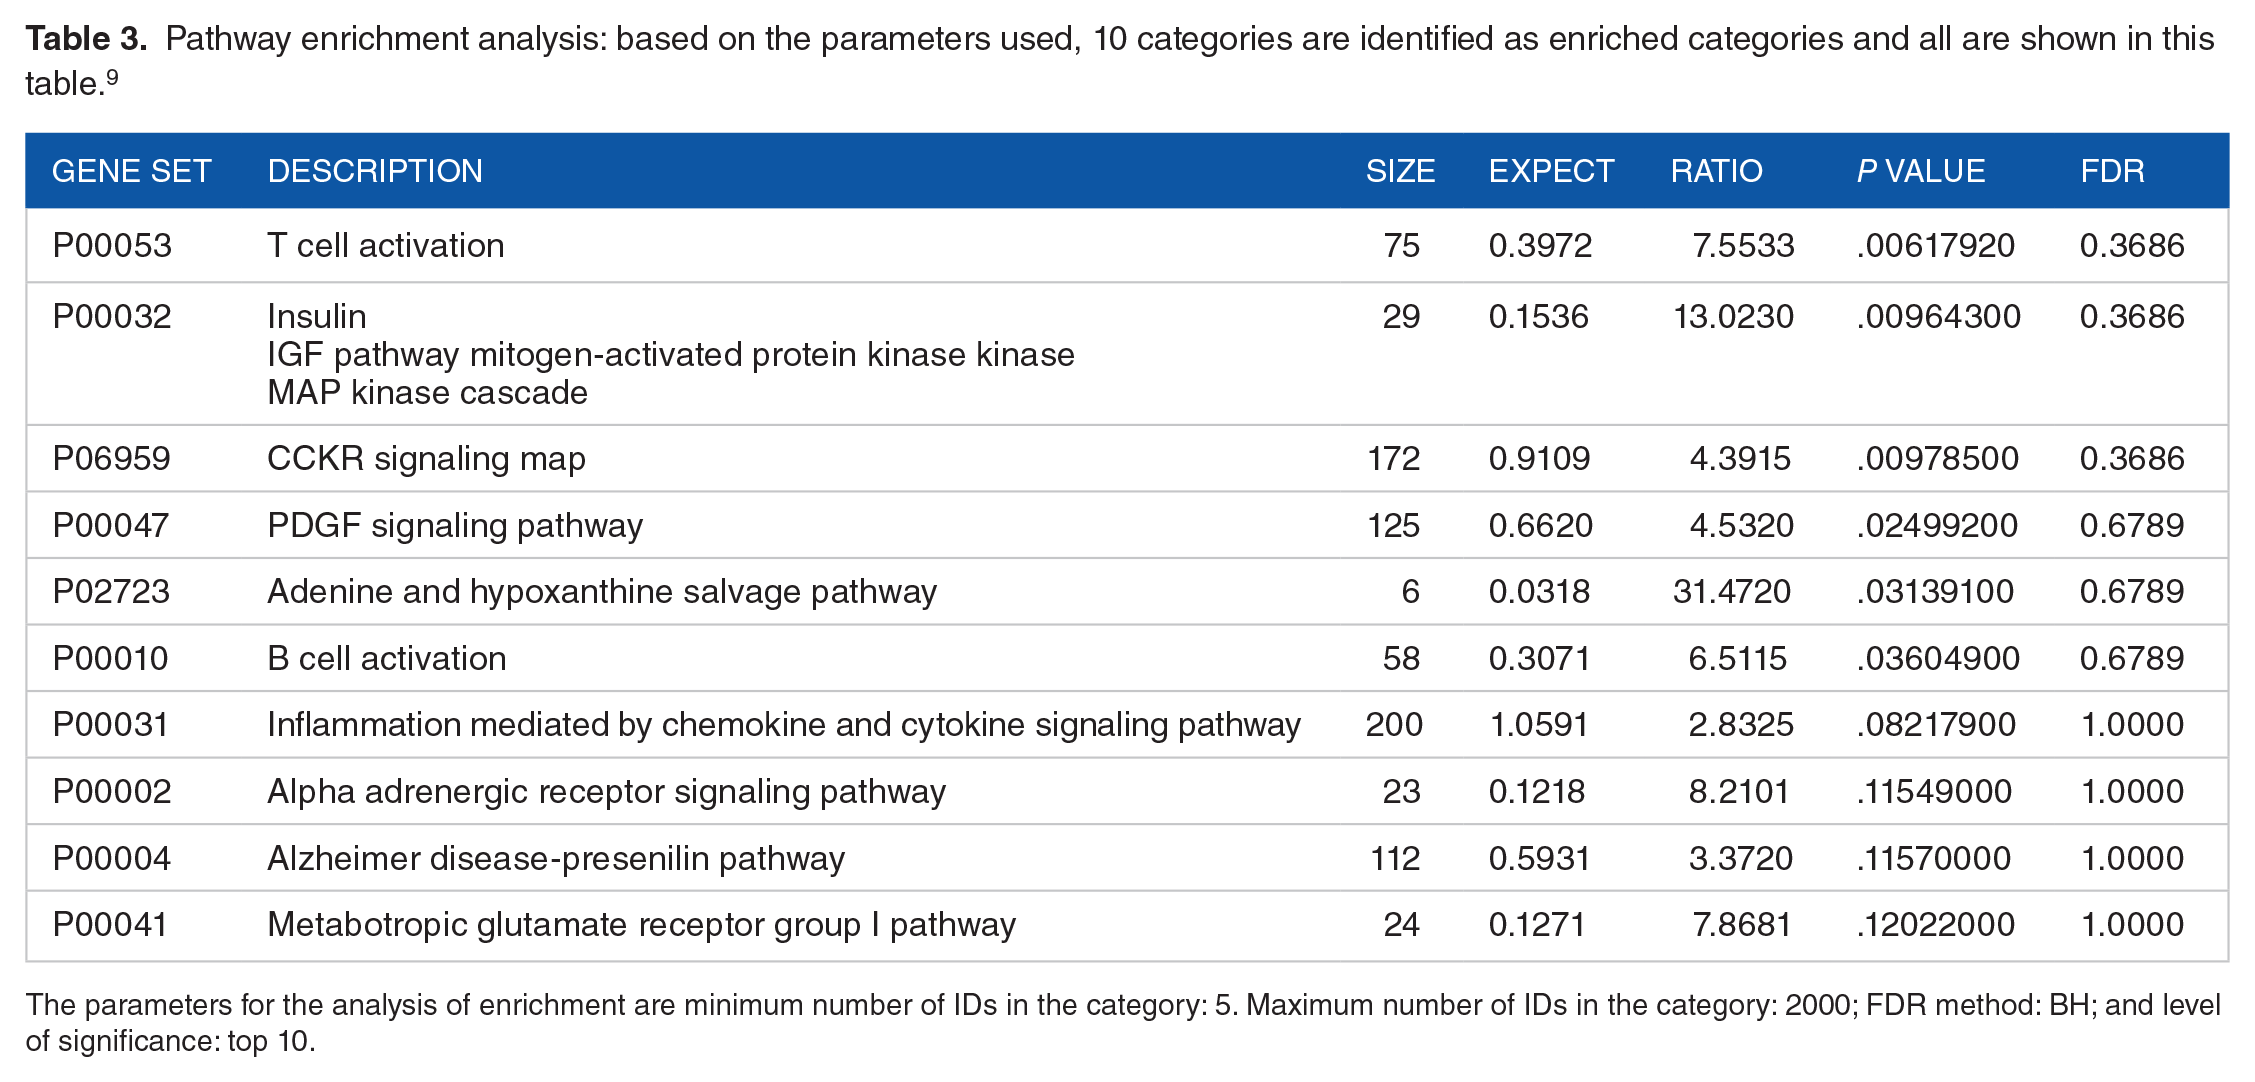
The parameters for the analysis of enrichment are minimum number of IDs in the category: 5. Maximum number of IDs in the category: 2000; FDR method: BH; and level of significance: top 10.
List of the 108 genes common to colon, breast, and ovarian tumors identified by NMF-based methodology described in this article.

Gene Ontology functional analysis
Gene Ontology (GO) was used to classify common genes; classification is obtained according to biological processes, molecular functions, or cellular components. Some genes were identified as related to processes significantly representative of the immune response and associated with nucleic acids metabolism. In particular,
23 (21.3%) and 13 (12%) genes are involved in the “immune response” and “innate immune response” biological processes with false discovery rate (FDR) values 0.1615 and 0.3362, respectively. ABCE1, ANXA1, APOBEC3B, APOBEC3G, BST2, CFH, FBXO9, HLA-DQA1, HLA-DQB1, JCHAIN, MATR3, TRIM14, and TRIM59 are genes common to both processes. On the contrary, DNAJC13, ENPP2, FOS, NBN, PGRMC1, PNP, RIF1, ROCK1, TAP2, and TGFBR3 are genes characterizing “immune response” processes, but which do not participate in the “innate immune response.”
17 genes (15.7%) are involved in the catabolic “organonitrogen compound catabolic process” with an FDR value of 0.2571; they are AOX1, APOBEC3B, APOBEC3G, AZIN1, CDH1, ENPP2, FBXO9, GPC6, HERC2, HNMT, MBD4, PNP, PSMB9, ROCK1, SYNPO2, UBA6, and TRIM2. The remaining biological processes that characterize GO share the above-mentioned genes.
The 3 major biological processes “immune response,” “innate immune response,” and “organonitrogen compound catabolic process” characterizing the GO share 3 genes: APOBEC3B, APOBEC3G, and FBXO9. The APOBEC3B and APOBEC3G genes belong to members of the cytidine deaminase gene family. All the components of the APOBEC family, with the exception of APOBEC2 and APOBEC4, are able to convert, in single-stranded DNA, the cytosine through a deamination reaction in uracil.41-43
The FBXO9 gene encodes a member of the F-box family of proteins. F-box proteins are one of the 4 subunits of the ubiquitin protein ligase complex called SCF (SKP1-cullin-F-box), which works in phosphorylation-dependent ubiquitination. 44 Furthermore, FBX09 manifests the effects on mTOR by directing cells toward cellular survival when growth factors become limiting. These studies suggest that FBX09 could act as an oncogene. 45
The genes that differentiate the “immune response” from the “innate immune response” are FOS, TGFBR3, ROCK1, TAP2, and NBN that encode essentially binding proteins; proteins encoded by ENPP2, TGFBR3, TAP2, and PNP genes have specific biological properties linked to immunity, while FOS, NBN, and PNP genes encode proteins that can be associated with pharmacological responses. The biological processes of the “immune response” and “organonitrogen compound catabolic process” have in common the genes ENPP2, PNP, and ROCK1. The ENPP2 gene encodes a protein that functions both as a phosphodiesterase and as a phospholipase, which catalyzes the production of lysophosphatidic acid (LPA) in extracellular fluids. Lysophosphatidic acid evokes similar responses to growth factors including stimulation of cell proliferation and chemotaxis. Autotaxin (ENPP2 or ATX) was originally identified as an “autocrine motility factor” for tumor cells and has angiogenic properties and its expression is upregulated in different types of carcinomas. 46 The PNP gene encodes an enzyme that reversibly catalyzes the phosphorolysis of purine nucleosides, one of its deficits determines a defective immunity of T cells (cell-mediated) but also the immunity of B cells and the antibody responses may be involved. 47
The ROCK1 gene encodes a serine/threonine kinase protein that is activated when bound to the Rho-bound GTP form. The small GTPase Rho regulates the formation of focal adhesion and fibroblast stress fibers, as well as the adhesion and aggregation of platelets and lymphocytes.48,49 The biological process “organonitrogen compound catabolic process” consists largely of binding proteins (TRIM2, MBD4, UBA6, CDH1, PSMB9, and HERC2), with properties of ligasic and ubiquitinating activity (TRIM2, UBA6, and HERC2). Among the genes belonging to GO, some are associated with events related to the epithelial-to-mesenchymal transition (EMT; TGFBR3, CDH1, and FOS), others to cellular transport through extracellular and intracellular membranes (TAP2 and DNAJC13) and to the immortalization process (RIF1). The TβRIII, independent of its TGF-β co-receptor function, regulates the canonical signaling of Wnt3a. Therefore, TβRIII plays the role of mediator of TGF-β super-family signaling during tumor progression.50,51,52 The CDH1 protein belongs to the caderine super-family and is a calcium-dependent cell adhesion protein. Changes in function of this gene or loss are thought to contribute to EMT, proliferation, invasion, and/or metastasis.53,54 FOS proteins have been implicated as regulators of cell proliferation, differentiation, and transformation. 55 Proteins encoded by the TAP2 and DNAJC13 genes are particularly involved in cellular transport through extracellular and intracellular membranes. The TAP protein is a member of the super-family of the ATP (ABC) cassette transporters, in particular the MDR/TAP subfamily involved in multidrug resistance and is also involved in antigen presentation. 56 The DNAJC13 gene encodes Dnaj proteins that are combined with heat-shock proteins by stimulating ATP hydrolysis. In particular, DNAJC13 is associated with the Hsc70 protein and plays a role in clathrin-mediated endocytosis and in post-endocytic transport mechanisms. 57 Finally, the RIF1 gene encodes a protein that shares the homology with the yeast telomer binding protein, Rap1 interaction factor. This protein locates in aberrant telomeres that may be involved in DNA repair, altering cell growth and proliferation. 58
Pathway enrichment analysis
PANTHER reference database (Protein Analysis Through Evolutionary Relationships) was used to evaluate with the WebGestalt tool the selected 108 genes during the pathway enrichment analysis. The selected 10 pathways were reported in Table 3. The first 6 pathways are characterized by an FDR below 1 and a P value <.05. The 10 genes (9.25%) included in the pathways are as follows:
ITPR1 gene is present in 7 out of 10 pathways: T cell activation, CCKR signaling map, PDGF signaling pathway, B cell activation, inflammation mediated by chemokine and cytokine signaling pathway, alpha adrenergic receptor signaling pathway, and metabotropic glutamate receptor group I pathway.
FOS gene is present in 5 out of 10 pathways: T cell activation pathways, insulin/IGF pathway-mitogen-activated protein kinase kinase/MAP kinase cascade, CCKR signaling map, PDGF signaling pathway, and B cell activation.
CDH1 gene. It is present in 2 out of 10 pathways: CCKR signaling map and the Alzheimer disease-presenilin pathway.
ROCK1 gene. It is present in 2 out of 10 pathways: the CCKR signaling map and inflammation mediated by chemokine and cytokine signaling pathway.
HLA-DQA1 gene is in T cell activation;
IGF2 gene is in insulin/IGF pathway-mitogen-activated protein kinase kinase/MAP kinase cascade;
FLI1 gene is in PDGF signaling pathway;
PNP gene is in adenine and hypoxanthine salvage pathway;
COL14A1 gene is in inflammation mediated by chemokine and cytokine signaling pathway;
TRIM2 gene is in Alzheimer disease-presenilin pathway.
Figure 4 illustrates the most frequent genes and the pathway they belong to using a variation of the UpSet plot. Height and width of bars are proportional to the relative frequencies and to the number of genes selected in each set of pathway.

Variation of the UpSet plot 59 of the most frequent genes: ITPR1, FOS, ROCK1, and CDH1. The intersection between ITPR1 and FOS genes is also plotted to emphasize the pathway they belong to, commonly.
The FOS, CDH1, ROCK1, and PNP genes have been discussed in the GO section. Among the genes not discussed in the GO (Figure 4), we have ITPR1, HLA-DQA1, IGF2, FLI1 COL14A1, and TRIM2. The presence of the ITPR1 gene in 7 pathways demonstrates the centrality of this protein, which is an intracellular receptor for inositol 1,4,5-trisphosphate that after stimulation mediates the release of calcium from the endoplasmic reticulum. The InsP3/Ca2+ pathway works to regulate many cellular processes. The versatility and universality of this pathway is based on 2 main operating modes: providing the Ca2+ signal playing a direct role in the regulation of different processes such as cell proliferation, secretion, metabolism, fertilization, and contraction of smooth muscle. The second modality is to modulate the activity of various excitable cells.60,61 The IGF2 and FLI1 COL14A1 genes are regulators in the morphogenesis process, IGF2 is a growth factor that performs hormonal activity by binding to the insulin receptor, and the COL14A1 gene is involved in fibrillogenesis and creates bridges with the collagen of the ECM; the FLI1 gene is a transcription factor of the ETS family and regulates the expression of oncogenes, tumor suppressor genes, and some genes related to angiogenesis, invasion, and metastasis.62-64 Furthermore, the ITPR1 gene (Figure 4) shares 4 fundamental pathways in the immune response with the FOS gene, confirming that the action of the IPTR1 gene as an intracellular receptor for inositol 1,4,5-trisphosphate determines inputs that also involve FOS protein (component of the transcription factor AP1) in processes associated with immune control. Finally, the HLA-DQA1 gene plays a central role in the immune system by presenting peptides derived from extracellular proteins and is found in several cell types 65 and the TRIM2 gene encodes a protein that is located close to the cytoplasmic filaments and functions as E3-ubiquitin ligase. Furthermore, it has been widely reported that the proteins of the TRIM family play a large role in the biological processes of autophagy, inflammation, immunity, and tumor. 66 The selected pathways provide signals for T and B lymphocytes and signals for cytokine and chemokine-mediated inflammatory processes as the GO has shown by selecting biological events related to the immune response. Moreover, we observe the involvement of growth factor pathways such as PDGF and IGF, alpha adrenergic and glutamate receptors, as well as hormones such as cholecystokinin and gastrin all together demonstrate that CAFs become sensitive to the conditions of the TME.
Identification of genes common among CAFs in colon, breast, and ovarian tumors and MGUS
The subgroup of the 108 genes obtained from the intersection of genes belonging to the representative metagenes of the CAF gene profiles related to colon, ovary, and breast tumors has been intersected with the metagene representative of the MGUS CAF gene profiles. The data sets containing gene subgroups are made available as supplement materials.
The profile intersection produced a subgroup of 9 genes: ANXA1, EIF4E2, ETNK1, GPC6, HLA-DQA1, IFT80, IGHM, PMS1, and UBA6. In this subgroup, the ANXA1 gene has a leading role, as the ANXA1 protein has demonstrated complex roles in many different cellular functions, such as inflammation, regulation of proliferation, membrane interactions, phagocytosis, and cellular apoptosis. In particular, the anti-inflammatory activity is determined by the inhibition of the activity of cytosolic phospholipase A2 (cPLA2) and of cyclooxygenase 2 (COX-2). 67 The alterations of ANXA1 could reveal important functions in tumorigenesis and in the development of cancer. Among the other genes belonging to this subgroup, the IFT80 and GPC6 genes are responsible for the regulation of the non-canonical Wnt pathway, a pathway that organizes the cytoskeleton and the planar polarity of the cell, regulating its shape, especially IFT80 is essential in differentiation processes.68,69 The UBA6, PMS1, and EIF4E2 genes are involved in the process of ubiquitination, repair, and activation of protein synthesis in a hypoxic environment. In particular, the ubiquitination pathways specifically initiated by UBA6 can create a suppressive barrier against the critical steps of carcinogenesis such as loss of polarity, resistance to anoikis, and epithelial-mesenchymal transition (EMT).70,71 Finally, the IGHM, 72 HLA-DQA1, 73 and ETNK1 74 genes are involved in the immune response.
Identification of common genes among CAFs in colon, breast, ovary, and MM tumors
Similarly, the subgroup of the 108 genes obtained from the intersection of genes belonging to the metagenes representative of the gene profiles of CAFs related to colon, ovary, and breast tumors was intersected with the representative metagene of the gene profiles of MM CAF. The profile intersection produced only one gene: ENPP2 (ectonucleotide pyrophosphatase/phosphodiesterase or autotaxin-ATX; illustration is provided in Figure 5). Autotaxin is an exo-enzyme originally identified as an autocrine motility factor of the cancer cell. ATX is unique among nucleotide pyrophosphatase/phosphodiesterase (NPPs) as it functions primarily as lysophospholipase D, converting lysophosphatidylcholine into the lipid mediator of LPA. Lysophosphatidic acid acts on specific G protein–coupled receptors to elicit a wide range of cellular responses, ranging from cell proliferation and migration to the production of cytokines.75,76

ECM (extracellular matrix). The ENPP2 protein, common to the CAFs of the 4 tumors analyzed, catalyzes the LPC hydrolysis in LPA, activating its local LPA receptors and the corresponding G proteins. LPA signals through its receptors to induce proliferation, survival, and invasion in tumor cells and cancer stem cells. LPA signaling also induces the recruitment of CAFS cells and a wide range of cellular responses and also reduces the cytotoxic immune response.
Discussion
The transcriptome analysis of colon, ovary, and breast tumors selected a subgroup of 108 genes by NMF-based methodology identifying a CAF phenotype with morphological and functional characteristics regardless of embryonic origin. In fact, the APOBEC3B and APOBEC3G genes confer susceptibility to mutations that determine the heterogeneity of CAF. The TGFBR3 genes, CDH1, determine the plasticity that leads to EMT, an event that demonstrates the active state of fibroblasts, to which we also associate the genes ROCK1 and COL14A1. In addition, in TME, the functional role of CAFs has shown the involvement of growth factor pathways such as PDGF and IGF, alpha adrenergic and glutamate receptors, as well as hormones such as cholecystokinin and gastrin and the ability to activate cells linked to immune response such as T lymphocytes and B lymphocytes (HLA-DQA1, PNP, and ENPP2). All these events are controlled by transcription factors (FOS, FLI1), by the regulation of transport mechanisms (TAP2, DNAJC13), by transduced signals (ITPR1), and by degradation processes (FBXO9, TRIM2). The genes obtained from the intersection of the subgroup of the 3 tumor histotypes with the MGUS metagene consolidate the hypothesis of a “primitive” recruited CAF, adaptable to a hypoxic TME (EIF4E2) and which has assumed the role of barrier (IFT80, GPC6), with an anti-inflammatory action (ANXA1, UBA6), of immunological control and repair with HLA-DQA1 and PMS1 proteins. The intersection of the subgroup of the 3 tumor histotypes with the MM metagene primarily drastically reduces the number of common genes and delivers to the analysis only the ENPP2 gene, which identifies a phenotype of pro-inflammatory CAF. Therefore, the CAF recruited from the BM, coming from MGUS, a non-pathological condition, could assume a barrier function toward the tumor, and instead the primary fibroblasts from MM, they represent a pro-inflammatory CAF phenotype which makes TME even more pro-tumorigenic probably in favor of the expansion of the fibroblastic clone which proliferates “in situ.” In fact, the ATX-LPA axis that induces LPA production in many tumors is overexpressed and affects different phases of the disease, starting from inflammation, development, and progression of the tumor. The results show that the CAF phenotype that emerges in the 3 tumor histotypes analyzed is characterized by the action of genes that modulate heterogeneity (APOBEC3B, APOBEC3G). The different subpopulations generated have a common line that, regardless of the starting tissue, is given by the genes: CDH1, COL14A1, DNAJC13, ENPP2, FBXO9, FLI1, HLA-DQA1, ITPR1, PNP, ROCK1, TAP2, TGFBR3, and TRIM2. Therefore, the genes just listed could be used as biomarkers, as well as the CAF genes recruited by the BM, in particular the ENPP2 gene.
Conclusions
We proposed a mathematical methodology based on NMF, which has been originally assembled for automatically extracting common genes from different gene expression data. This computational mechanism has 2 main features: (1) through NMF method, metagenes which are the most representative of the information embedded into different tumor gene expression data are extracted; (2) through basic mathematical set operations (implemented into the gene landscape extraction module), genes common to different tumor histotypes are selected. These genes can then be easily analyzed from a biological point of view through to the functional and the visualization approaches based on the WebGestalt tool, which integrates the computational mechanisms.
The proposed mechanism demonstrated its usefulness in identifying genes which could be helpful to better understand the molecular mechanisms behind the activation of fibroblasts and their role in tumor progression. Different CAF subpopulations in the TME can be distinguished from one another by the expression of one or more specific markers. In general, CAFs have the common function of altering the TME; in fact, once activated, fibroblasts synthesize and deposit ECM components, release chemokines and cytokines in the stroma, and generate tension forces at the tissue level through their cytoskeletons, all are requirements key for tissue remodeling. The multifaceted nature of CAF is therefore linked to the TME in which the various pathways are activated as the mechanism based on the TGF-β signal and/or the bidirectional communication between the fibroblasts and the tumor cells.
Our study has shown that, even if there is phenotypic heterogeneity of CAF (APOBEC3B, APOBEC3G), in tumors of different embryonic origin, there are common biomarkers, characterizing the phenotype of activated fibroblasts. Furthermore, we were able to identify a phenotype of CAF as an anti-inflammatory (ANXA1, UBA6) likely associated with the first stages of tumor transformation and subsequently pro-inflammatory with the ENPP2 gene, which activates the ATX-LPA axis, which is responsible for numerous events involved in the development and progression of the tumor. Therefore, the “in situ” fibroblasts, in the tumors studied, acquire a more heterogeneous phenotype because they are induced by genes that favor heterogeneity and by the stimuli coming from the TME associated with the different tumor histotypes. Naturally, this result constitutes a further aid to the difficult challenge to characterize the CAF, to counteract their action in the TME, which allows to be able to improve the clinical-therapeutic approaches.
Supplemental Material
Supplementary_File_1_xyz32442b9e8854b – Supplemental material for An NMF-Based Methodology for Selecting Biomarkers in the Landscape of Genes of Heterogeneous Cancer-Associated Fibroblast Populations
Supplemental material, Supplementary_File_1_xyz32442b9e8854b for An NMF-Based Methodology for Selecting Biomarkers in the Landscape of Genes of Heterogeneous Cancer-Associated Fibroblast Populations by Flavia Esposito, Angelina Boccarelli and Nicoletta Del Buono in Bioinformatics and Biology Insights
Supplemental Material
Supplementary_File_2_xyz32442e5519468 – Supplemental material for An NMF-Based Methodology for Selecting Biomarkers in the Landscape of Genes of Heterogeneous Cancer-Associated Fibroblast Populations
Supplemental material, Supplementary_File_2_xyz32442e5519468 for An NMF-Based Methodology for Selecting Biomarkers in the Landscape of Genes of Heterogeneous Cancer-Associated Fibroblast Populations by Flavia Esposito, Angelina Boccarelli and Nicoletta Del Buono in Bioinformatics and Biology Insights
Supplemental Material
Supplementary_File_3_xyz324423708d119 – Supplemental material for An NMF-Based Methodology for Selecting Biomarkers in the Landscape of Genes of Heterogeneous Cancer-Associated Fibroblast Populations
Supplemental material, Supplementary_File_3_xyz324423708d119 for An NMF-Based Methodology for Selecting Biomarkers in the Landscape of Genes of Heterogeneous Cancer-Associated Fibroblast Populations by Flavia Esposito, Angelina Boccarelli and Nicoletta Del Buono in Bioinformatics and Biology Insights
Supplemental Material
Supplementary_File_4_xyz324420b6b3b2c – Supplemental material for An NMF-Based Methodology for Selecting Biomarkers in the Landscape of Genes of Heterogeneous Cancer-Associated Fibroblast Populations
Supplemental material, Supplementary_File_4_xyz324420b6b3b2c for An NMF-Based Methodology for Selecting Biomarkers in the Landscape of Genes of Heterogeneous Cancer-Associated Fibroblast Populations by Flavia Esposito, Angelina Boccarelli and Nicoletta Del Buono in Bioinformatics and Biology Insights
Supplemental Material
Supplementary_File_5_xyz32442f879d720 – Supplemental material for An NMF-Based Methodology for Selecting Biomarkers in the Landscape of Genes of Heterogeneous Cancer-Associated Fibroblast Populations
Supplemental material, Supplementary_File_5_xyz32442f879d720 for An NMF-Based Methodology for Selecting Biomarkers in the Landscape of Genes of Heterogeneous Cancer-Associated Fibroblast Populations by Flavia Esposito, Angelina Boccarelli and Nicoletta Del Buono in Bioinformatics and Biology Insights
Footnotes
Author Contributions
AB designed the research and analysed the numerical results. NDB and FE performed the mathematical analysis and the data preprocessing. FE designed and implemented the framework modules. AB, NDB and FE drafted and rieviewed the manuscript and did the critical revision of the final version of the paper. All the authors read and approved the manuscript in its final form.
Declaration of conflicting interests:
The author(s) declared no potential conflicts of interest with respect to the research, authorship, and/or publication of this article.
Funding:
The author(s) disclosed receipt of the following financial support for the research, authorship, and/or publication of this article: This work was supported in part by the GNCS-INDAM (Gruppo Nazionale per il Calcolo Scientifico of Istituto Nazionale di Alta Matematica) Francesco Severi, P.le Aldo Moro, Roma, Italy.
Supplemental material
Supplemental material for this article is available online.
*
INDAM Research Group GNCS.
References
Supplementary Material
Please find the following supplemental material available below.
For Open Access articles published under a Creative Commons License, all supplemental material carries the same license as the article it is associated with.
For non-Open Access articles published, all supplemental material carries a non-exclusive license, and permission requests for re-use of supplemental material or any part of supplemental material shall be sent directly to the copyright owner as specified in the copyright notice associated with the article.