
Abstract
Protein-protein interactions govern all molecular processes for living organisms, even those involved in pathogen infection. Pathogens such as virus, bacteria, and parasites contain proteins that help the pathogen to attach, penetrate, and settle inside the target cell. Thus, it is necessary to know the regions in pathogenic proteins that interact with host cell receptors. Currently, powerful pathogen databases are available and many pathogenic proteins have been recognized, but many pathogenic proteins have not been characterized. This work developed a program in MATLAB environment based on the time-frequency analysis to recognize important sites in proteins. Our program highlights the highest energy patches in proteins from their time-frequency distribution and matches the corresponding frequency. We sought to know if this approach is able to recognize stretches residues related to interaction. Our approach was applied to five study cases from pathogenic co-crystallized structures that have been well characterized. We searched the frequencies that characterize interaction regions in pathogenic proteins and with this information tried to identify new interaction patches in either paralogs or orthologs. We found that our program generates a well-interpretable graphic under several descriptors that can show important regions in proteins even those related to interaction. We propose that this MATLAB program could be used as a tool to explore outstanding regions in uncharacterized proteins.
Keywords
Introduction
Protein-protein interactions (PPIs) govern all molecular processes of living organisms, including infections. When pathogens such as virus, bacteria, and parasites invade a host cell, they use membrane proteins to attach to some receptors in the host and these contacts allow the pathogens to penetrate the target cell.1,2 Once inside, the pathogen releases protein factors that interact with intra-cell proteins and kidnap the host mechanisms for their own benefits.3–5 The driving forces that rule the interaction between two proteins lie in certain regions hidden in the primary structure of the proteins; therefore, the discovery of these regions in pathogenic proteins is essential to implement future therapies that could block pathogen infections. 6 Most computational tools to infer interacting regions in proteins require three-dimensional (3D) structure information from protein complexes; unfavorably, the majority of PPI complexes have no crystallography information, which is why inferences for interaction regions should be predicted from the primary structure of proteins stored in the pathogen databases. 7 Many of the interaction regions in proteins rely on their short linear motifs (SLiMs). They are short stretches of amino acids normally located in the intrinsic disorder region.8–10 Most are conserved in eukaryotes even in pathogens, but most of the pathogenic proteins that participate in host cell invasion are often highly divergent from eukaryote homologs. 11
The informational spectrum method (ISM) is based on the primary structure of a protein, where each amino acid of the primary chain is translated into a numerical index to obtain a numerical sequence and each numerical index represents a particular physical or biochemical property for the 20 amino acids. Afterward, a Fourier transform (FT) is applied to the numerical sequence obtained; therefore, the information defined by the amino acid sequence itself can be observed in the form of informational spectrum (IS). In the IS of a protein, the maximum amplitude correlates with the highest repetition pattern in the sequence and the frequency for this amplitude carries relevant information that can represent either a functional or an interaction relation. Thus, when comparing the IS from two proteins and both have at least one common frequency with a higher amplitude, it means that both proteins share some information that could be either functional or structural.2,12–14 Most of the literature where IS was applied merely compare the frequencies obtained in the IS, where proteins belonging to the same family or performing the same function share at least one frequency peak with the highest amplitude. This approach has been used to classify and predict the function/structure of unknown proteins or peptides.2,15–17 The next step maps the region in a protein that is responsible for that particular frequency. Hence, we evaluated if the time-frequency analysis (TFA) approach is capable of recognizing interaction regions in a protein with a particular frequency/amplitude.
This work expands the ISM approach by including the TFA. The TFA was applied in Hassani Saadi et al 18 to find local structure periodicities in DNA, but we expanded the search of this approach to look for interacting regions in pathogenic proteins from intraspecific recognized pathogen PPI. Finally, we developed a program in MATLAB that generates a well-interpretable graphic that could show interaction regions either in paralog or ortholog pathogenic proteins. Our program was assessed in five case studies.
Materials and Methods
Dataset
We performed an exploratory analysis from six Protein Data Bank (PDB) structures extracted from the National Center for Biotechnology Information (NCBI) structure summary (www.ncbi.nlm.nih.gov/Structure) to locate the exposed regions from each protein. The PDB used are the following: 3ZLD, 5NQG, 5NQF, 3ZWZ, 4Z80, 4LV5. Although the PDB structures show all the interaction regions exposed to their substrate, we also supported all the information about the PPI with the literature reported for each PDB.
Time-frequency analysis
Since the distance between amino acid residues in a protein sequence is about 3.8 Å, most of corresponding numeric representations can be analyzed as a equidistance realization (or time series) from some stochastic process that can be stationary or not. Stationary can be strong or weak; strong stationarity establishes the same probability distribution of
The second-order structure most used in practice to analyze a stationary time series

where

The spectrum

represents the cross-covariance between

Because of the relationship

and satisfies
On the other hand, since several studies have reported the non-stationarity feature of genomic and biomolecular sequences, 18 time-dependent spectra are an useful tool to identify localized characteristics of a protein. For instance, “hot spot” aminoacids or motifs that most contribute to a specific frequency that describes either a biological function or an interaction. 1
For a real-valued signal
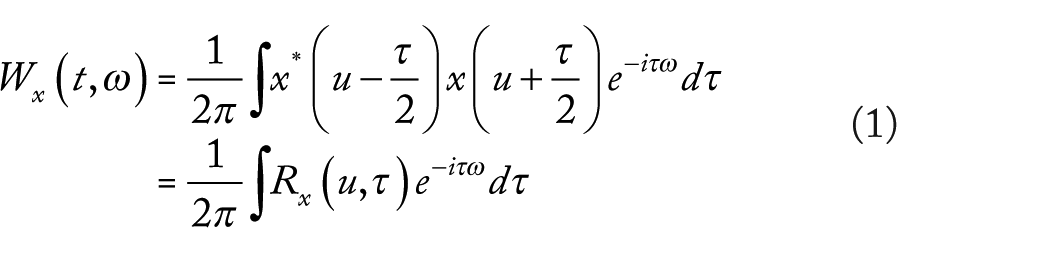
where

Even though WV transform looks like a powerful tool to analyze the time-frequency features of a signal, this is not the case due to the interferences created by the cross terms in equation (1). These interferences can be attenuated by smoothing the WV transform as proposed by Cohen 21 ; however, the consequence of this is a decrease of the time and frequency resolutions, and more generally a loss of theoretical properties. The general family of Cohen’s quadratic TFDs is

where
A simulation example
To illustrate how local covariations can be detected from TFA, we generate 1000 bivariate time series


and errors

One simulated signal

Coherence between the two random signals
ISM procedure
The MATLAB program was loaded with 631 molecular descriptors (Supplementary Material 1). The proteins were translated for each molecular descriptor obtaining 631 numerical series for each protein. Thereafter, we applied a discrete Fourier transform (DFT) for each numerical series and then TFA was applied for each FT. Finally, we obtained 631 matrices for each protein evaluated. Here, we introduced a threshold value to highlight the highest energy density sites for each matrix and search if the densities obtained for each matrix lie on a position that matches the interaction region and a particular frequency. The frequency value matching the highest density energy in an interaction region is then used to search interaction regions in either ortholog or paralog proteins. Our program was assessed in five case studies. Supplementary information 2 includes the user manual for the MATLAB program. The MATLAB program is stored in Additional file 1.
Results
Case studies
Application of the MATLAB TFA program to the TgRON2 protein looking for an interaction region
First, we downloaded the complete protein sequence for Toxoplasma RON2 TgRON2 in FASTA format, then we searched for the interaction regions in the sequence from the PDB 3ZLD, which describes the interaction between the TgAMA1 protein and a peptide derived from TgRON2. 26 The authors considered that a peptide in TgRON2 that covers the amino acids from 1003 to 1028 1003-FLTDSGMKAIEDCSWNPIMQQMACVV-1028 interacts with TgAMA1. 26 Therefore, we applied the TFA program to the TgRON2 sequence to observe if the energy density lies in the location 1003-1028. We found that the MATLAB TFA program highlighted the TgRON2 1003-1028 region in eight descriptors with 0.80 threshold. The energy patch obtained matches with a particular interval frequency (0.346 ± 0.001), where the interaction peptide in TgRON2 is located (Table 1 and Figure 3).
Description of all the results obtained in the five case studies.

Abbreviations: Descpts, descriptors; PDB, Protein Data Bank; Rfc, references; S.F., shared frequencies; Trshl, threshold.
Includes all the regions chosen for the studies, descriptors that showed similar frequencies for each study case, and related information. Descriptors shared in the paralog/ortholog proteins appear in italics.
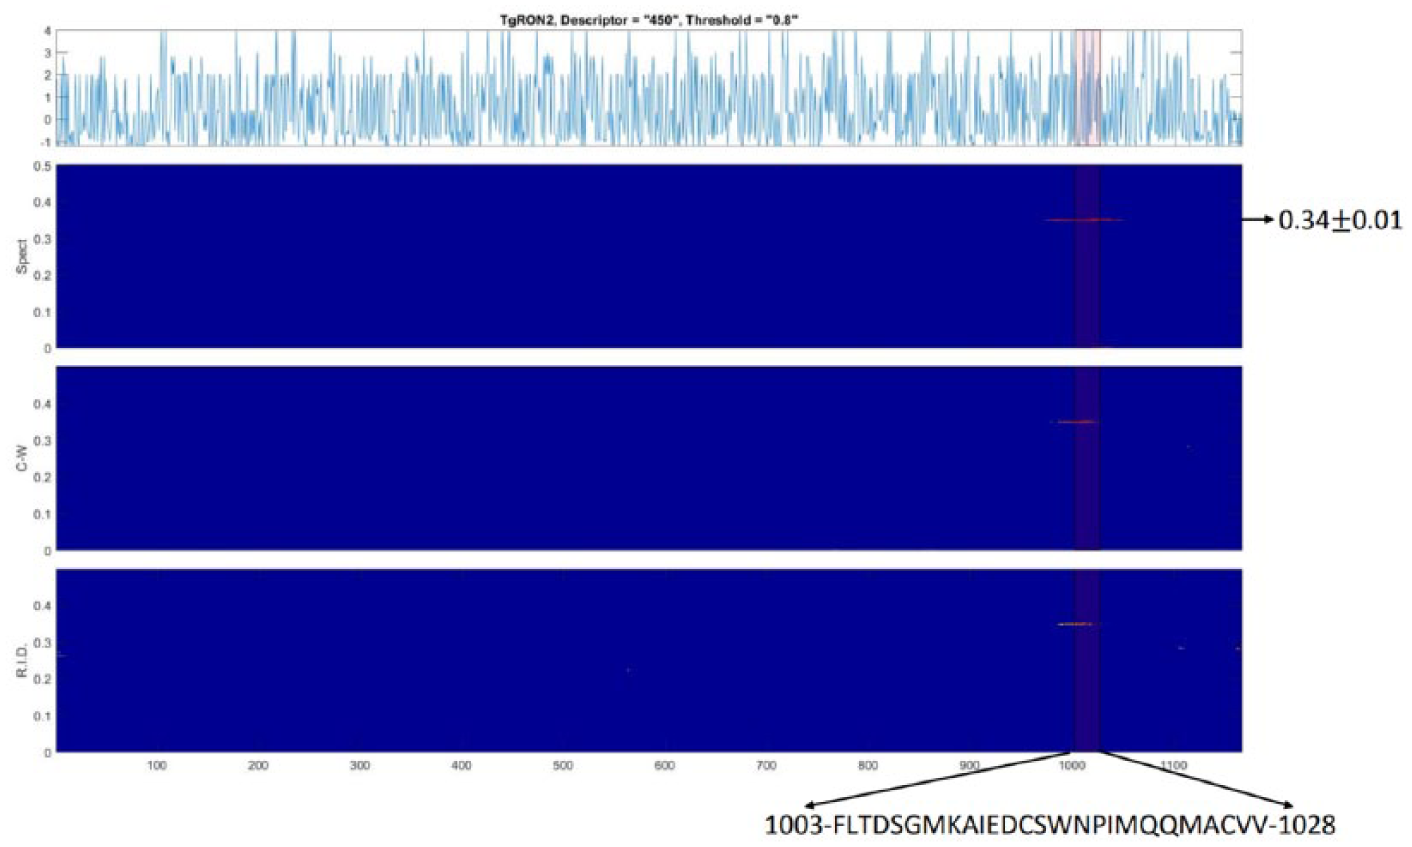
MATLAB TFA application in TgRON2. The graphic shows the higher energy patch for the three distributions in an interval frequency (0.346 ± 0.001) that covers the 1003-FLTDSGMKAIEDCSWNPIMQQMACVV-1028 region where the TgRON2 interaction peptide is located. This finding was obtained under the descriptor (450) (Supplementary Material 1). The graphics obtained for the eight descriptors in TgRON2 are in Additional file 2. C-W indicates Choi-Williams; R.I.D., reduced interference distribution; Spect, Spectrogram.
The frequency in the PVRON2 interaction peptide matches the ortholog PFRON2 interaction peptide
Similar to the case above in TgRON2, the interaction region in PVRON2 was obtained from PDB 5NQG. This is a peptide 31 residues long from the PVRON2 C-terminus region 2039-HATDIGMGPATSCYTSTIPPPKQVCIQQAVK-2069. 27 We took the complete protein sequence of PVRON2 and applied the MATLAB TFA program to extract the frequency that highlights the interaction peptide 2039-2069. We found two descriptors with 0.6 threshold that highlighted the 2039-2069 region with a frequency around 0.33 ± 0.005 in PVRON2 (Figure 4, Table 1, and Additional file 2). Then, we explored if the frequency (0.33) also matches the ortholog PFRON2 interaction peptide 2028-DIGAGPVASCFTTRMSPPQQICLNSVVN-2055 (see PDB 3ZWZ). 28 Applying our bio-informatics approach to the complete PFRON2 sequence, we found that effectively the frequency (0.33) also highlights the interaction peptide 2028-2025 with the same threshold (Figure 4). PVRON2 and the ortholog PFRON2 only shared two descriptors that showed the frequency (0.33) in their respective interaction peptides (Table 1, and Additional file 2). However, the frequency (0.33) in PFRON2 was also found in five other descriptors (Additional file 2).

MATLAB TFA application in PVRON2 and the ortholog PFRON2. The graphic shows both energy patches in an interval frequency (0.33 ± 0.005) that covers the (B) 2039-HATDIGMGPATSCYTSTIPPPKQVCIQQAVK-2069 and (A) 2028-DIGAGPVASCFTTRMSPPQQICLNSVVN-2055 regions for PVRON2 and PFRON2, respectively. Both peptides were considered interaction interfaces in Vulliez-Le Normand et al.27,28 These findings were obtained under descriptors (68 and 612) (Supplementary Material 1). The seven graphics for PFRON2 and the two graphics for PVRON2 are in Additional file 2. C-W indicates Choi-Williams; R.I.D., reduced interference distribution; Spect, Spectrogram.
The frequency in the PVAMA1 interaction region matches the ortholog PFAMA1 interaction region
By applying the same protocol above to find interaction regions, we obtained the interaction region in Plasmodium vivax AMA1 PVAMA1 from PDB 5NQG; the authors who described this structure recognized an interaction region in PVAMA1 that covers the 168-SFVMA-172 amino acids. 27 Then, we applied our MATLAB program to PVAMA1 complete sequence to find a frequency that highlights the 168-172 region. We found seven descriptors that indicated an interval frequency (0.39 ± 0.01) that highlighted the 168-172 region with 0.6 threshold (Table 1 and additional file 2). Thereafter, we used this information to find interaction regions in the ortholog Plasmodium falciparum AMA1 PFAMA1. We found a relevant interaction region recognized in PFAMA1 from the amino acid 222 to 227 in nine descriptors (Additional file 2). This 222-GNMNPD-227 patch in PFAMA1 was previously recognized as an interface interaction in the PDB 5NQF. 27 PVAMA1 and the ortholog PFAMA1 only shared one descriptor that showed the frequency (0.39) in their respective interaction patches (Table 1) (see all the graphics for PFAMA1 and PVAMA1 in Additional file 2).
The frequency TgAMA1 interaction region matches the paralog TgAMA4 interaction region
We recognized the interaction region in Toxoplasma gondii AMA1 TgAMA1 from PDB 3ZLD that covered two patches, 183-QVYTS-187 and 222-TIAV-225, 26 and our MATLAB program showed a frequency around (0.217 ± 0.001) that highlights both 183-187 and 222-225 patches in nine descriptors with 0.6 threshold (Figure 5A and Additional file 2). We used this information to look for the interaction region in TgAMA4. We found the 209-YTLHCPYNVNVYRQD-223 interaction patch in four descriptors in TgAMA4 (Figure 5B and additional file 2). The authors who described TgAMA4 published that amino acids 209, 211, 215, and 223 are part of the interaction interface of TgAMA4, and these amino acids interact by hydrogen bonds with their respective protein substrate. 11 In this case, TgAMA1 and the paralog TgAMA4 shared one descriptor that showed the frequency (0.217) in their respective interaction regions (Table 1) (additional file 2).

MATLAB TFA application in TgAMA1 and the paralog TgAMA4. The graphic shows an energy density in a frequency (0.217 ± 0.001) that covers patches 183-QVYTS-187 and 222-TIAV-225 in TgAMA1 (A), and patch 209-YTLHCPYNVNVYRQD-223 in TgAMA4 (B). The three patches were considered interaction regions in the previous works.11,26 These findings were obtained under descriptor (612) (Supplementary Material 1). The nine graphics for TgAMA1 and the four graphics for TgAMA4 are in Additional file 2. C-W indicates Choi-Williams; R.I.D., reduced interference distribution; Spect, Spectrogram.
The frequency in IRGa6 helix 4 matches the paralog cimIRGb2-b1 helix 4 interaction region, but not in the paralog labIRGb2-b1 helix 4
Immunity-related guanosine triphosphatases (IRGs) are interferon-inducible proteins that mediate cell autonomous resistance against intracellular pathogens.3-5,29–32 These IRGs are well characterized in mice and can accumulate onto vacuolar membrane-coated parasites. Toxoplasma gondii is a well-adapted parasite able to avoid immune responses in susceptible mice; the process is driven by toxoplasma kinase and pseudokinase proteins called ROP and now it is known that the interaction mechanisms between ROPs and IRGs produce the balance between virulence and resistance in mice.3–5,29–32 For instance, in susceptible mice (lab mice), the parasite secretes the pseudokinase ROP5 and this protein directly interacts with IRGa6 blocking its clearing activity onto the parasite vacuole allowing the parasite replication.3-5,29–32 In the case of the CIM strain, which is a toxoplasma natural resistance strain of mice, an allele of the IRGb2-b1 protein, which also interacts with ROP5, allows the IRGa6 to break the parasite vacuole, preventing parasite replication.4,29–32 For susceptible mice, they have also an allele copy for IRGb2-b1, but mutations in this copy cause no interaction with ROP5 allowing mice death.4,29–32 So then, we wanted to analyze this resistance/virulence mechanism with our MATLAB program, so we extracted the IRGa6 interfaces from the PDB 4LV5, which describes the interaction between IRGa6 and ROP5B3–5; the authors who analyzed this interaction suggest that helix 3 and helix 4 in IRGa6 mediate the interaction with ROP5B. According to our bio-informatics approach, we found that 11 descriptors showed a frequency (0.454 ± 0.001) that highlights the amino acids that lie in helix 4 in IRGa6 208-DIRLNCVNTFREN-220 with 0.7 threshold (Table 1 and Figure 6A). In Lilue et al, 4 the authors suggest that helix 4 in IRGb2-b1 CIM mouse is the interface region that also interacts with ROP5; then, we searched if the frequency (0.454) obtained in the IRGa6 helix 4 also highlights helix 4 in either cimIRGb2-b1 (resistance mice) or labIRGb2-b1 (susceptible mice). Interestingly, similar to what other authors reported, a high-energy patch was found that lies in helix 4 in cimIRGb2-b1 mouse sequence, but it was not found in helix 4 in labIRGb2-b1 mouse sequence (Figure 6B and C). IRGa6 and the paralog cimIRGb2-b1 shared the frequency (0.454) in their respective helix 4 interaction regions in one descriptor (Table 1 and additional file 2).

MATLAB TFA application in IRGa6 and their paralogs cimIRGb2-b1 and labIRGb2-b1. The graphic shows two energy patches in a frequency (0.454 ± 0.001) that covers both helix 4 208-DIRLNCVNTFREN-220 in IRGa6 (A) and helix 4 194-NRENILKSLRNCISSNLKEC-213 in cimIRGb2-b1 (B), but there was no energy patch found in helix 4 194-NRENILKSIRICLSSNLKER-213 in labIRGb2-b1 (C). These findings were obtained under descriptor (391) (Supplementary Material 1). The 11 graphics for IRGa6 and the graphics for cimIRGb2-b1 and labIRGb2-b1 are in additional file 2. C-W indicates Choi-Williams; R.I.D., reduced interference distribution; Spect, Spectrogram.
Discussion
Looking for interaction regions in proteins is a hard task even by means of bio-informatics approaches; this is because interaction information lies in small regions in the protein even on a few single amino acids. For that reason, it is necessary to design computational approaches that help researchers to get hints about the sites in the proteins that promote interactions. Our MATLAB program was designed seeking to obtain important regions in proteins and projecting a clearer visualization of the information. We suggest that our MATLAB program could be a complementary approach to include in protein analysis.
We observed that the three TFA distributions showed energy in the interaction region suggested in all the examples, but the spectral distribution was clearer distinguishing the energy patches in proteins. Although only a few descriptors had been able to locate energy regions related to interactions, we suggest that if a number of descriptors highlights the same region in a protein in the same range of frequency, this region must be relevant in that protein. We also realized that as we increase the threshold, the more prominent energy patches rise up in the figure. For instance, we observed in the first case study that the TFA approach was capable of highlighting the specific interaction peptide in TgRON2 with a very specific frequency (0.346 ± 0.001) in eight descriptors with 0.80 threshold (Figure 3 and additional file 2). Thus, we could locate important regions in proteins where we would have no knowledge otherwise. Similarly, in our second study, the PFRON2 protein showed a specific frequency (0.33), also shared with the ortholog PVRON2 (Figure 4).
We also observed in the figures 5 and 6 more prominent energy patches in protein regions probably not related to interaction (Figures 5 and 6). That means large regions that conserve more local periodicities, like secondary structures, may stand out more than interaction patches because interaction regions lie in only a few amino acids with not enough periodic information.
We suggest that the frequencies and the energy patches shared either in the ortholog or in the paralog interaction regions are not because of sequence similarities given that no sequence conservation exists between regions analyzed (Table 1). Even in case study 5, where we compared helix 4 from cimIRGb2-b1 and labIRGb2-b1, both helices are highly conserved at sequence level (Table 1); however, the MATLAB program showed that the energy density in both helices is quite different (Figure 6B and C and additional file 2). It may mean that the TFA program is highly sensitive even to smaller differences in the primary sequence of the proteins and it can reflect the importance of these sites in the overall energy density in a particular region in a protein.
We consider that our program works best when the region to find is larger than 20 amino acids and it is inconclusive if the region we are looking for is a smaller stretch of amino acids. Most computational programs to identify interaction regions in proteins come from either profile-based methods or conservation of clue amino acids in the intrinsic disorder regions.8–10 Because most pathogenic proteins follow a specialized co-evolutionary process regarding their host, we would not expect profile-based methods to find conserved interaction motifs for these kinds of proteins. For that reason, we used co-crystallized PDB structures to locate experimentally recognized interaction interfaces in pathogenic proteins to evaluate our program. We consider that these few examples analyzed were promising and suggest that the MATLAB program works suitably, given that it was able to find large interaction patches proposed in the PDB analyzed.
Conclusions
The MATLAB TFA program generates a well-interpretable graphic that can show important regions in proteins, even those related to protein interactions. We propose that this MATLAB program can be a starting point analysis tool to locate important regions in proteins, especially those lacking 3D structure information or without characterization. Our program can also be applied to a different context not only to pathogenic paralog/ortholog proteins.
Supplemental Material
Supplementary_material_1 – Supplemental material for Time-Frequency Approach Applied to Finding Interaction Regions in Pathogenic Proteins
Supplemental material, Supplementary_material_1 for Time-Frequency Approach Applied to Finding Interaction Regions in Pathogenic Proteins by Ailan F Arenas, Nicolás Arango-Plaza, Juan Camilo Arenas and Gladys E Salcedo in Bioinformatics and Biology Insights
Supplemental Material
Supplementary_material_2 – Supplemental material for Time-Frequency Approach Applied to Finding Interaction Regions in Pathogenic Proteins
Supplemental material, Supplementary_material_2 for Time-Frequency Approach Applied to Finding Interaction Regions in Pathogenic Proteins by Ailan F Arenas, Nicolás Arango-Plaza, Juan Camilo Arenas and Gladys E Salcedo in Bioinformatics and Biology Insights
Footnotes
Funding:
The author(s) disclosed receipt of the following financial support for the research, authorship, and/or publication of this article: Awarded by COLCIENCIAS Colombia through grant 1113-744-55483.
Declaration of conflicting interests:
The author(s) declared no potential conflicts of interest with respect to the research, authorship, and/or publication of this article.
Author Contributions
NAP, GES, JCA, and AFA designed the approach and implemented the algorithm; all authors contributed to the discussion and revision of the manuscript, and all authors read and approved of the final manuscript.
Availability of Data and Material
Additional file 1: contains the MATLAB program.
Additional file 2: contains all the graphics obtained with the MATLAB program in the 5 case studies.
Supplementary material 1: contains the numerical descriptors used in this work.
Supplementary material 2: contains the user manual for the MATLAB program.
Supplemental Material
Supplemental material for this article is available online.
References
Supplementary Material
Please find the following supplemental material available below.
For Open Access articles published under a Creative Commons License, all supplemental material carries the same license as the article it is associated with.
For non-Open Access articles published, all supplemental material carries a non-exclusive license, and permission requests for re-use of supplemental material or any part of supplemental material shall be sent directly to the copyright owner as specified in the copyright notice associated with the article.