
Abstract
Background:
Reduced expression of thyroid hormone receptors (TRs) has been observed in various human malignancies, though its predictive value in hepatocellular carcinoma (HCC) remains uncertain.
Objective:
To explore the predictive value of TRs in patients with hepatocellular carcinoma.
Design:
The design was bioinformatic analysis combined with experimental study.
Methods:
This study utilized Kaplan-Meier analysis of TR expression profiles from The Cancer Genome Atlas (TCGA). Expression levels of TRs in HCC and immune single cells were assessed using datasets from the Gene Expression Omnibus (GEO) and TCGA, analyzed with R software. Cox and logistic regression analyses were also conducted. Functional assays, including wound healing, CCK-8, and Transwell migration assays, were employed to investigate the role of the THRB gene.
Results:
Kaplan-Meier analysis revealed that low THRB expression was significantly associated with reduced overall survival (OS), 5-year OS and disease-specific survival (DSS) in HCC patients (P < 0.05), while no significant association was found with THRA expression. Both Cox regression and logistic regression identified low THRB expression as an independent risk factor for HCC. THRB expression was significantly downregulated in tumor tissues compared to non-tumorous tissues in 3 GEO datasets and the TCGA profile. Functional assays confirmed that THRB inhibited HCC cell proliferation and migration. Additionally, single-cell RNA sequencing revealed that THRB was primarily expressed in CD16+ monocytes within tumor tissues and was associated with a poor OS rate.
Conclusion:
Reduced THRB expression, but not THRA, was correlated with decreased OS in HCC patients.
Introduction
Liver cancer is the second leading cause of cancer-related mortality, with hepatocellular carcinoma (HCC) accounting for approximately 90% of all primary liver cancer cases. 1 Moreover, a study based on the SEER registry projects shows that HCC incidence will continue to rise over the next 2 decades, peaking around 2030. 2 Accurate and timely diagnosis is crucial for making clinical decisions in HCC patients. Therefore, there is an urgent need to establish reliable clinical biomarkers for predictive purposes and to identify potential therapeutic targets for HCC treatment.
Thyroid hormone receptors (TRs) are ligand-regulated transcription factors that mediate the effects of thyroid hormones (T3 and T4) in cellular development, growth, and differentiation.3-4 In humans, 2 genes—thyroid hormone receptor alpha (THRA) and thyroid hormone receptor beta (THRB)-encode multiple TR isoforms, which are expressed in a tissue- and development-specific manner.5-7 Over the past few decades, significant progress has been made in understanding the role of TRs in maintaining normal cellular metabolic functions and their involvement in thyroid diseases.
Recent studies have demonstrated a strong association between TRs and various cancers. TR downregulation has been reported in several malignancies, including non-small cell lung carcinoma, pancreatic cancer, breast cancer, colon cancer, gastric cancer, and HCC.8 -14 Additionally, the prognostic value of TRs has been confirmed in breast and lung cancer.14 -16
However, the prognostic significance of TRs in HCC has yet to be fully evaluated. The role of TRs in HCC remains controversial, with some studies suggesting that TRs function as tumor suppressors that inhibit HCC cell proliferation,17,18 while other research indicates that TR overexpression is linked to tumor metastasis. 19 Consequently, assessing the predictive value of TR expression in HCC patients is essential.
This study investigates the relationship between TR expression and outcomes in HCC patients. By performing predictive analyses using TCGA profiles and evaluating TR expression in GEO and TCGA databases, our findings will contribute to improved clinical decision-making and offer valuable insights into the development and progression of hepatocellular carcinoma.
Materials and methods
Kaplan-Meier survival analysis
Kaplan-Meier (KM) analysis was conducted to evaluate the clinical predictive value of thyroid hormone receptor (THRA and THRB) expression in hepatocellular carcinoma (HCC) patients. Clinical data, TR expression profiles, and RNA-Seq V2 data from 369 HCC patients (TCGA, PanCancer Atlas) were obtained from the cBioPortal database (http://www.cBioPortal.org/).20,21 Patient information was matched to sample IDs using R software version 4.3.1. In total, 342 patients were included in the analysis, while 27 were excluded due to missing data. Of these, 341 patients underwent surgical resection, with no preoperative drug treatments administered, although surgical data for one patient was unavailable. The rate of R0 resection was 90.21%.
THRA and THRB expression values were ranked from highest to lowest, and patients were categorized into high- and low-expression groups based on whether their mRNA expression levels were above or below the median. Correlation analysis was performed to assess the relationship between THRA/THRB expression and survival rates, as well as clinical-pathological characteristics. KM analysis was conducted using GraphPad Prism version 9.0.
The mRNA raw data resource and description
Five GEO microarray series (GSE14520, GSE77314, GSE84005, GSE45436, and GSE60502), containing both HCC tumor and non-tumor samples, were obtained from the National Center for Biotechnology Information (NCBI) Gene Expression Omnibus (GEO, https://www.ncbi.nlm.nih.gov/geo/). Details of these GEO series are summarized in Table 1 .
The GEO series included in this analysis.

Normalized mRNA count data and gene annotation files for TCGA liver HCC samples were downloaded from UCSC Xena (http://xena.ucsc.edu/). The TCGA RNA-Seq dataset consisted of 424 samples, including 374 primary tumor samples and 50 normal tissue samples.
Bioinformatics analysis for identifying TR expression
Raw CEL files from the GEO microarray datasets were normalized using the quantile method of Robust Multichip Analysis (RMA) via the R package “affy.” 22 The normalized gene expression levels were presented as log2-transformed values following RMA.
Single-cell RNA sequencing (scRNA-seq) analysis of HCC (GSE140228) was conducted using R software 4.3.1 with the R package Seurat. GSE140228 contained transcriptomes of CD45+ immune cells for HCC patients from tumor tissue and adjacent liver tissue.
GraphPad Prism was used to compare THRA and THRB mRNA expression between tumor and non-tumor samples obtained from the TCGA and GEO databases.
Cell line and cell transfection
Human HCC cell lines Huh-7 and Hep-3B were originally purchased from the Chinese Academy of Sciences (Shanghai, China). The cells were cultured in DMEM (Gibco, Thermo Fisher Scientific) supplemented with 10% fetal bovine serum (HyClone, Thermo Fisher Scientific), 100 U/mL penicillin, and 100 mg/mL streptomycin in a humidified incubator at 37°C with 5% CO₂. The human THRB overexpression plasmid (pEX-3, pGCMV/MCS/Neo) were obtained from GenePharma (China), empty plasmid was used as control plasmid. The THRB sequence accession number is NM_000461.4 (Genebank, https://www.ncbi.nlm.nih.gov/nuccore/NM_000461.4). Transfection was performed using the Lipofectamine 3000 kit (Invitrogen, Thermo Fisher Scientific), and cells were harvested after 48 h. Transfection efficiency was assessed by qRT-PCR using the following primers: THRB (5’-GAACAGTCGTCGCCACATC-3’, 3’-GCTCGTCCTTGTCTAAGTAAC-5’) and GAPDH (5’-CAGGAGGCATTGCTGATGAT-3’, 3’-GAAGGCTGGGGCTCATTT-5’) CatLog: B661104, Sangon Biotech, China).
Wound closure assay
Cells were cultured in 6-well plates until 90% confluence. A sterile 20 μL micropipette tip was used to create a scratch in the cell monolayer, and the cells were washed 3 times with PBS to remove detached cells. The cells were then cultured in DMEM supplemented with 2% FBS, and images were captured every 24 h. Wound area measurements were conducted using Photoshop software (version 20.0). The percentage of wound closure was calculated as (wound area at 48 h/ wound area at 0 h) × 100%.
Cell proliferation assay
Cells were seeded at a density of 5 × 10³ per well in 96-well plates and incubated overnight to allow attachment. The cell proliferation index, measured as the optical density (OD) at 450 nm, was assessed using the CCK-8 Cell Counting Kit (Dojindo, Japan) with a plate reader at 0, 24, 48, 72, and 96 h. Prior to each measurement, a 1:10 dilution of CCK-8 solution was added to the wells and incubated for 30 min at 37°C.
Transwell assay
In the upper Transwell chamber (Corning, NY, USA), 5 × 10³ cells suspended in FBS-free DMEM were inoculated, while DMEM containing 10% FBS was added to the lower chamber. After 72 h, the cells were fixed with 4% paraformaldehyde and washed with PBS. The cells were then stained with 0.05% or 0.1% crystal violet, and images were captured at 100× magnification. The data were analyzed using NIH ImageJ software.
Western blotting
Total protein was extracted from cells, and the protein concentrations were measured using BCA protein assay kit (Cat No. G2026-200T, Servicebio, China). Protein samples were fractionated by 10 % SDS-PAGE and then transferred to PVDF membranes. After antibody incubation, western blotting was performed using enhanced chemiluminescent detection (WD-9413B, Liuyi, China). Antibodies included: THRB polyclonal antibody (Cat No.21007-1-AP, Proteintech, China), β-actin recombinant rabbit mAb (Cat No. db13986, Diagbio, China) and HRP conjugated Goat Anti-Rabbit IgG (H+L) (Cat No. GB23303, Servicebio, China).
Immunohistochemistry
Immunohistochemistry was performed following standard procedures. Briefly, tissue sections were deparaffinzed, hydrated, quenched, and blocked with Protein Free Rapid Blocking Buffer (Cat No. G2052-500ML, Servicebio, China), then incubated with THRB antibody overnight at 4 °C and treated with HRP-conjugated antibody at room temperature for 1 h. Tissue sections were counterstained with hematoxylin, dehydrated, mounted, and pictured under a light microscope. Antibodies included: Anti-THRB polyclonal antibody (Cat No. K108689P, Solarbio, China) and HRP conjugated Goat Anti-Rabbit IgG (H+L) (Cat No. GB23303, Servicebio, China).
Protein-protein interaction and pathway/biological process enrichment
Spearman correlation analysis was used to identify gene correlations. Genes with correlation coefficients greater than 0.5 and p values less than 0.05 were defined as THRB-related genes. These THRB-related genes were uploaded to the STRING database 23 to analyze protein-protein interactions. Gene annotations for the hub genes were obtained from the GeneCards human gene database (http://www.genecards.org).
The minimum required interaction score was set at 0.400 (medium confidence), and genes that did not interact with THRB were excluded. Gene ontology (GO) enrichment and Kyoto Encyclopedia of Genes and Genomes (KEGG) pathway were conducted using the R package clusterProfiler (https://guangchuangyu.github.io/software/clusterProfiler).
Tumor immunological features and drug sensitivity correlation of THRB
All immune infiltrating cells, including macrophages, neutrophils, dendritic cells, B cells, CD4+ T cells, and CD8+ T cells, were analyzed for their correlation with THRB expression using the TIMER database (https://cistrome.shinyapps.io/timer/). 24 Spearman correlation coefficients were adjusted for tumor purity. Statistically, a P-value less than .05 was considered significant.
The correlation between drug sensitivity and THRB mRNA expression was investigated using the BEST database (https://rookieutopia.com/app_direct/BEST/), based on data from the GDSC and TCGA-LICH databases.
Statistical analysis
The Gene expression and clinical data were analyzed using Student's t-test, t-test with Welch's correction, or the Chi-square test, depending on the variable types. GraphPad Prism version 9.0 and R software version 4.3.1 were used for statistical analysis. All error bars represent the mean ± SD. A two-tailed p-value less than 0.05 was considered statistically significant for all analyses, with the following significance levels: ****P < .0001, ***P < .001, **P < .01, and *P < .05.
Results
Associations between TRs and survival in HCC patients
The results indicated that THRA expression was not associated with survival rates in HCC patients (Figures 1A–C). In contrast, low THRB expression was significantly associated with poor overall survival (P = .0121, Figure 1D), 5-year OS (P = .0032, Figure 1E) and disease-specific survival (P = .0191, Figure 1F).

Kaplan-Meier analysis of TRs based on TCGA. Overall survival (A), 5-year (B) and disease-specific survival (C) comparison between high and low THRA groups of HCC patients. Overall survival (D), 5-year (E), and disease-specific survival (F) comparison between high and low THRB groups of HCC patients. Significant P values have been bolded.
Given the strong correlation between THRB and survival outcomes in HCC patients, additional subgroup survival analyses were performed. As shown in Figure 2, low THRB expression was significantly associated with poor overall survival in patients with neoplasm histologic grade 3-4 (P = .0088, Figure 2B), while no significant differences were observed in patients with grade 1-2 (P > .05, Figure 2A). Moreover, THRB under-expression was significantly correlated with poor survival in patients with stage I-II and stage III-IV HCC (P < .05, Figures 2C and D). In patients with Child-Pugh grade A, THRB downregulation was significantly associated with poor overall survival (P = .0156, Figure 2E), whereas no significant association was observed in those with Child-Pugh grade B-C (P = .9602, Figure 2F).

Subgroup analyses of overall survival comparison in different clinical groups. Histologic Grade (A and B), AJCC Stage (C and D), and Child-Pugh Grade (E and F) of THRB in HCC patients. Significant P values have been bolded.
Subgroup survival analysis based on basic clinical information also revealed that THRB downregulation was significantly associated with poor survival in patients with tumors, no vascular invasion, males, Asian ethnicity, with or without alcohol consumption, hepatitis virus infection, high AFP levels, no liver fibrosis, and R0 resection (P < 0.05, Supplementary Figures 1B, C, and E; Supplementary Figures. 2A, D–F, H–K). No significant associations were found in other groups (P > 0.05, Supplementary Figujres 1A, D, and F; Supplementary Figures. 2B, C, G, I, and L).
Cox regression analysis
Cox regression analysis was conducted to further evaluate the prognostic value of THRB in HCC patients using data from TCGA. Univariate Cox regression analysis revealed a significant association between low THRB expression, HCC stage III-IV, and non-R0 resection with poor overall survival (OS) (Figure 3A). Multivariate Cox regression analysis indicated that white and black/African American race, HCC stage IV, liver fibrosis, and low THRB expression were all significant risk factors for OS (Figure 3B). Univariate Cox regression analysis of THRA showed no significant association with OS (Supplementary Figure 3). All variables met the proportional hazards assumption, as confirmed by Schoenfeld residuals tests (Supplementary Figure 4).

Cox regression analysis. Univariate and multivariate Cox regression (A and B) based on TCGA clinical data. These analyses were performed by R software with R package survival, survminer, ggforest and ggplot2. ***P < .001, **P < .01 and *P < .05. All outcome data were italicized. # the summary of the analysis.
Logistic Regression Analysis
Multivariate binomial logistic regression and nomogram were performed using R software (Supplementary Figure 5 and Supplementary Table 1). The results demonstrated that low THRB expression was significantly associated with an increased risk of death, with an odds ratio (OR) of 2.56 (95% CI: 1.08–6.34, P = .0359). Next, all categorical variables were converted to numeric values, and patients with missing clinical data were excluded to conduct stepwise logistic regression (Supplementary Table 2) and receiver operating characteristic (ROC) analysis. The analysis revealed that the areas under the curve (AUCs) for the three significant variables—Histologic Grade, Race, and THRB Expression—were 0.536, 0.661, and 0.592, respectively (Figure 4A), with a combined AUC of 0.756. The risk survival status plot showed that patients with higher risk scores were associated with a higher probability of death and shorter overall survival (Figures 4B and 4C).

ROC analysis (A) and risk survival status plot (B, C) based on stepwise logistic regression. These analyses were performed by R software with R package ggplot2 and pROC.
In conclusion, low THRB expression was identified as an independent risk factor for HCC patients. The predictive model based on histologic grade, race, and THRB expression demonstrated strong predictive accuracy in HCC patients.
Effect of THRB on HCC cells proliferation and migration
Since low THRB expression level was an independent risk factor for HCC patients, we then further investigated the role of THRB at the cellular level by increasing the gene expression level of THRB. HCC cancer cell lines Huh-7 and Hep-3B were transfected with either THRB overexpression or control plasmids.
Wound closure assays demonstrated that the cell healing rate was significantly inhibited in the THRB overexpression group compared with the control group (Figures 5A, C and D). Similarly, Transwell assays revealed a significant reduction in the number of migrated cells in the THRB overexpression group (Figures 5B, E and F). Additionally, CCK-8 assays showed that THRB overexpression significantly suppressed HCC cell proliferation (Figures 5I and J). The efficiency of THRB overexpression was confirmed through qRT-PCR analysis and Western blot (Figures 5G, H and K). These findings suggest that THRB can inhibit tumor growth in HCC.

THRB suppresses the proliferation and migration of HCC cells. Wound closure assays (A), Transwell assays (B) indicate the migration ability of Huh-7 and Hep-3B cells transfected with control and THRB. (C and D) Graphical representation of data presented in Figure 5A. (E and F) Graphical representation of data presented in Figure 5B. The qPCR analysis of THRB cell transfection efficiency (G and H). CCK-8 assays (I and J) indicate the proliferation ability. Western Blot validation of THRB in Huh-7 and Hep-3B cell transfected with control and THRB (K), OE represents overexpression. Student’s t-tests were performed, ****P < .0001, ***P < .001, **P < .01, *P < .05, ns P > .05. All micrographs are given in 100-fold magnification.
Taken together, these results suggested that THRB acted as a tumor suppressor in HCC.
TRs expression comparison
Low THRB expression level led to poor OS in HCC patients, so we next compared the expression level of THRB in normal liver samples and HCC samples to evaluate the proportion of THRB downregulation HCC patients in multiple datasets. The details of the GEO series used in this study are presented in Table 1.
THRB expression in tumor samples was significantly lower than in non-tumor samples in the TCGA, GSE14520, GSE77314, and GSE84005 datasets (all P < .01, Figures 6A–D). However, no significant differences were observed in the GSE60502 and GSE45436 datasets (Figures 6E and F). The expression level of THRB in HCC tissue and matched para-carcinoma tissue samples were also analyzed using immunohistochemistry experiments. As shown in Figure 6G, the expression of THRB was observed in para-carcinoma tissue but not in HCC tissue.
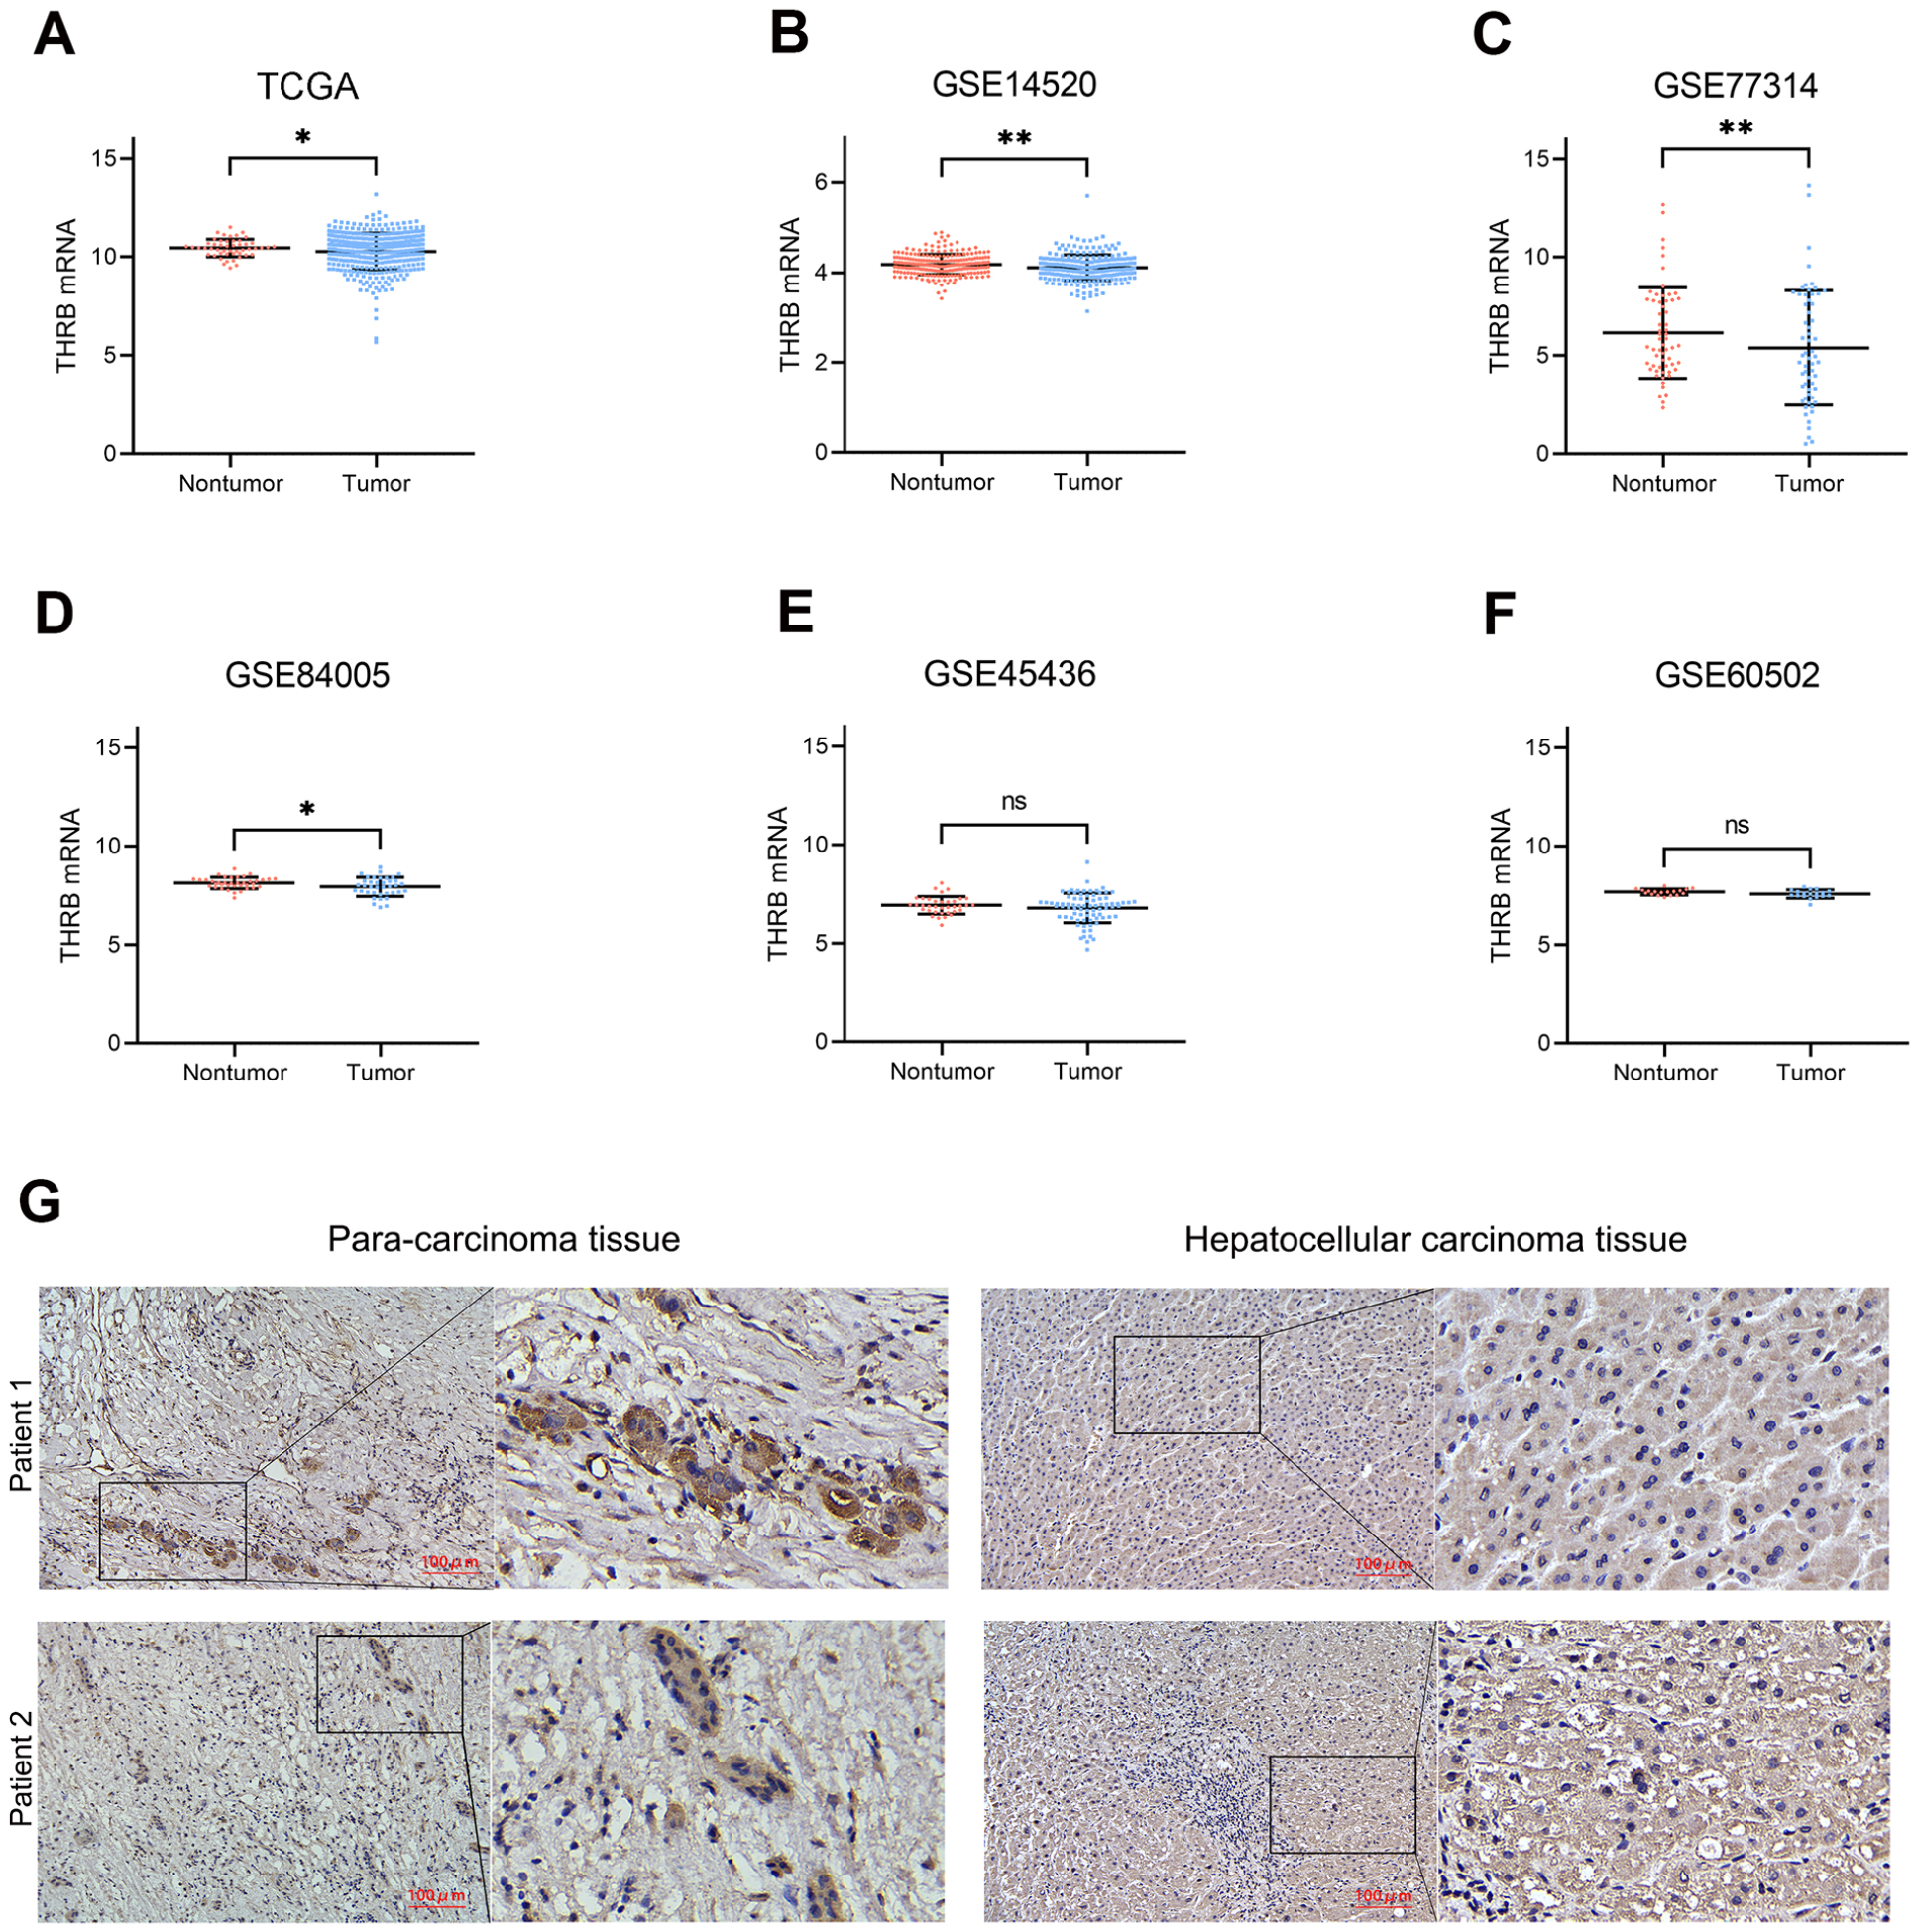
mRNA expression levels of THRB between tumor and non-tumor samples in HCC patients on the databases. TCGA (A), GSE 14520 (B), GSE 77314 (C), GSE 84005 (D), GSE 45436 (E) and GSE60502 (F). (G) Representative IHC of THRB in para-carcinoma tissue and hepatocellular carcinoma tissue. Student’s t-tests were performed. **P < .01, *P < .05, ns P > .05.
We next calculated the proportion of patients with downregulated THRB in paired samples across 4 GEO series. Using the previously obtained log2 expression data for THRB, the expression value of THRB in tumor tissues was subtracted from the expression value in paired normal tissues; a result less than zero indicates a decrease in expression level. As shown in Table 2, out of 339 HCC patients, 193 (56.93%) had downregulated THRB expression (log₂ fold-change < 0), 42 patients (12.39%) had a log₂ fold-change < −0.5, and 11 patients (3.24%) had a log₂ fold-change < −1.
The percentage of THRB down-regulated patients.

In parallel, we also analyzed THRA expression level. THRA expression in tumor samples was significantly increased in the TCGA, GSE77314, and GSE84005 datasets, while no significant increase was found in the GSE14520, GSE60502, and GSE45436 datasets (Supplementary Figure 6). A comparison of THRB and THRA revealed that THRB expression was significantly higher than THRA expression in tumor samples from the TCGA, GSE14520, GSE60502, and GSE45436 datasets, with no significant changes observed in the GSE77314 and GSE84005 datasets (Supplementary Figure 6).
In conclusion, THRB downregulation in HCC tissue is widely present in HCC patients. Therefore, THRB may be a promising target of HCC.
Single-cell RNA sequencing analysis
Next, single-cell RNA sequencing analysis was conducted to assess THRB levels in immune cells derived from tumor and normal tissues of HCC patients. The t-distributed stochastic neighbor embedding (t-SNE) plots showed that immature B cells, CD16- monocytes, NK cells, and T cells were the predominant immune cells in normal tissue (Figure 7A), while memory B cells, plasma cells, dendritic cells (DC), endothelial cells, macrophages, monocytes, NK cells, and T cells predominated in tumor tissue (Figure 7C). THRB expression is displayed in Figures 7B and 7D, with red and gray dots representing high and low levels of THRB expression, respectively. THRB levels were low in most cell types from both normal and tumor tissues; however, a significant accumulation of CD16+ monocytes were observed in tumor tissue (Figures 7D and E), and higher THRB expression in these cells was associated with poorer overall survival in HCC patients (Figure 7F).

THRB expression in immune single cells based on single-cell RNAseq analysis of GSE140228. The t-stochastic neighbor embedding (t-SNE) plots of normal tissue (A and B) and tumor tissue (C and D). The THRB expression level in different cells (B–E); red and grey colors denote the expression level of THRB high and low, respectively. Kaplan-Meier plot of HCC patients grouped by the different levels of CD16 (F).
Association between TRs and clinicopathological features in HCC patients
We next explored the correlation between TRs expression and clinical features. A significantly higher proportion of patients with neoplasm histologic grade 3-4 was observed in the THRB low-expression group compared to the THRB high-expression group (58.40% vs. 45.54%, P = .030; Table 3). However, no significant differences were found between THRB expression groups regarding age, gender, race, family history of cancer, alcohol consumption, hepatic virus infection, tumor stage, Child-Pugh classification, AFP levels, fibrosis, adjacent hepatic tissue inflammation, or vascular invasion (P > .05). The analysis results of THRA are listed in Supplementary Table 3, the THRA expression was significantly associated with race, hepatitis virus infection status and AFP level (P < .05).
Characteristics of HCC patients between THRB high and low groups.

Significant P values have been bolded.
PPI and KEGG/GO biological process enrichment
By using the gene co-expression analysis method, we further explored the THRB-related cellular functions in HCC. The results of the protein-protein interaction (PPI) analysis are shown in Figure 8A. Eight hub genes, including PIK3R1, KAT2B, NRIP1, EP300, CREBBP, MED13, NCOA2, and JMJD1C, were found to interact with THRB.

PPI and KEGG/GO biological process enrichment. Protein-protein interaction of THRB using String analysis (A); KEGG and GO biological process enrichment of its interactive genes (B-E).
KEGG pathway enrichment analysis of THRB-interacting genes revealed significant enrichment in pathways related to the peroxisome, valine, leucine, and isoleucine degradation, beta-alanine metabolism, and protein processing in the endoplasmic reticulum (Figure 8B). Additionally, GO analysis indicated that THRB-related genes were significantly enriched in the small molecule catabolic process, proteasomal protein catabolic process, organic acid catabolic process, and fatty acid catabolic process. At the biological process (BP) level, THRB-related genes were enriched in the mitochondrial matrix, cell leading edge, endosome membrane, and peroxisome, while at the cellular component (CC) level, they were enriched in coenzyme binding, transcription coactivator activity, and ubiquitin-like protein binding at the molecular function (MF) level (Figures 8C–E).).
The correlation between THRB and tumor immune infiltrating cells and immunomodulators
The potential correlation between THRB expression and tumor-infiltrating immune cells (B cells, CD4+ T cells, CD8+ T cells, neutrophils, macrophages, and dendritic cells) was assessed using TCGA data. Macrophages exhibited the strongest correlation with THRB, underscoring the critical role of THRB in macrophage-associated tumor-infiltrating immune cells (Figure 9A). This finding also validated the single-cell RNA sequencing analysis, which indicated that monocytes and monocyte-derived macrophages express THRB.

The correlation between THRB and tumor immune infiltrating cells. (A) The correlation of THRB and tumor-infiltrating immune cells via Tumor Immune Estimation Resource (TIMER) (https://cistrome.shinyapps.io/timer/). The correlation between THRB and immunomodulators (B) (https://rookieutopia.com/app_direct/BEST/#PageHomeAnalysisModuleSelection).
We then analyzed the relationship between THRB expression and immunomodulator levels. The results showed that high THRB expression was significantly associated with increased expression of IL6R, KDR, CCL16, NT5E, CCL15, and ADORA2A (Figure 9B), suggesting that low THRB expression reduces these immunomodulators in HCC patients.
The correlation between THRB and antitumor drug sensitivity
To assess the potential role of THRB inclinical decision making, we analyzed the correlation between THRB expression and antitumor drug sensitivity using the GDSC and TCGA-LIHC databases. Nine candidate agents were identified as significantly correlated with THRB expression, with an absolute correlation coefficient (|Cor|) greater than 0.3. The IC50 values of all 9 agents were negatively correlated with THRB expression levels, indicating that low THRB expression was associated with resistance to these agents (Figure 10).

The correlation between THRB and antitumor drug sensitivity. Candidate agents significantly related to THRB expression with an absolute value of Cor >0.3 were obtained.
Discussion
Recent evidence suggests that thyroid hormone receptors (TRs) are involved in the development of systemic cancers. Mutations and gene fusions in TRs can lead to thyroid, kidney, breast, gastric, colon, and liver cancers.8 -14 While the prognostic significance of TRs has been established in lung and breast cancers,15,16 their role in HCC remains uncertain and controversial. Kowalik et al. suggested that TRs function as tumor suppressors by inhibiting HCC cell proliferation,17,18 whereas Chi et al. proposed a link between TRs and tumor progression. 19
In this study, we found that THRB downregulation is a risk factor associated with reduced survival rates in HCC patients. In contrast, there was no significant correlation between THRA and patient outcomes. We then specifically investigated the role of THRB at the cellular level, experiments involving wound closure, Transwell migration, and CCK-8 assays demonstrated that THRB can suppress HCC cell proliferation. These findings align with prior research showing THRB’s tumor-suppressive role in HCC cells. Chen et al. reported that TRs act as suppressors by downregulating oncogenes such as PTTG1 and Sp1. 25 Liao et al. found that TRs activate tumor suppressor genes like DKK4, a secretory protein that antagonizes the Wnt signaling pathway. 17 Other studies have linked TRs to pathways that inhibit cell proliferation.26,27 However, Chi et al. presented contrasting results, showing that T3/TR upregulates TRAIL, promoting metastasis in HCC cells. 18 This discrepancy may stem from the specific action of TRAIL, which can trigger non-apoptotic signals and promote tumorigenesis in apoptosis-resistant cancers. 28 The precise roles of TRs and TR-regulated genes in HCC warrant further investigation.
In addition to characterizing THRB’s role in HCC, we also conducted an exploratory analysis examining the association between THRB and clinical characteristics of HCC patients. Chi-square test results indicated a significant correlation between reduced THRB expression and high neoplasm histologic grade in HCC patients. However, no significant associations were found between THRB expression and factors such as family history of cancer, hepatitis virus infection, or alcohol consumption. These findings suggest that low THRB expression is linked to HCC independently of other major risk factors, corroborating our Cox regression analysis and supporting previous studies on the association between hypothyroidism and hepatocellular carcinoma. 29 We hypothesize that reduced THRB expression may contribute to the dedifferentiation of HCC cells, which requires further exploration.
A similar exploratory analysis on THRA was also performed, it resulted that there was a significant correlation between THRA with race, hepatitis virus infection status and AFP level in HCC patients. Currently, research specifically on the THRA is scarce. Mohamed et al. reported that THRA was overexpressed in squamous cell lung cancer and acting as a tumor promotor and associated with poor prognosis. 15 Similarly, THRA also plays a pro-oncogenic role in colon cancer. 30 Both studies suggested that THRA plays a role in certain cancers. We hypothesized that THRA might play a special role in HCC, and HCC with hepatitis virus infection or AFP elevation may help identify the possible functions.
Single-cell RNA sequencing was employed to analyze gene expression at the individual cell level. Our exploratory analysis revealed that THRB was overexpressed in CD16+ monocytes in tumor tissue, with elevated CD16 expression linked to poorer OS in HCC patients. Studies have demonstrated that CD16+ monocytes play a key role in pro-inflammatory processes, with CD16 expression significantly increasing during infections and inflammation. 31 There is a strong connection between monocytes and macrophages, as monocytes can be polarized by the tumor microenvironment and differentiate into macrophages.32,33 High CD16 expression in monocytes has been associated with M2 polarization, functioning as an immunosuppressor in chronic lymphocytic leukemia. 34 We propose that CD16+ monocytes may also act as immunosuppressors in HCC.
Emerging evidence indicates that tumor-associated macrophages (TAMs) are particularly abundant among the immune cells recruited to the tumor microenvironment (TME) and are present at all stages of liver cancer. 35 Targeting TAMs has become one of the most favored strategies in immunotherapy. Researchers have reported that IL-1β, tumor-derived adenosine, and SIRT5, among others, are involved in the interactions between TAMs and hepatic cancer cells, as well as in their phenotypic switching.36 -38 Furthermore, macrophage metabolism, including glucose, lipid, and amino acid metabolism, also regulates liver cancer progression.35,39 Our immune infiltration analysis revealed that macrophages are the predominant tumor-infiltrating immune cell type associated with THRB. Given that THRB is an important metabolic-related gene, we hypothesized that it may also play a role in the interactions between TAMs and hepatic cancer cells, as well as in metabolic processes.
Our exploratory analysis also uncovered a strong positive correlation between THRB and genes such as PIK3R1, EP300, KAT2B, NRIP1, CREBBP, MED13, NCOA2, and JMJD1C. Multiple studies have highlighted the importance of these genes in various cancers.40 -47 THRB may be intricately involved with these pathways during the development and progression of HCC tumors, and further validation is necessary.
Despite the valuable insights gained from this study, several limitations exist. First, the analysis primarily focused on transcriptional-level data, leaving uncertainty about their applicability at the protein level. Second, fundamental studies examining the role of CD16+ monocytes and macrophages in HCC remain limited, necessitating further comprehensive investigations to elucidate the precise role of THRB in HCC.
In summary, this study not only elucidates the prognostic and predictive value of TRs but also explores the potential of targeting THRB in HCC therapy. Additionally, it provides novel insights into THRB-related genes, immune-infiltrating cells, immunomodulators, and resistance to antitumor drugs. Overall, reduced THRB expression, rather than THRA, correlates with unfavorable OS in HCC patients.
Conclusions
Several important conclusions can be drawn. (i) Low THRB expression in tumors significantly correlates with worse overall survival (OS) and disease-specific survival in HCC patients. Low THRB expression, but not THRA, emerges as an independent risk factor for HCC. (ii) Reduced THRB expression was observed in 56.93% of HCC patient tumors. (iii) Eight central genes, including PIK3R1, KAT2B, NRIP1, EP300, CREBBP, MED13, NCOA2, and JMJD1C, exhibited interactions with THRB in HCC. (iv) Macrophages were the predominant immune-infiltrating cells associated with THRB in tumors, and low THRB expression was linked to resistance to multiple antitumor drugs.
Supplemental Material
sj-docx-1-bmi-10.1177_11772719251315321 – Supplemental material for The Prognostic Significance of TRs in Hepatocellular Carcinoma: Insights from TCGA and GEO Databases
Supplemental material, sj-docx-1-bmi-10.1177_11772719251315321 for The Prognostic Significance of TRs in Hepatocellular Carcinoma: Insights from TCGA and GEO Databases by Hao Zhou, Weijie Wang, Ruopeng Liang, Rongtao Zhu, Jiahui Cao, Chenguang Sun and Yuling Sun in Biomarker Insights
Footnotes
Acknowledgements
Declaration
Supplemental material
Supplemental material for this article is available online.
References
Supplementary Material
Please find the following supplemental material available below.
For Open Access articles published under a Creative Commons License, all supplemental material carries the same license as the article it is associated with.
For non-Open Access articles published, all supplemental material carries a non-exclusive license, and permission requests for re-use of supplemental material or any part of supplemental material shall be sent directly to the copyright owner as specified in the copyright notice associated with the article.