
Abstract
Background:
Latent TB infection (LTBI) affects one fourth of the global population. Currently, there is an absence of an optimal strategy for distinguishing between active tuberculosis (aTB) and LTBI. While some researchers have explored cytokines other than interferon-gamma (IFN-γ) as biomarkers, results have shown significant variability in their ability to differentiate between these conditions. This meta-analysis aims to evaluate the performance of activation phenotype and chemokine markers in distinguishing between aTB and LTBI.
Objectives:
To assess the diagnostic accuracy of specific biomarkers (HLA-DR+ IFNγ+, CD38+ IFNγ+, MCP-1, and RANTES) in differentiating aTB from LTBI.
Design:
This study was conducted in accordance with the PRISMA guidelines for systematic reviews and meta-analyses of diagnostic studies.
Data sources and methods:
We conducted a comprehensive search of PubMed, Scopus, Sciences Direct, and Web of Science for primary studies published in English up to 2023. Studies were included if they reported sensitivity, specificity, diagnostic odds ratio (DOR), and area under the curve (AUC) for the biomarkers in question. We calculated pooled diagnostic sensitivity, specificity, DOR, and AUC, and used the summary receiver operating characteristic curve (SROC) to summarize the diagnostic performance of each biomarker.
Results:
Sixteen studies involving 1696 participants were included in the analysis. Among them, 925 individuals were diagnosed with aTB, while 771 were classified as having LTBI. The specificity, sensitivity, DOR, and AUC for CD38+ IFNγ+, HLA-DR+ IFNγ+, RANTES, and MCP-1 were (0.97 [95% CI: 0.72-1.00], 0.90 [95% CI: 0.75-0.96], 291.863, and 0.9432), (0.90 [95% CI: 0.70-0.97], 0.83 [95% CI: 0.63-0.94], 41.819, and 0.8598), (0.68 [95% CI: 0.55-0.79], 0.72 [95% CI: 0.56-0.84], 5.733, and 0.7979), and (0.63 [95% CI: 0.54-0.72], 0.63 [95% CI: 0.50-0.75], 2.892, and 0.7290) respectively.
Conclusion:
The findings indicate that CD38+ IFNγ+ and HLA-DR+ IFNγ+ demonstrated the highest diagnostic accuracy. Additional prospective research is necessary to identify the optimal combination of biomarkers to enhance diagnostic accuracy in clinical settings.
Registration:
This review has been registered on PROSPERO: (CRD42023472091). Available from: https://www.crd.york.ac.uk/prospero/#recordDetails
Keywords
Introduction
Tuberculosis (TB) stands as one of the leading infectious diseases globally. In 2022, the World Health Organization’s (WHO) reported that the number of newly diagnosed TB cases was 7.5 million and an estimated 1.3 million deaths, marking the highest figure since the initiation of global TB monitoring by WHO in 1995. 1 This noteworthy increase underscores the persistent and urgent challenges associated with TB control and emphasizes the ongoing importance of global efforts to combat this infectious disease. Some people recently infected with Mycobacterium tuberculosis (Mtb) may not exhibit typical clinical symptoms but reside in a state known as latent tuberculosis infection (LTBI). 2 LTBI affects approximately 1-quarter of the global population. Identifying individuals with LTBI requires the use of immunological methods, as traditional diagnostic approaches may not effectively reveal their latent status. 3 Among all individuals with LTBI, 10% are at risk of developing active TB (aTB). 4 The advancement of diagnostic methods for TB, including both aTB and LTBI, marks a significant stride in combating this disease. While conventional methods rely on clinical symptoms, chest X-rays, and Mtb culture, their non-specificity poses challenges in distinguishing between aTB and LTBI. 5 At present, the interferon-gamma release assay (IGRA) and tuberculin skin test (TST) stand as are the most reliable immunodiagnostic techniques for both aTB and LTBI.6,7 Specifically, IGRA addresses a limitation of TST which has low specificity, particularly in individuals who have received Bacilli Calmette Guerin (BCG) vaccination. 8 However, both TST and IGRA lack precision in determining the stage of TB infection and in differentiating between aTB and LTBI.6,9 Therefore, there is an urgent need for an immunodiagnostic test capable of discriminating between aTB and LTBI, which would represent a significant leap forward in clinical care. The IGRA test functions by assessing the immune response of T cells in the bloodstream when they recognize particular antigens found in Mtb. Specifically, it detects the production of interferon-gamma IFN-γ, which is generated by memory T cells upon exposure to these antigens. 10 However, it is important to note that this cytokine IFN-γ, is not sufficient to differentiate between aTB from LTBI. 11 Various cytokines and chemokine’s play important roles in cellular immune responses to Mtb infection. Therefore, numerous studies included in meta-analyses have highlighted the potential diagnostic value of specific cytokines in distinguishing patients with aTB from those with LTBI. 12 The cytokines analyzed include IL-2, with a sensitivity of 0.87 and specificity of 0.61; IL-13, showing a sensitivity of 0.75 and specificity of 0.71; IL-10, which has a sensitivity of 0.68 and specificity of 0.74; TNF-α, with a sensitivity of 0.67 and specificity of 0.64; IL-5, exhibiting a sensitivity of 0.64 and specificity of 0.75; and IP-10, demonstrating a sensitivity of 0.77 and specificity of 0.73 13. 12
On the other hand, compared to individuals with LTBI, patients with aTB typically have higher proportions of Mtb-specific CD4+ T cells exhibiting an activated phenotype, characterized by markers like HLA-DR and CD38.10,11 The activation status of Mtb-specific CD4+ T cells serves as a reliable discriminator between aTB and LTBI, showing exceptional diagnostic accuracy with 100% specificity and 96% sensitivity. 13 There are few studies that focus on phenotype markers compared to cytokine. We are facing a pressing need to uncover a new biomarker capable of reliably distinguishing between aTB and LTBI. Few individual studies have examined the role of MCP-1 as a biomarker for LTBI. For instance, Luo et al. demonstrated that the sensitivity was 83.67% and the specificity was 86%. 14 In contrast, Estevez et al. reported a sensitivity of 82% and a specificity of 51%. 15 While some studies indicate that these biomarkers have effective discriminative abilities, others suggest that they do not exhibit excellent discriminative effects. Therefore, a general conclusion regarding the effectiveness of these biomarkers is warranted. The same applies to the RANTES markers. For phenotype markers, there are very limited studies, however, some individual studies found a specificity of 100% and a sensitivity of 78%, a specificity of 100% and a sensitivity 90% of HLA-DR+ IFNγ+, CD38+ IFNγ+ respectively. 16 To this date, there has not been any meta-analysis to explore the diagnostic accuracy of phenotype and chemokine markers with regards to LTBI. To address this critical gap, we conducted a systematic review and meta-analysis to synthesize the evidence on diagnostic accuracy (sensitivity, specificity, DOR, and AUC), of (1) phenotype markers (HLA-DR+ IFNγ+ and CD38+ IFNγ+) and (2) chemokine markers (MCP-1 and RANTES).
Methods
Protocols and registration
The protocol for this systematic review was registered in PROSPERO (CRD42023472091). This review is reporting following the guide lines of the Preferred Reporting Items for Systematic Reviews and Meta-Analyses statement (PRISMA 2021).
Search strategy and inclusion criteria
We searched 4 electronic databases: PubMed, Science direct, Scopus, and Web of science, for publications in English. We ensured that our search included all relevant articles published up to 2024.The search strategy combined key terms for “tuberculosis” AND “Biomarker” AND “Discrimination” AND “Sensitivity” AND “Specificity” separated by Boolean operators (see Table S1). We searched for primary studies (cross sectional, cohort, and case-control studies) reporting on the sensitivity, specificity or AUC of 2 phenotype markers (HLA-DR+ IFNγ+ and CD38+ IFNγ+ on T CD4+) and 2 chemokine markers (MCP-1 and RANTES). Only studies comparing diagnostic accuracy in LTBI and aTB patients were included. Included studies focus on both pulmonary and extrapulmonary tuberculosis, recognizing that both types can share similar immune activation mechanisms. We excluded the following study designs: The exclusion criteria were as follows: editorials, correspondence, narrative reviews, systematic reviews, case reports, and case series. Studies with no comparator or comparator groups other than aTB patients, and studies which did not use a reference test to confirm diagnosis were also excluded.
The following Medical Headings and/or text words were used as search terms: “Tuberculosis OR mycobacterium tuberculosis OR TB or tuberculoses OR mycobacterium tuberculosis Infection OR tuberculosis infection or active tuberculosis OR Latent Tuberculoses OR Latent Tuberculosis AND “Biomarker OR Cytokine OR Activation phenotype OR chemokine ccl2 OR chemokine ccl 2 OR chemokine ccl-2 OR ccl2 OR ccl-2 OR Monocyte Chemoattractant Protein-1 OR Monocyte Chemoattractant Protein1 OR Monocyte Chemoattractant Protein 1 OR mcp1 OR mcp1 or mcp-1 OR ccl5 OR ccl-5 OR ccl 5 OR ccl5 chemokine OR Chemokine (C-C motif) ligand 5 OR rantes OR regulated on activation normal T cell expressed and secreted OR HLA or CD38 OR CD38 AND “Discrimination OR Differentiating” AND “sensitivity OR specificity OR accuracy.” Additionally, we manually looked for the reference lists of the applicable articles and reviews to find other potentially eligible studies. The details of our search strategies are shown in the (Supplemental Table S1).
Procedure
Search results were imported into Zotero reference managers and duplicates were removed. Two reviewers (Chaimae kadi, Narjisse Ahmadi) independently performed title and abstract, and full-text screening. Any discrepancies were resolved by consensus or with input from third reviewers (Anass Houdou) where necessary.
Data extraction
A pre-defined data extraction form was developed by CK and validated by NA. The following data were extracted: general details (authors, year of publications, country), methods (Subjects aTB/LTBI, Method detection, HIV status, Stimulator with Mtb antigens, sensitivity, specificity, and Area under the Curve [AUC]) from the included articles, and the accuracy of decisions were independently verified by the Third author (A.H). For each study, 2 by 2 contingency tables were constructed, illustrating the rates of True Positives (TP), False Positives (FP), False Negatives (FN), and True Negatives (TN). Data were extracted for both intervention and comparator group. Where available, baseline characteristic were also extracted.
Quality assessment
We used the Quality Assessment of Diagnostic Accuracy Studies (QUADAS-2) framework to evaluate the quality and risk of bias in each included study. 17 The Quality Assessment of Diagnostic Accuracy Studies (QUADAS-2) is used to evaluate the quality of diagnostic studies and includes 4 items for risk of bias (i) patient selection, (ii) index test, (iii) reference standard, and (iv) flow and timing, and 3 items for applicability, (i) patient selection (Applicability domain), (ii) index test (Applicability domain), (iii) reference standard (Applicability domain). Quality appraisal was done by 2 independent authors (C.K and N.A): Studies with high risk of bias in any of the domains were judged as “high-risk.” Studies with low risk of bias for all of the domain were judged as low risk of bias. Studies were not excluded based on quality, but were used to inform the discussion and the results.
Statistical analysis
The Meta-Disc (version 2.0) software was used to pool the primary diagnostic data. 18 The main outcomes evaluated were the discriminating ability of activation phenotypes and chemokine’s markers for ATB from LTBI. The pooled sensitivity, specificity, and diagnostic odds ratio (DOR) were calculated. The summary receiver operating characteristic (SROC) curve was constructed for each marker in each study, together with 95% confidence intervals (CIs). Overall diagnostic performance of those markers was assessed as the area under the curve (AUC) using “R-package mada.” 19 An AUC below 0.75 signifies markers with discriminatory accuracy considered “not accurate,” while values ranging from 0.75 to 0.93 denote a “good” level of discriminatory accuracy, an AUC exceeding 0.93 indicates an “excellent” level of discriminatory precision. 20 Additionally, we conducted meta-regression analysis to find possible sources of heterogeneity, and the subgroups including detection method and stimulator with Mtb antigens. Heterogeneity was evaluated by I2. I2 < 50%/P > .1 justified using a fixed effect model; Conversely, I2 > 50%/P < .1 signaled significant inconsistency, necessitating the adoption of a bivariate random-effects model. The potential publication bias of the included studies was assessed using Deeks’s funnel plot 21 with the meta 7.0.0 package 22 in RStudio 23 with R version 4.3.1. 24
Results
Study selection
We identify 2486 studies from 5 databases (PubMed 1966, Scopus 217, Science Direct 97, Cochrane Library 67). After removing 567 duplicates, we screen the titles and abstracts, resulting in the exclusion of 1812 irrelevant articles. We further read the full text of 91 articles that do not meet the inclusion criteria. Finally, we include 16 articles in the systematic review and meta-analysis.13 -16,25 -36 (Figure 1).

PRISMA diagram flow for studies selection.
Characteristics of the studies
Our systematic review and meta-analysis encompass 16 studies investigating the discriminatory potential of chemokine production and activation phenotype markers in distinguishing between active tuberculosis aTB and latent tuberculosis infection LTBI. Specifically, 8 studies provide 16 independent datasets assessing MCP-1 (CCL2) levels; 5 studies represent 9 independent datasets examining RANTES (CCL5) (Table 1); 4 studies comprise 6 independent datasets investigating HLA-DR+ IFN-γ+ on CD4+ T cells; and 4 studies, detailed in Table 2, explore CD38+ IFNγ+ on CD4+ T cells. The publication span of these studies extends over 7 years, from 2015 to 2022. The total number of study subjects is 1696, comprising 925 aTB and 771 LTBI patients for this meta-analysis. The identification of aTB and LTBI in all studies relies on a combination of bacteriology, clinical and radiological evidence, interferon-gamma release assays (IGRAs), and/or tuberculin skin tests (TST, T-SPOT), collectively referred to as the “clinical diagnosis standard.” The chemokine detection methods involve the use of enzyme-linked immunosorbent assay (ELISA) and Luminex. Across the studies, chemokine production and phenotype activation markers are stimulated with various antigens. Three studies utilize Mtb-specific antigens, 5 studies employ ESAT-6/CFP-10, 1 study utilizes Rv2204c/Rv0753c, 2 studies use (ESAT-6/CFP-10 and TBB7.7), 2 studies involve PPD stimulation, and 1 study each utilizes Mtb-CW antigens and ESAT6-CFP10 peptide. Nine studies are performed in high TB incidence countries (Tables 1 and 2).
Summary of included studies on 2 chemokine.

Mtb-specific antigens combination of 3 antigens, including early secretory antigenic target-6 (ESAT-6), culture filtrate protein 10 (CFP-10), TB7.7, Rv2204c, Rv0753c mycobacterium tuberculosis gene.
Abbreviations: aTB, active tuberculosis; FP, false positive; FN, false negative; LTBI, latent tuberculosis infection; NA, not available; TP, true positive; TN, true negative.
Summary of included studies on 2 phenotype markers.

Mtb-specific antigens Combination of 3 antigens, including early secretory antigenic target-6 (ESAT-6), culture filtrate protein 10 (CFP-10), TB7.7.
Abbreviations: aTB, active tuberculosis; FN, false negative; FP, false positive; LTBI, latent tuberculosis infection; NA, not available; PPD, purified protein derivative; TN, true negative; TP, true positive.
Study quality
The figure as depicted in Figure 2 shows that the majority of studies exhibit a low risk of bias. However, there are instances of high risk of bias observed in specific domains, namely: Risk of Bias Domains and Applicability Concerns.

Quality assessment of the studies.
The diagnostic accuracy of chemokine markers in distinguishing aTB and LTBI
Two chemokines, MCP-1 and RANTES, are selected as indicators to calculate the accuracy and ability of their use as biomarkers to differentiate aTB and LTBI (Table 1). Forest plots of sensitivity and specificity for MCP-1 and RANTES in discriminating between aTB and LTBI are shown in Figure 3. MCP-1 has the lowest sensitivity (0.63, [95% CI: 0.50-0.75]), while RANTES has the highest sensitivity (0.72 [95% CI: 0.56-0.84]). For specificity, MCP-1 shows a specificity of 0.63 (95% CI: 0.54-0.72), while RANTES has a specificity of 0.68 (95% CI: 0.55-0.79)
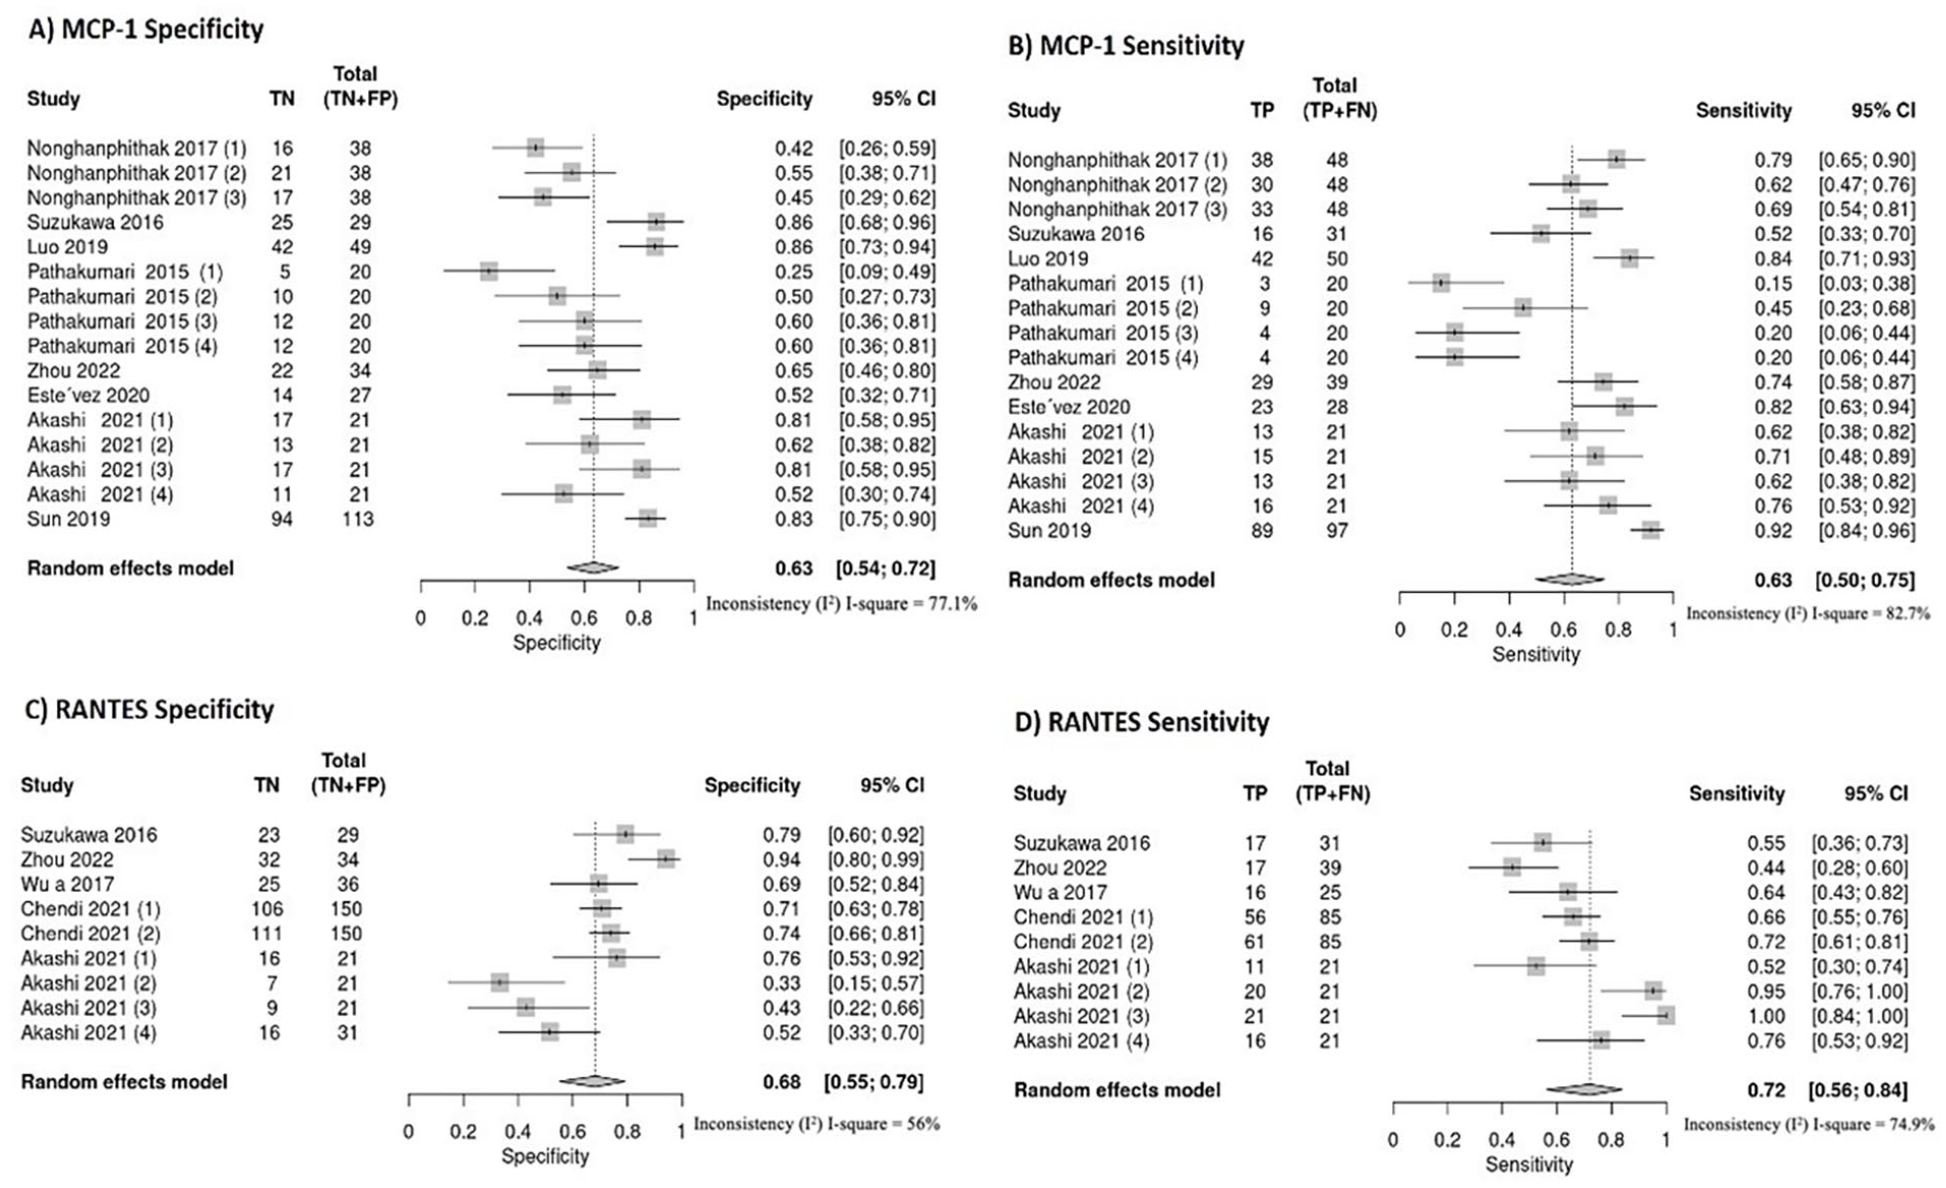
Forest plots illustrating specificity and sensitivity of MCP-1 and RANTES for discriminating between aTB and LTBI: (A) MCP-1 specificity, (B) MCP-1 sensitivity, (C) RANTES specificity, (D) RANTES sensitivity.
In the analysis of chemokines, the diagnostic accuracy measures are examined through a Summary Receiver Operating Characteristic (SROC) curve. The point of maximum polymerization on this curve signifies the optimal balance between sensitivity and specificity. The SROC curves for MCP-1 and RANTES are presented in Figure 4. The AUCs of MCP-1 and RANTES are 0.7290 and 0.7979, respectively (Table 3). These findings suggest that MCP-1 falls below the threshold for accuracy, while RANTES demonstrates good discriminatory potential.

Summary receiver operating characteristic curves of each biomarkers for discriminating between aTB and LTBI: (A) MCP-1, (B) RANTES, (C) HLA-DR+ IFN-γ+, (D) CD38+ IFN-γ+.
Pooled means of sensitivity and specificity, diagnostic odds ratio (DOR), area under the curve (AUC) for each marker.

The presence of potential heterogeneity among studies is examined using the I² statistic. The I² values, surpassing the 50% threshold for both sensitivity and specificity in relation to all biomarkers, suggest noteworthy heterogeneity across the various studies. Exploring potential contributing factors to this heterogeneity becomes imperative
The diagnostic accuracy of activation phenotype markers in distinguishing aTB and LTBI
Two activation phenotype markers, CD38+ IFNγ+ and HLA-DR+ IFNγ+, are chosen as indicators to calculate the accuracy and ability of their use as biosignatures to discriminate between aTB and LTBI (Table 2). The forest plots of sensitivity and specificity for CD38+ IFNγ+ and HLA-DR+ IFNγ+ in discriminating between aTB and LTBI are shown in Figure 5. CD38+ IFNγ+ has the highest specificity (0.97, [95% CI: 0.72-1.00]), and HLA-DR+ IFNγ+ has a specificity of 0.90 (95% CI: 0.70-0.97). For sensitivity, CD38+ IFN-γ+ shows a sensitivity of 0.90 (95% CI: 0.75-0.96), while HLA-DR IFN-γ+ has a sensitivity of 0.83 (95% CI: 0.63-0.94).

Forest plots illustrating specificity and sensitivity of HLA-DR+ IFNγ+ and CD38+ IFNγ+ for discriminating between active TB and LTBI: (A) HLA-DR+ IFNγ+ specificity, (B) HLA-DR+ IFNγ+ sensitivity, (C) CD38+ IFNγ+ specificity, (D) CD38+ IFNγ+ sensitivity.
In the analysis of activation phenotype markers, the diagnostic accuracy measures are examined through a Summary Receiver Operating Characteristic (SROC) curve. The SROC curves for CD38+ IFNγ+ and HLA-DR+ IFNγ+ are presented in Figure 4. The AUCs of CD38+ IFNγ+ and HLA-DR+ IFNγ+ are 0.9432 and 0.8598, respectively (Table 3). These results show the highest diagnostic accuracy.
Subgroup analysis
To explore the reasons for the variability in sensitivity and specificity shown in Figures 3 and 5, we conduct a subgroup analysis using Meta-DiSc 2.0 software. Among the included assessments, there are 16 and 9 distinct datasets for MCP-1 and RANTES detection, respectively. Concerning the phenotype markers, there are 4 datasets for CD38+ IFN-γ detection. Sufficient data are available for the conduct of subgroup analysis. The subgroup analysis is conducted for these 3 markers-two chemokines and 1 phenotype marker based on the factors of detection method and stimulation with Mtb antigens. As presented in Table 4, variations in sensitivity and specificity are apparent within each subgroup. Specifically, when categorized based on marker detection assays, Luminex demonstrates satisfactory accuracy in discriminating between aTB and LTBI, with RANTES sensitivity at 0.72 and specificity at 0.68, and MCP-1 sensitivity at 0.69 and specificity at 0.69.
Subgroup analysis of biomarkers to differentiating between aTB and LTBI.

However, ELISA assays demonstrate poor sensitivity 0.57 and specificity 0.59 for MCP-1. In terms of the stimulator of Mtb antigens, ESAT-6 and CFP10 show better accuracy in MCP-1 and CD38+ IFNγ+ detection for differentiating between aTB and LTBI, with sensitivities of 0.83 and 0.90 and specificities of 0.86 and 0.99, respectively, compared to PPD and Mtb-specific antigens.
Publication bias
Publication bias evaluation is assessed using Deek’s test, as shown in Table 5. MCP-1 exhibits an apparent publication bias (Deek’s test P = .0002), while the other markers do not show significant publication bias. The funnel plots are illustrated in the Supplemental Figures.
Statistical measure of publication bias for each marker.

Discussion
Profiling biomarkers, including biomarker panels, is imperative to enhance the diagnostic accuracy of tuberculosis TB and expedite the implementation of prompt and precise treatment. Despite this urgent requirement, limited research is conducted in this domain. In this study, we conduct a meta-analysis to evaluate the phenotype activation markers, notably HLA-DR+ IFNγ+ and CD38+ IFNγ+, as well as chemokine biomarkers such as MCP-1 and RANTES, for their discriminatory potential in distinguishing between active tuberculosis aTB and latent tuberculosis infection LTBI. We observe that CD38+ IFNγ+ and HLA-DR+ IFNγ+ have the highest diagnostic accuracy, with total AUC values of 0.94 and 0.85, respectively. MCP-1 and RANTES show moderate diagnostic accuracy, with total AUC values of 0.72 and 0.79, respectively. Our systematic analysis bolsters our confidence in distinguishing between aTB and LTBI. This involves a thorough assessment of the host immune response, with a specific focus on activation phenotype markers and chemokines. The integration of multiple biomarkers markedly enhances diagnostic capabilities within clinical practice.
Exploring the diagnostic potential of various cytokines to distinguish between aTB and LTBI has been a focus of previous studies, revealing promising insights. These investigations have demonstrated that certain cytokines exhibit a high overall accuracy in this discrimination such as IL-2, IFN-γ, VEGF, IP-10.12,20,26,37. Two prominent chemokine belonging to the CC chemokine family are monocyte chemo attractant protein 1 MCP-1 and RANTES. MCP-1 is known to induce the release of cytotoxic granules and recruit cells engaged in inflammatory processes.38,39 Conversely, RANTES is crucial for stimulating T cell proliferation and bolstering immunity against tuberculosis.15,29 Our data presents a nuanced perspective on the detection of MCP-1 and RANTES. In our study, the sensitivity for MCP-1 detection was found to be 0.63, with a specificity of 0.63. Similarly, for RANTES, the sensitivity and specificity were 0.72 and 0.68, respectively. Despite these values falling short of ideal, these results contribute valuable information to the ongoing dialog surrounding the diagnostic utility of MCP-1 and RANTES in the context of Mtb infection. AKASHI et al. found that RANTES exhibited a noteworthy overall accuracy, with an AUC of 0.72. However, they observed that combining RANTES with IL-2 resulted in an even higher overall accuracy, reaching an AUC of 0.80. 29 This underscores the potential synergistic effects of utilizing multiple biomarkers in tuberculosis diagnosis. Further exploration and refinement of detection methods may enhance the clinical applicability of these chemokine in tuberculosis diagnostics.
The cellular immune response mediated by T lymphocytes plays a pivotal role in tuberculosis infection and pathogenesis. 40 Previous studies have suggested a potential correlation between the activation of Mycobacterium tuberculosis Mtb-specific T-cells and the antigen load of Mtb. Both CD38 and HLA-DR are considered early immune markers indicative of T-cell activation in response to microbial infection or vaccination. 13 CD38+ is a transmembrane glycoprotein present on various immune cell types, playing a critical role in cellular function. It is capable of facilitating the degradation of nicotinamide adenine dinucleotide NAD and its precursor molecules, which are essential for bacterial proliferation.32,33 Research suggests that CD38 actively suppresses pathogen metabolism within activated immune cells by degrading NAD and its precursors, thus impeding the progression or exacerbation of infections. 41 Recent studies have highlighted a predominance of CD38+ expression in aTB cases compared to LTBI, indicating their potential utility as discriminative markers between the 2 conditions.13,16,35,36 Our analysis revealed that CD38+ IFNγ+ exhibited a sensitivity of 0.90 and a specificity of 0.97. Regarding HLA-DR, it is an MHC class II cell-surface receptor involved in antigen presentation, predominantly expressed on activated antigen-specific T cells. 42 We observed that HLA-DR+ IFNγ+ displayed a sensitivity of 0.83 and a specificity of 0.90.
The I² test conducted on the pooled sensitivity and specificity revealed significant heterogeneity in our data analysis of the studies. To address this issue, we performed stratified (subgroup) analyses focusing on 2 cytokines MCP-1, RANTES and 1 phenotype marker CD38+ IFNγ+ based on the detection assay used, along with the simulator containing Mtb antigens. We observed variations in the accuracy of detection assays across different cytokine measurements. Specifically, Luminex performed well for RANTES and MCP-1, whereas ELISA was not preferred for these 2 cytokines (Table 4). The findings underscored the pivotal role of the detection method in determining the diagnostic efficacy of various biomarkers. The Mtb-antigens were used as stimulators for cytokine detection. In our subgroup analysis, our data supported that ESAT-6, CFP10 antigen is better in chemokine MCP-1 and phenotype markers compared to other Mtb-specific antigens, ESAT-6, CFP10, and TB7.7 and PPD. Additional variables, including pre-existing TB conditions, technician proficiency, and ethnic diversity, may contribute to the observed heterogeneity. When interpreting the results, it is important to acknowledge several limitations. Firstly, the available studies on activation markers are limited in literature. Secondly, variations in the reference standards and methods used for cytokine determination could introduce bias into our findings. Thirdly, the subgroup analysis of CD38+ IFNγ+ and HLA-DR+ IFNγ+ was restricted by the scarcity of original data, which may have restricted the depth of our examination in these areas. While acknowledging the aforementioned limitations, it is crucial to underscore the significance of the study’s results. They contribute valuable evidence regarding the potential utility of activation phenotype markers and chemokine in distinguishing between active tuberculosis aTB and latent tuberculosis infection LTBI.
Conclusion
In conclusion, our systematic review and meta-analysis identify several phenotypic markers, such as HLA-DR+ IFNγ+ and CD38+ IFNγ+, as well as specific chemokine responses to Mtb, including MCP-1 and RANTES, which help distinguish between individuals with aTB and LTBI. Importantly, CD38+ IFN-γ+ and HLA-DR+ IFNγ+ demonstrate the highest diagnostic accuracy. In contrast, RANTES and MCP-1 show moderate diagnostic accuracy. Due to their limited sensitivity and specificity, single chemokines may not provide sufficient diagnostic performance to be considered reliable biomarkers. Larger, prospective studies are needed to determine the optimal combinations of molecular responses before confirming their clinical utility as diagnostic markers for differentiating aTB from LTBI.
Abbreviations
LTBI Latent TB infection
aTB active tuberculosis
ESAT-6 Early secreted antigenic target 6
CFP-10 Culture filtrate protein 10
IFN-γ interferon-gamma
BCG Bacilli calmette guerin
TST Tuberculin skin test
Mtb Mycobacterium tuberculosis
HLA-DR Human Leukocyte Antigen—DR Isotype
MCP-1 Monocyte chemoattractant protein-1
RANTES Regulated upon activation, normal T-cell expressed and secreted
DOR Diagnostic odd ratio
AUC Area under the curve
SROC Summary receiver operating characteristic curve
Supplemental Material
sj-docx-1-bmi-10.1177_11772719241312776 – Supplemental material for Differentiating Latent Tuberculosis from Active Tuberculosis Through Activation Phenotypes and Chemokine Markers HLA-DR, CD38, MCP-1, and RANTES: A Systematic Review and Meta-Analysis
Supplemental material, sj-docx-1-bmi-10.1177_11772719241312776 for Differentiating Latent Tuberculosis from Active Tuberculosis Through Activation Phenotypes and Chemokine Markers HLA-DR, CD38, MCP-1, and RANTES: A Systematic Review and Meta-Analysis by Chaimae Kadi, Narjisse Ahmadi, Anass Houdou, Imad El Badisy, Oumnia Bouaddi, Zakaria Mennane, Nouhaila Najimi, Maryam Benlamari, Saber Boutayeb, Mohamed Khalis, Noureddine EL Mtili and Fouad Seghrouchni in Biomarker Insights
Footnotes
Declarations
Supplemental Material
Supplemental material for this article is available online.
References
Supplementary Material
Please find the following supplemental material available below.
For Open Access articles published under a Creative Commons License, all supplemental material carries the same license as the article it is associated with.
For non-Open Access articles published, all supplemental material carries a non-exclusive license, and permission requests for re-use of supplemental material or any part of supplemental material shall be sent directly to the copyright owner as specified in the copyright notice associated with the article.