
Abstract
Background:
Sensitivity to ionizing radiation differs between individuals, but there is a limited understanding of the biological mechanisms that account for these variations. One example of such mechanisms are the mutations in the ATM (mutated ataxia telangiectasia) gene, that cause the rare recessively inherited disease Ataxia telangiectasia (AT). Hallmark features include chromosomal instability and increased sensitivity to ionizing radiation (IR).
Objectives:
To deepen the molecular understanding of radiosensitivity and to identify potential new markers to predict it, human ATM-mutated and proficient cells were compared on a proteomic level.
Design:
In this study, we analyzed 3 cell lines from AT patients, with varying radiosensitivity, and 2 cell lines from healthy volunteers, 24 hours and 72 hours post-10 Gy irradiation
Methods:
We used label-free mass spectrometry to identify differences in signaling pathways after irradiation in normal and radiosensitive individuals. Cell viability was initially determined by water soluble tetrazolium (WST) assay and DNA damage response was analyzed with 53BP1 repair foci formation along with KRAB-associated protein 1 (KAP1) phosphorylation.
Results:
Proteomic analysis identified 4028 proteins, which were used in subsequent in silico pathway enrichment analysis to predict affected biological pathways post-IR. In AT cells, networks were heterogeneous at both time points with no common pathway identified. Mitotic cell cycle progress was the most prominent pathway altered after IR in cells from healthy donors. In particular, components of the chromosome passenger complex (INCENP and CDCA8) were significantly downregulated after 72 hours. This could also be verified at the mRNA level.
Conclusion:
Altogether, the most striking result was that proteins forming the chromosome passenger complex were downregulated after radiation exposure in healthy normosensitive control cells, but not in radiosensitive ATM-deficient cells. Thus, mitosis-associated proteins form an interesting compound to gain insights into the development and prediction of radiosensitivity.
Introduction
Sensitivity to ionizing radiation varies from person to person. The underlying biological mechanisms that contribute to these differences are incompletely understood. However, this knowledge is very valuable for the development of markers and bioassays to predict individual sensitivity, which in turn is essential for the development of personalized radiation protection strategies. To deepen the molecular understanding of differences in radiation response pathways in normal and radiosensitive individuals, we analyzed in this study human ATM-mutated and proficient cells on a proteomic level.
Mutations in the ATM gene cause the autosomal recessive inherited disorder Ataxia telangiectasia (AT). The disorder is accompanied by progressive ataxia and oculocutaneous telangiectasia starting in early childhood. The syndrome is multisystemic, thus also defined by immunodeficiency, sterility, neurodegeneration, increased cancer predisposition, and radiosensitivity.1 -4 The extreme radiosensitivity caused by the homozygous mutations of ATM, is characterized by fatal (tissue-) reactions following radiotherapy. The phenotype can be observed clinically by severe reactions of normal tissue leading in few cases even to mortality. In vitro cell lines derived from AT patients show decreased viability after irradiation and are widely used model systems for the investigation of mechanisms for radiation sensitivity.5,6 ATM is a member of the phosphatidylinositol-3′-kinase family (~350 kDa) which catalyzes the phosphorylation of hundreds of substrates thereby triggering a plethora of response reactions, such as DNA repair, cell cycle control, mitochondrial function, ROS metabolism and protein homeostasis. 7 ATM can be activated by DNA damage-dependent or ROS-dependent mechanisms and is best known for its role as a chief mobilizer of the cellular response to DNA double-strand breaks (DNA DSBs). In this process, ATM phosphorylates H2AX and KRAB-associated protein 1 (KAP1), which support 53BP1 foci formation to facilitate DNA double strand break repair. 8 Although the ATM cell lines are widely used model systems for the investigation of mechanisms for radiation sensitivity, ATM-related molecular mechanisms that contribute to radiosensitivity are still poorly understood.
Modern proteomics allows the simultaneous quantitative analysis of hundreds to thousands of proteins. It represents a promising global technology to discover new types of biomarkers and protein-protein interaction networks related to radiation-induced injury.9 -11 Proteomics has also been employed before to understand pathways altered by ATM mutation in lymphoblastoid cells (LCLs), 12 cerebrospinal fluid, 13 and in frontal brain cortex. 14 In this study we analyzed three LCLs derived from young AT patients and 2 LCLs from healthy donors 24 and 72 hours pre and post-ionizing radiation (IR) (10 Gy, X-Ray) using label-free mass spectrometry-based proteomics. We analyzed DNA damage response on the level of repair foci formation and KAP1 phosphorylation to identify proteins and signaling pathways that differ in AT patients compared to healthy individuals. The present study provides insights to identify mutual and individual signaling networks that govern the radiation response in normal and sensitive cells as a basis for future biomarker/assay development.
Materials and Methods
Cell lines and cultivation
Lymphoblastoid cell lines were maintained in RPMI 1640 (Cat Nr P04-18500, PAN-Biotech GmbH, Germany) supplemented with 10% (v/v) fetal calf serum (FCS) (Cat Nr P30-3306, PAN-Biotech GmbH, Germany) at 37°C in a humified atmosphere of 5% CO2. LCLs AT 240, AT 241 and AT 691 are EBV immortalized B-lymphocytes from young adults with a biallelic mutation in the ATM gene (Center for Child and Adolescent Health, HELIOS Hospital Krefeld (240 and 241) or in the Department of Pediatric Oncology, Hematology and Clinical Immunology, University Hospital Dusseldorf, Pediatric Clinic Dusseldorf (691)). Generation of LCLs of AT patients was described earlier. 15 Control LCLs (Co) were generated from B-lymphocytes of healthy volunteers and immortalization was performed at German Research Center for Environmental Health (GmbH), Research Unit Gene Vectors, Helmholtz Zentrum Munich (Table 1). Two well-established LCLs, GM03189 (ATM, Coriell) and LCL 2003716 from the LUCY study (LUng Cancer in the Young, http://www.genepi.med.uni-goettingen.de/lucy_en.html), were used as controls for radiosensitive and radioresistant cell lines (Table 1). Mycoplasma contamination was routinely controlled using a luminescence-based detection kit (Cat Nr LT07-418, MycoAlert, USA). To examine the effect of ATM loss, independent of the underlying genotype, Co 670 was treated with 3 µmol/l ATM inhibitor KU60019 (Cat Nr SML1416-SMG, Sigma Aldrich, Germany) 1 hour prior to irradiation. The ATM-inhibited cell line is referred to as AT 670i in the manuscript.
Overview of analyzed LCLs.

Abbreviations: f, female; m, male; ATM, ataxia telangiectasia mutated; EBV, Epstein-Barr virus; TUR, Turkey; MAR, Morocco; GER, Germany; HOM, homozygous mutation; HET, compound heterozygous mutation; n.a., not available.
Demographic data, ATM mutations, and EBV strain used for immortalization of whole blood B-lymphocytes.
Patient age at the time of blood sampling.
240 and 241 were siblings.
X-ray-irradiation
Before irradiation, viable cell counts were performed using trypan blue exclusion and LCLs were diluted in fresh media. Ionizing radiation was delivered at room temperature to exponentially growing cells at the indicated doses with the X-ray high-protection device RS225 (Serial number GS068, Xstrahl Limited, UK) under the following conditions: 195 kV, 10 mA, 0.5 mm Cu filter, sample distance from X-ray tube 500 FSD at a dose rate of 0.59 Gy/min. To avoid dose inhomogeneities, plates or flasks were solely irradiated in the center of the chamber. Sham-irradiated cell lines were treated like irradiated cells and kept at room temperature during the time of irradiation.
WST-1 assay
Cell viability was investigated by the WST-1 assay measured 24 hours post irradiation, according to the manufacturer’s instruction (Cat Nr 5015944001-8ML, Roche Diagnostics, Germany) on an Infinite M200 Spectrophotometer (Tecan GmbH, Germany). Percent cell viability was determined with respect to control as described earlier. 17 LCLs were cultured for 7 days in RPMI 1640 (PAN-Biotech GmbH, Germany). Prior to irradiation, cells were transferred to 96-microtiter plates (Cat Nr 655180, Greiner bio-one, Austria) with a concentration of 4 × 10⁴ cells/100 µL/well and irradiated at 10 Gy. Samples were tested in quadruplicates, and the experiment was repeated 3 times using biological replicates.
53BP1 and pKAP1 foci-assay
For foci assay, LCLs were sham irradiated and irradiated with 4 Gy in 15 ml conical tubes (Cat Nr 0030122151, Eppendorf AG, Germany) with a concentration of 1 × 10⁶ cells/ml in a volume of 500 µl medium. After irradiation, LCLs were incubated at 37 °C, 5 % CO2 for 1 and 24 hours. Then, 0,1 × 10⁶ cells were spun onto glass slides (5 minutes, 54 × g, RT) (Cat Nr 1206, Rotofix 32A, Andreas Hettich GmbH & Co.KG, Germany) and fixed with 2 % paraformaldehyde (PFA; Cat Nr P6148-500G, Sigma Aldrich Chemie GmbH, Germany) / PBS solution for 15 minutes at RT. After washing steps with 0.15 % Triton X-100 (Cat Nr T8787-100ML, Sigma Aldrich Chemie GmbH, Germany) / PBS 3 x for 5 minutes and 3 x for 10 minutes with blocking solution (1 % bovine serum albumin (BSA; Cat Nr A2153-100G, Sigma Aldrich Chemie GmbH, Germany)/0.15 % glycine (Cat Nr G8898-500G, Sigma Aldrich Chemie GmbH, Germany)/PBS) cells were fixed. Fixed cells were incubated with 75 µl primary antibody either anti-53BP1 rat mAb (Cat Nr BLD-933002, Clone W17184B, Lot: B295535, BioLegend, USA; 1:200 in blocking solution), or anti-pKAP-1 Ser824 rabbit mAB (Cat Nr A300-767A, BETHYL Laboratories, USA; 1:200 in blocking solution) for 2 hours in a humid stain chamber at RT followed by washing 5 minutes with PBS, 10 minutes with 0.15 % Triton X-100 / PBS, 5 minutes with PBS and 7 minutes with blocking solution. In a next step 75 μl diluted (1:1000) secondary antibody anti-rabbit IgG (H + L), F(ab’)2 fragment conjugated to Alexa Fluor 555 fluorescent dye (Cat Nr 4413S, Cell Signaling Technology Europe B.V., Germany, #4413) in blocking solution was added to the slides and incubated at RT for 45 minutes followed by washing 2 × 5 minutes with 0.15% Triton X-100 / PBS and 2 × 10 minutes in PBS. Prior to foci quantification, slides were mounted with 16 μl Vectashield mounting medium including 4′-6-diamidino-2-phenylindole (DAPI; Cat Nr H-1200-10, Vector Laboratories Inc, USA) for cell nuclei counterstaining.
Immunofluorescence microscopy
Immunofluorescence analysis and image acquisition were performed by automated microscopy using the Metafer Scanning System (MetaSystems Hard & Software GmbH, Germany). This is equipped with the Zeiss AxioImager.Z2 epifluorescence microscope (objectives: ECPlnN 40x/0.75 M27 and filters: DAPI, FITC/Spectrum Green, TRITC/Spectrum Orange, Texas Red, DEAC and Cy5) (Carl Zeiss AG, Germany), CCD CoolCube Camera 1 m (MetaSystems Hard & Software GmbH, Germany), Light source XCite Exacte light source (Excelitas, USA), and Metafer4 software (MetaSystems Hard & Software GmbH, Germany). Quantification of radiation-induced foci was conducted semi-automatically, using immunofluorescence microscopy, Metafer4 software (MetaSystems Hard & Software GmbH, Germany) and a custom-made evaluation algorithm (classifier). For foci analyses, z-stack images with ten focus planes and a plane distance of 0.35 μm were taken. The integration time was set to 0.12 second and the threshold for foci intensity was set to 40% with a maximum gain of 500%. For semiautomated quantification of total chromatin-associated protein pKAP1, total intensity was measured. For the evaluation of both pKAP1 intensity and 53BP1 foci, about 5000 to 10 000 cells per slide were analyzed.
Protein extraction and determination of protein concentration
For mass spectrometry analysis, LCLs were seeded in a concentration of 0.5 × 10⁶ cells/ ml in a total volume of 10 ml in culture flasks (75 cm2), irradiated with 0 Gy and 10 Gy and harvested after 24 and 72 hours, as described earlier. 18 The cells (5 × 10⁶) were lysed using RIPA (containing 25 mM Tris.HCl pH 7.6, 150 mM NaCl, 1% NP-40, 1% sodium deoxycholate, and 0.1% SDS) + 1x Halt™ Protease and Phosphatase Inhibitor Cocktail (Cat Nr 78442, Thermo Fisher Scientific, USA) at a volume of 8 µl lysis buffer/mg pellet. Samples were mixed and set on ice for 15 minutes followed by 5 minutes incubation at 95°C. To improve cell disruption, the samples were further processed at 4°C with the Bioruptor® Pico sonication device (Diagenode, Belgium) with 5 sonication cycles (30 seconds ON/30 seconds OFF) followed by centrifugation (10 minutes, 22 000g, 4°C). 19 The supernatant containing the protein lysate was transferred to a new LoBind tube (Cat Nr 30108116, Eppendorf, Germany). Protein concentration was determined in duplicate by RC DC kit as recommended by the manufacturer (Cat Nr 5000121, BioRad, USA) using BSA as a standard on an Infinite M200 Spectrophotometer (Tecan GmbH, Germany).
Proteomics analysis
Protein lysates (5 µg) were digested using a modified filter-aided sample preparation (FASP) protocol 20 as described before with the use of cut-off filters from Sartorius. 21
MS data were acquired on a Q-Exactive HF-X mass spectrometer (Thermo Scientific) coupled to a nano-RSLC (Ultimate 3000 RSLC; Dionex). 22
Proteome Discoverer (PD) 2.4 software (Thermo Fisher Scientific; version 2.4.1.15) was used for peptide and protein identification via a database search (Sequest HT search engine) against the Swiss-Prot human database (Release 2020_02, 20349 sequences in PD). Precursor mass and fragment mass tolerance were set to 10 ppm and 0.02 Da respectively, and a maximum of one tryptic miscleavage was allowed. Cys-carbamidomethylation was set as static modification and dynamic modifications were deamidation of Asn and Gln, oxidation of Met, and a combination of Met loss with acetylation on protein N-terminus. The validation of peptide spectrum matches and peptides was performed with Percolator by accepting only the top-scoring hit for each spectrum 23 Cutoff values were set at FDR < 1% and posterior error probability <.01 so that the final list of proteins conformed with the strict parsimony principle.
Proteins were quantified based on abundance values of 3 most abundant peptides and normalized to total peptide amount. Abundance ratios for proteins were calculated using a pairwise ratio approach; the boundary for fold-changes was set to 100-fold and 0.01-fold. The final protein ratio was calculated using the median abundance values of 4 replicates for each of the experimental groups. The statistical significance of the ratio change was ascertained by employing a background-based t-test approach, as described previously. 24 For final proteomics analyses refining criteria were the following: fold change (ratio of irradiated to sham-irradiated) ⩾ 1.50 or ⩽ 0.66, an FDR 1% and q-value ⩽ 0.05 (Benjamini–Hochberg) for proteins were identified by more than 1 unique peptide in at least 2 of 3 biological replicates.
Bioinformatics
Principal Component Analysis (PCA) was performed based on the raw data of “abundances (grouped)” in Supplemental SI. PCA is calculated in R using the prcomp function: https://www.rdocumentation.org/packages/stats/versions/3.6.2/topics/prcomp.
Analysis of protein-protein interactions and affected signaling pathways was performed separately for each cell line and time points (24 or 72 hours) after 10 Gy irradiation. The proteins were further analyzed using the STRING database (https://string-db.org/). 25 The biological processes associated with Gene Ontology (GO) terms were predicted by STRING analysis and ranked based on FDR.
RNA isolation and quantification
For RNA isolation, LCLs were cultured identical to mass spectrometry analysis but an additional time point of 48 hours was added. Frozen cell pellets (2 × 10⁶) were thawed on ice and RNA isolation was conducted using RNeasy® Mini Kit (Cat Nr 74106, Qiagen, Germany) according to manufacturer’s protocol. The elution step was repeated twice to increase RNA retrieval.
The isolated RNA was measured by the Eppendorf BioSpectrometer® kinetic device using the 1 mm Eppendorf μ Cuvette. As blank, nuclease-free water was used. Measurements were taken at 260 nm and the amount of protein contaminants was measured at 280 nm. To ensure RNA purity the A260/A280 ratio was observed between 1.8 and 2.1.
Reverse transcription polymerase chain reaction (RT PCR)
To convert the RNA into complementary DNA (cDNA) the GoScript™ Reverse Transcription System (Cat Nr A5001, Promega, Germany) was used according to the manufacturer’s protocol. For the synthesis of the first strand cDNA, 1 μg RNA / sample was used.
Quantitative PCR (qPCR)
For qPCR experiments, the iTaq™ Universal SYBR® Green Supermix (Cat Nr 1725120, BioRad, Germany) was used according to the manufacturer’s guidelines. Primers targeting AuroraB kinase (Cat Nr QT00D67403, Lot 46Z690427), CDCA8 (Cat Nr QT00086415, Lot 462690417) and INCENP (Cat Nr QT00026124, Lot 462690416) (Qiagen, Germany) were used. Relative gene expression patterns and irradiation-induced changes were calculated by using the comparative ΔΔCt quantification method. For normalization, GAPDH was used as a house-keeping gene. Three biological replicates were measured per treatment and the average fold-changes were used for data analysis.
Statistical analysis
For most experiments, p values were calculated in Microsoft Excel using a two-tailed Student t test which can be found in the individual figures and figure legends. Only the statistical significance of WST-1 was analyzed by z-test based on t-distribution. The P-values ⩽ .05 were considered significant.
Results
ATM-mutated LCLs show different sensitivities to ionizing radiation
To evaluate the role of ATM after ionizing radiation (IR) in cells, the WST1 assay was used to measure viability through mitochondrial enzymatic activity. Exponentially growing cells were irradiated and WST1 turnover was measured 24 hours after 10 Gy. We analyzed three healthy LCLs (Co 670, Co 687, and Co 688) and 7 LCLs from ATM patients (AT 692, AT 207, AT 226, AT 227, AT 240, AT 241, and AT 691). LCLs GM03189 (ATM-deficient) and 20037 (ATM-proficient) were used as controls for radiosensitive and radioresistant cell lines respectively. 16 All irradiated normal cells exhibited cell viability of approximately 75% to 60% compared to non-irradiated cells, consistent with control 20037. The AT cells presented variable responses. Four out of seven AT cells (AT 692, AT207, AT 226, and AT227) reacted similarly to the control cell line 20037. Two AT cells (AT 240 and AT 241) showed a significant decrease in viability after IR compared with controls. AT 691 showed no significant loss of viability, and the cell line even exhibited a more radioresistant phenotype than the healthy control line in 20037 (Figure 1). These observations showed that AT cells possess variable levels of IR-induced changes in metabolic activity, which may be due to individual ATM genotypes. For further mechanistic analysis, we focused on two control lines (Co 670 and Co 688) and those three AT lines with the most striking changes in viability after IR, AT 691 (resistant) and AT 240 and AT 241 (sensitive).
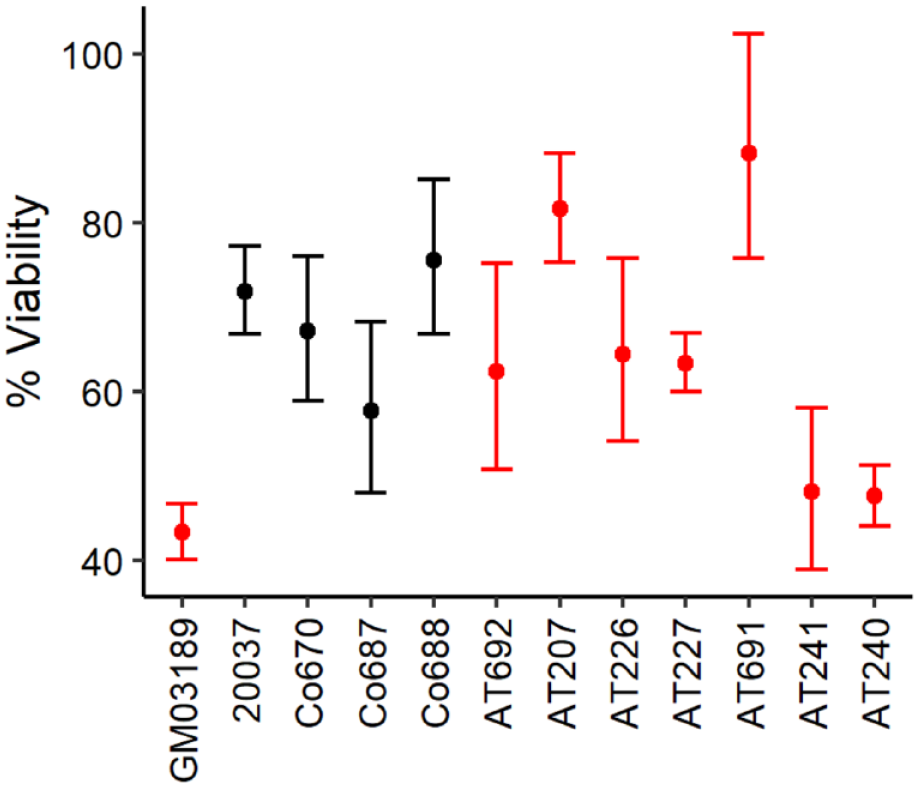
Analysis of cell viability using the WST-1 assay in control cells (black) and AT cells (red) 24 hours after exposure to 10 Gy. Cells were seeded in 96-well plates and irradiated with 10 Gy and WST 1 activity was measured after 24 hours at 450 nm, with 690 nm as reference. The WST 1 assay cannot distinguish between Co cells and AT cells 24 hours post IR with 10 Gy. Data represent mean values of triplicate independent samples. Statistical significance of WST-1 was analyzed by z-test based on t-distribution.
Radiation-induced KAP1 phosphorylation and 53BP1 foci repair differs between AT and CO cells
The effects of ATM mutations on DNA repair were addressed by evaluating pKAP1 expression and 53BP1 foci formation 1 and 24 hours after exposure to 4 Gy. To examine the effects of ATM loss independent of the underlying genotype, Co 670 treated with an ATM inhibitor (AT 670i) was included in the experiments. It was found that cells exhibited maximal phosphorylation of KAP1 1 hour after IR. In cells lacking functional ATM, KAP1 phosphorylation was significantly reduced after IR compared with normal cells. This effect is even more pronounced when an ATM inhibitor is added. The IR-induced pKAP1 expression pattern is able to consistently distinguish between cells with and without functional ATM (Figure 2A and C). Induction of 53BP1 foci 1 hour after 4 Gy showed no significant differences between AT and control LCLs. After 24 hours, the number of IR-induced 53BP1 foci was significantly reduced in control LCLs but did not change in AT cells. The repair capacity of the cells after irradiation of 4 Gy, determined at 24 hours, was reduced in AT cells compared with controls (Figure 2B and D).

pKAP1 and 53BP1 expression in LCLs exposed to 4 Gy. Representative images of pKAP1 1 hour after exposure to 4 Gy (A) and 53BP1 1 and 24 hours after 4 Gy irradiation (B). Dose-response relationship between the yields of pKAP1 and 53BP1 foci after 4 Gy in AT cells and controls: AT cells show a lower induction of pKAP1 expression (C), 53BP1 foci induction 1 hour after 4 Gy show no significant differences between AT cells and controls (D). After 24 hours, however, repair capacity is significantly reduced in AT cells compared to controls (n = 4 biological replicates). Statistical significance was calculated in Microsoft Excel using a two-tailed Student t test.
Radiation-induced proteomic responses differ significantly between AT and control cells
In an attempt to determine a comprehensive profile of radiation-induced protein changes in cells with and without mutation in the ATM gene, we used label-free proteomics carried out 24 and 72 hours after exposure to 10 Gy. The analysis resulted in the identification of a total of 5412 proteins (Supplemental SI). Principal component analysis (PCA) of the raw data set separates sham-irradiated and irradiated samples at both time points (Figure 3). A set of 4028 proteins (74.43%) was scored with at least 2 unique peptides (Table SI). Only deregulated proteins that met statistical thresholds (identified with more than one unique peptide in at least two of three biological replicates and a fold change ⩾1.50 or ⩽0.66 and a q-value ⩽ 0.05) were included in the final analysis (Supplemental Table SII).

Principal component analysis (PCA) representing proteomics data from the comparative analysis of control cells and AT cells. The PCA plot represents proteins with 3 biological replicates showing distinct proteomic profile differences between 10 Gy-irradiated and sham-irradiated cells and between 2 different time points (24 and 72 hours), as shown in matching symbols. The PCA score plot was generated for sham-irradiated samples after 24 hours (small circle) and 72 hours (large circle) and for 10 Gy-irradiated samples after 24 hours (small triangle) and 72 hours (large triangle). The colors indicate the ATM status with blue for controls and red for AT cells. The PCA was generated based on the grouped abundances of the raw data (Supplemental Table S1). PCA calculation was done in R using the function prcomp: https://www.rdocumentation.org/packages/stats/versions/3.6.2/topics/prcomp.
Firstly, we examined the proteomic control and AT groups separately at different time points (Figure 4A and B). The analysis shows that the radiation response in the AT group (AT 240, AT 241, and AT 691) is cell line specific, given that there are only 6 proteins (UBE2C, SELL, KIAA1671, MRPL23, UTP11, NCOA6) commonly deregulated 24 hours after IR. In contrast, there are more shared proteins (29 after 24 hours and 38 after 72 hours) detected among control groups (Figure 4A and B) suggesting a pronounced difference in the proteome between the AT and control groups.

Analysis of the significantly differentially expressed proteins 24 and 72 hours after 10 Gy. (A/B) Venn diagrams show the number of deregulated proteins 24 hours (A) and 72 hours (B) post 10 Gy in AT cells and control cells. (C/D) The Upset Plots illustrate the number of significantly deregulated proteins between all cell lines analyszed after 24 hours (C) and 72 hours (D). An Upset plot is built on three pieces. The bar chart shows the number of shared proteins in the data in different combinations of analyzed cells. Each bar represents a different combination. The graphical table underneath shows the corresponding combinations of cell lines. Each row is one of the six cells: Co 670, Co 688, AT 691 AT 240, AT 241 and AT 670i. The black dots and lines show the combination of cells that make up each subset of proteins. The blue bars indicate the shared proteins only present in both controls Co 670 and Co 688.
To identify the proteins exclusively deregulated post-IR in different profiles, the number of proteins uniquely deregulated within the AT group, control group, and subgroups is summarized in UpSet plots (Figure 4C and D). The UpSet plot analysis highlights the fact that the proteome response is more similar in healthy cell lines than AT cells, whereas AT lines react strongly on an individual basis. In the following, proteins that were significantly deregulated exclusively in 1 of the 2 groups were analyzed. Further analysis of shared proteins showed that UBE2C was the only protein downregulated in all cell lines 24 hours after 10 Gy IR, suggesting that it may be a marker of exposure to IR regardless of the AT status. After 24 hours, Probable U3 small nucleolar RNA-associated protein 11 (UTP11) is the only protein exclusively deregulated in the all 3 AT lines (downregulated in AT 240 and AT 241, upregulated in AT 691).
If AT 670i line is included, no mutual significantly deregulated protein is detected (Supplemental SIII). After 72 hours of IR-exposure, the AT lines have 6 commonly deregulated proteins with 3 proteins unique in AT 240, AT 241 and AT 691. RNA-binding protein 34 (RBM34) and Phosphatidylinositol 4,5-bisphosphate 3-kinase catalytic subunit delta isoform (PIK3CD), both upregulated in all AT cells and IQ motif and SEC7 domain-containing protein 1 (IQSEC1) which is downregulated in all AT cells (supplemental Table SIVa). If AT 670i is included, only PIK3CD is significantly deregulated in all AT lines (Supplemental Table SIVb).
Twenty-four h after 10 Gy irradiation, 15 out of 29 proteins are uniquely deregulated in the controls, whereas they are unaffected in the AT cells (Figure 4C and Table 2). At 72 hours, 20 proteins out of 38 were uniquely deregulated in controls cells and not in the AT cells (Figure 4D and Table 3).
Unique deregulated proteins in controls, 24 hours post 10 Gy IR.
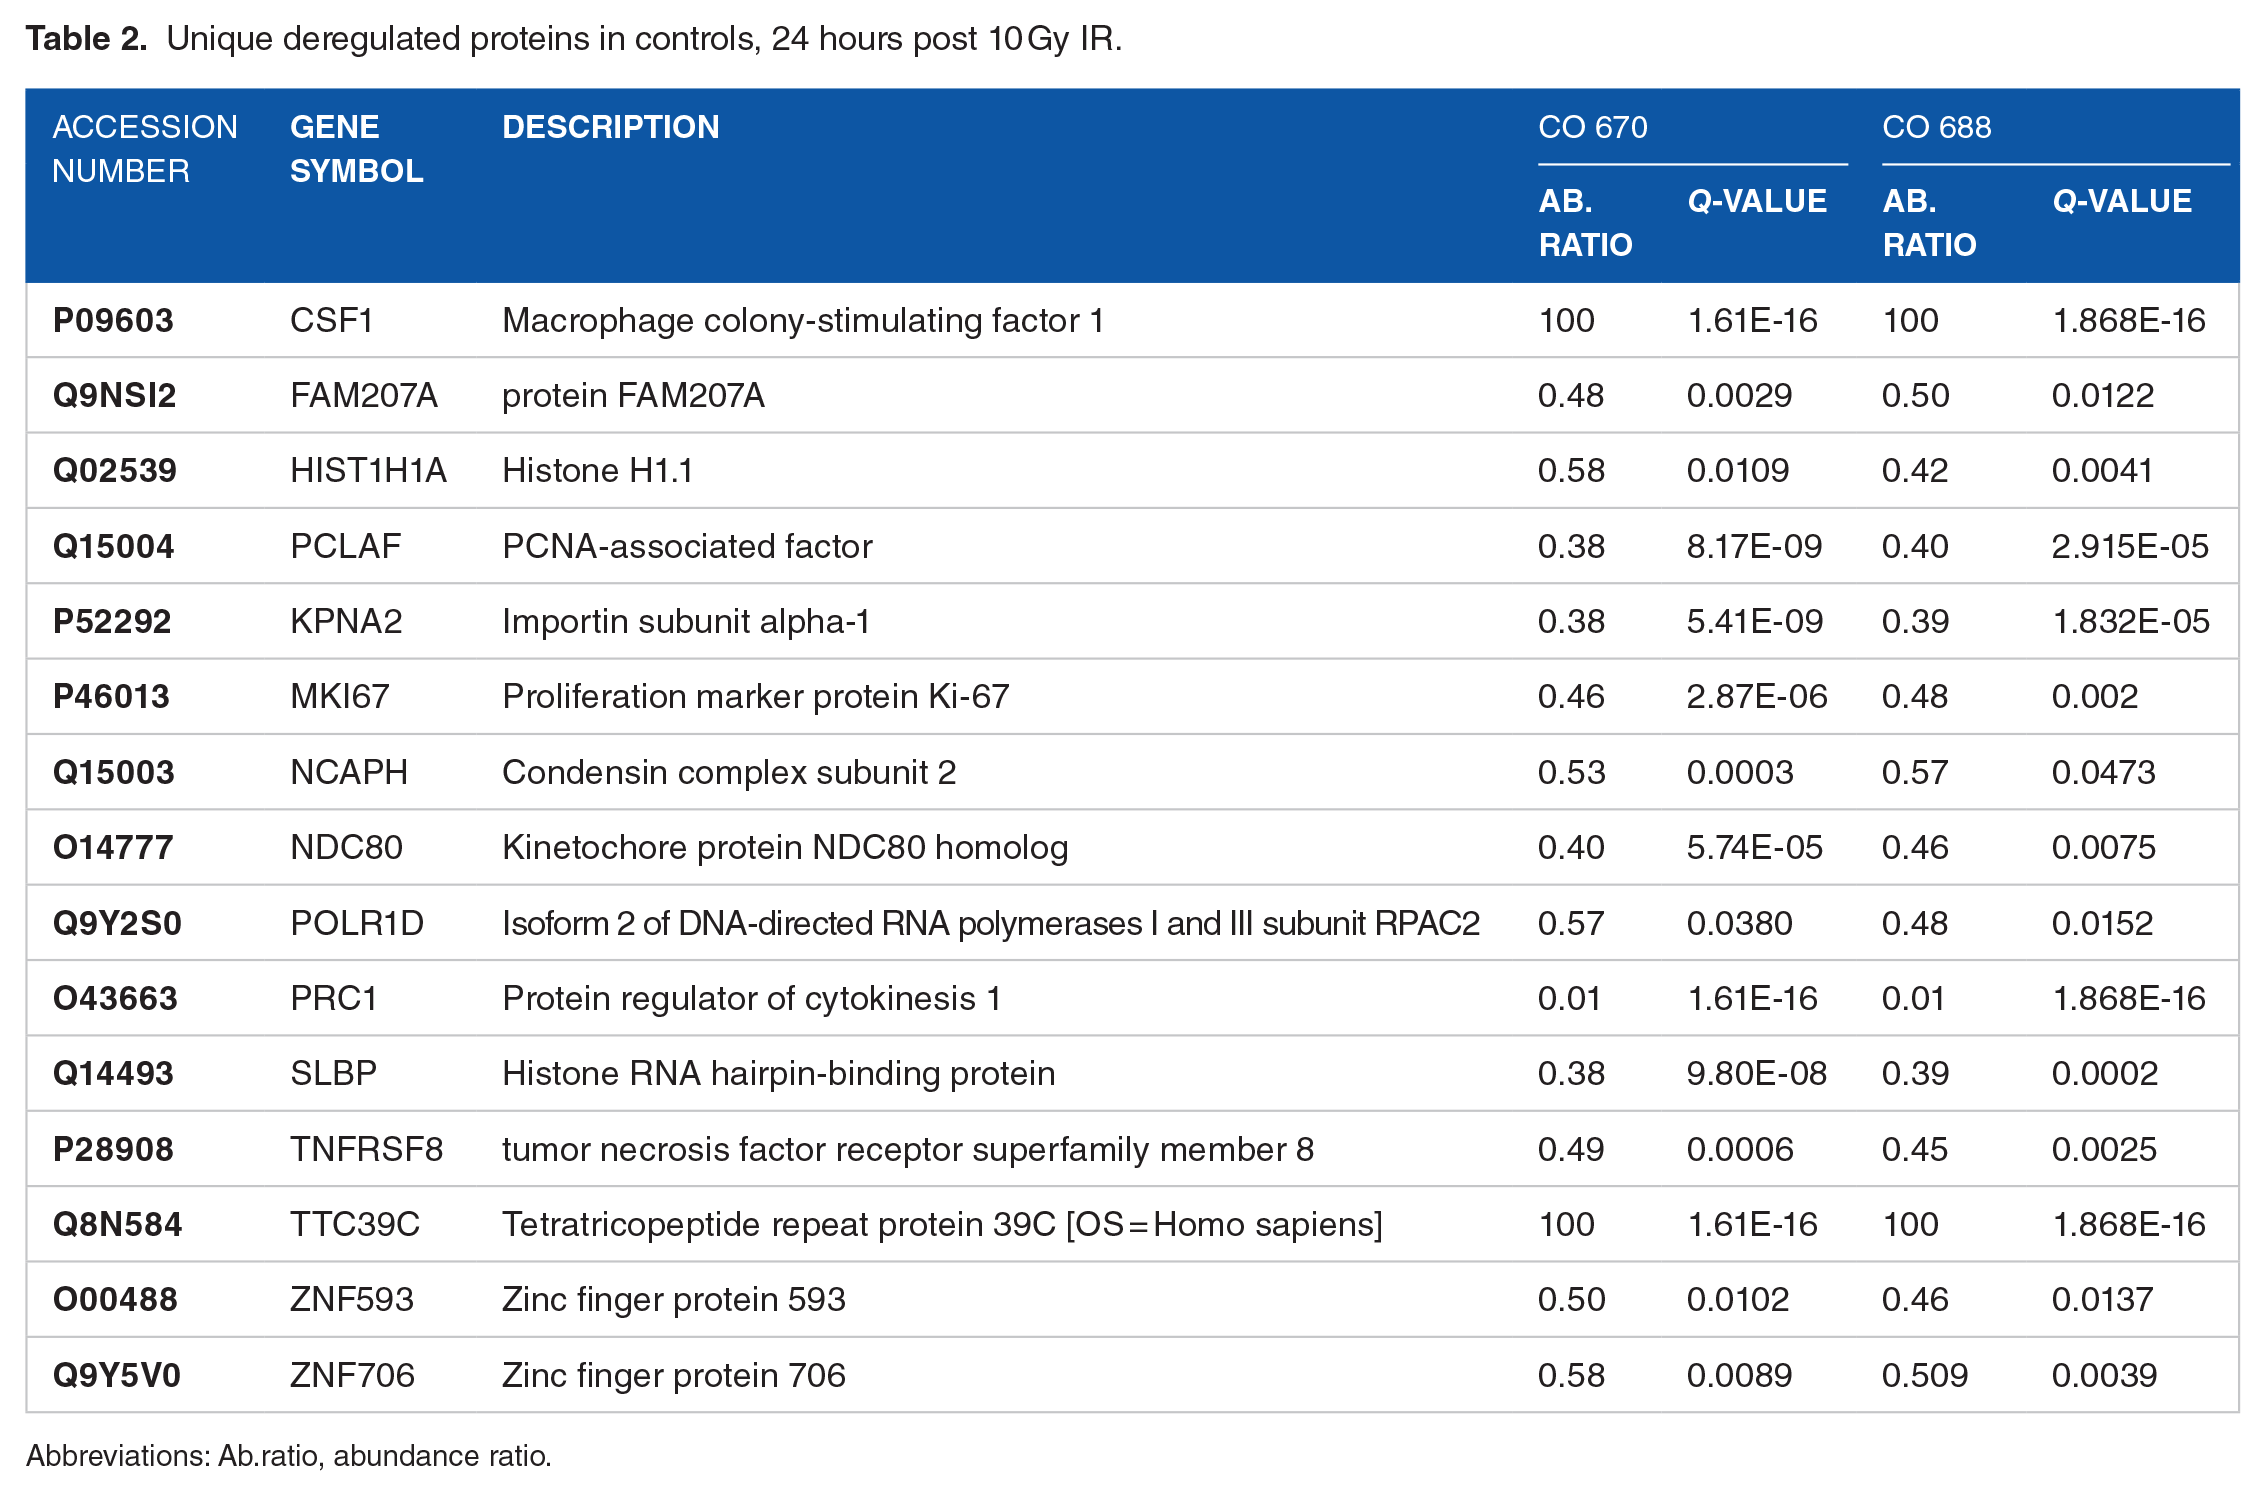
Abbreviations: Ab.ratio, abundance ratio.
Unique deregulated proteins in controls, 72 hours post 10 Gy IR.
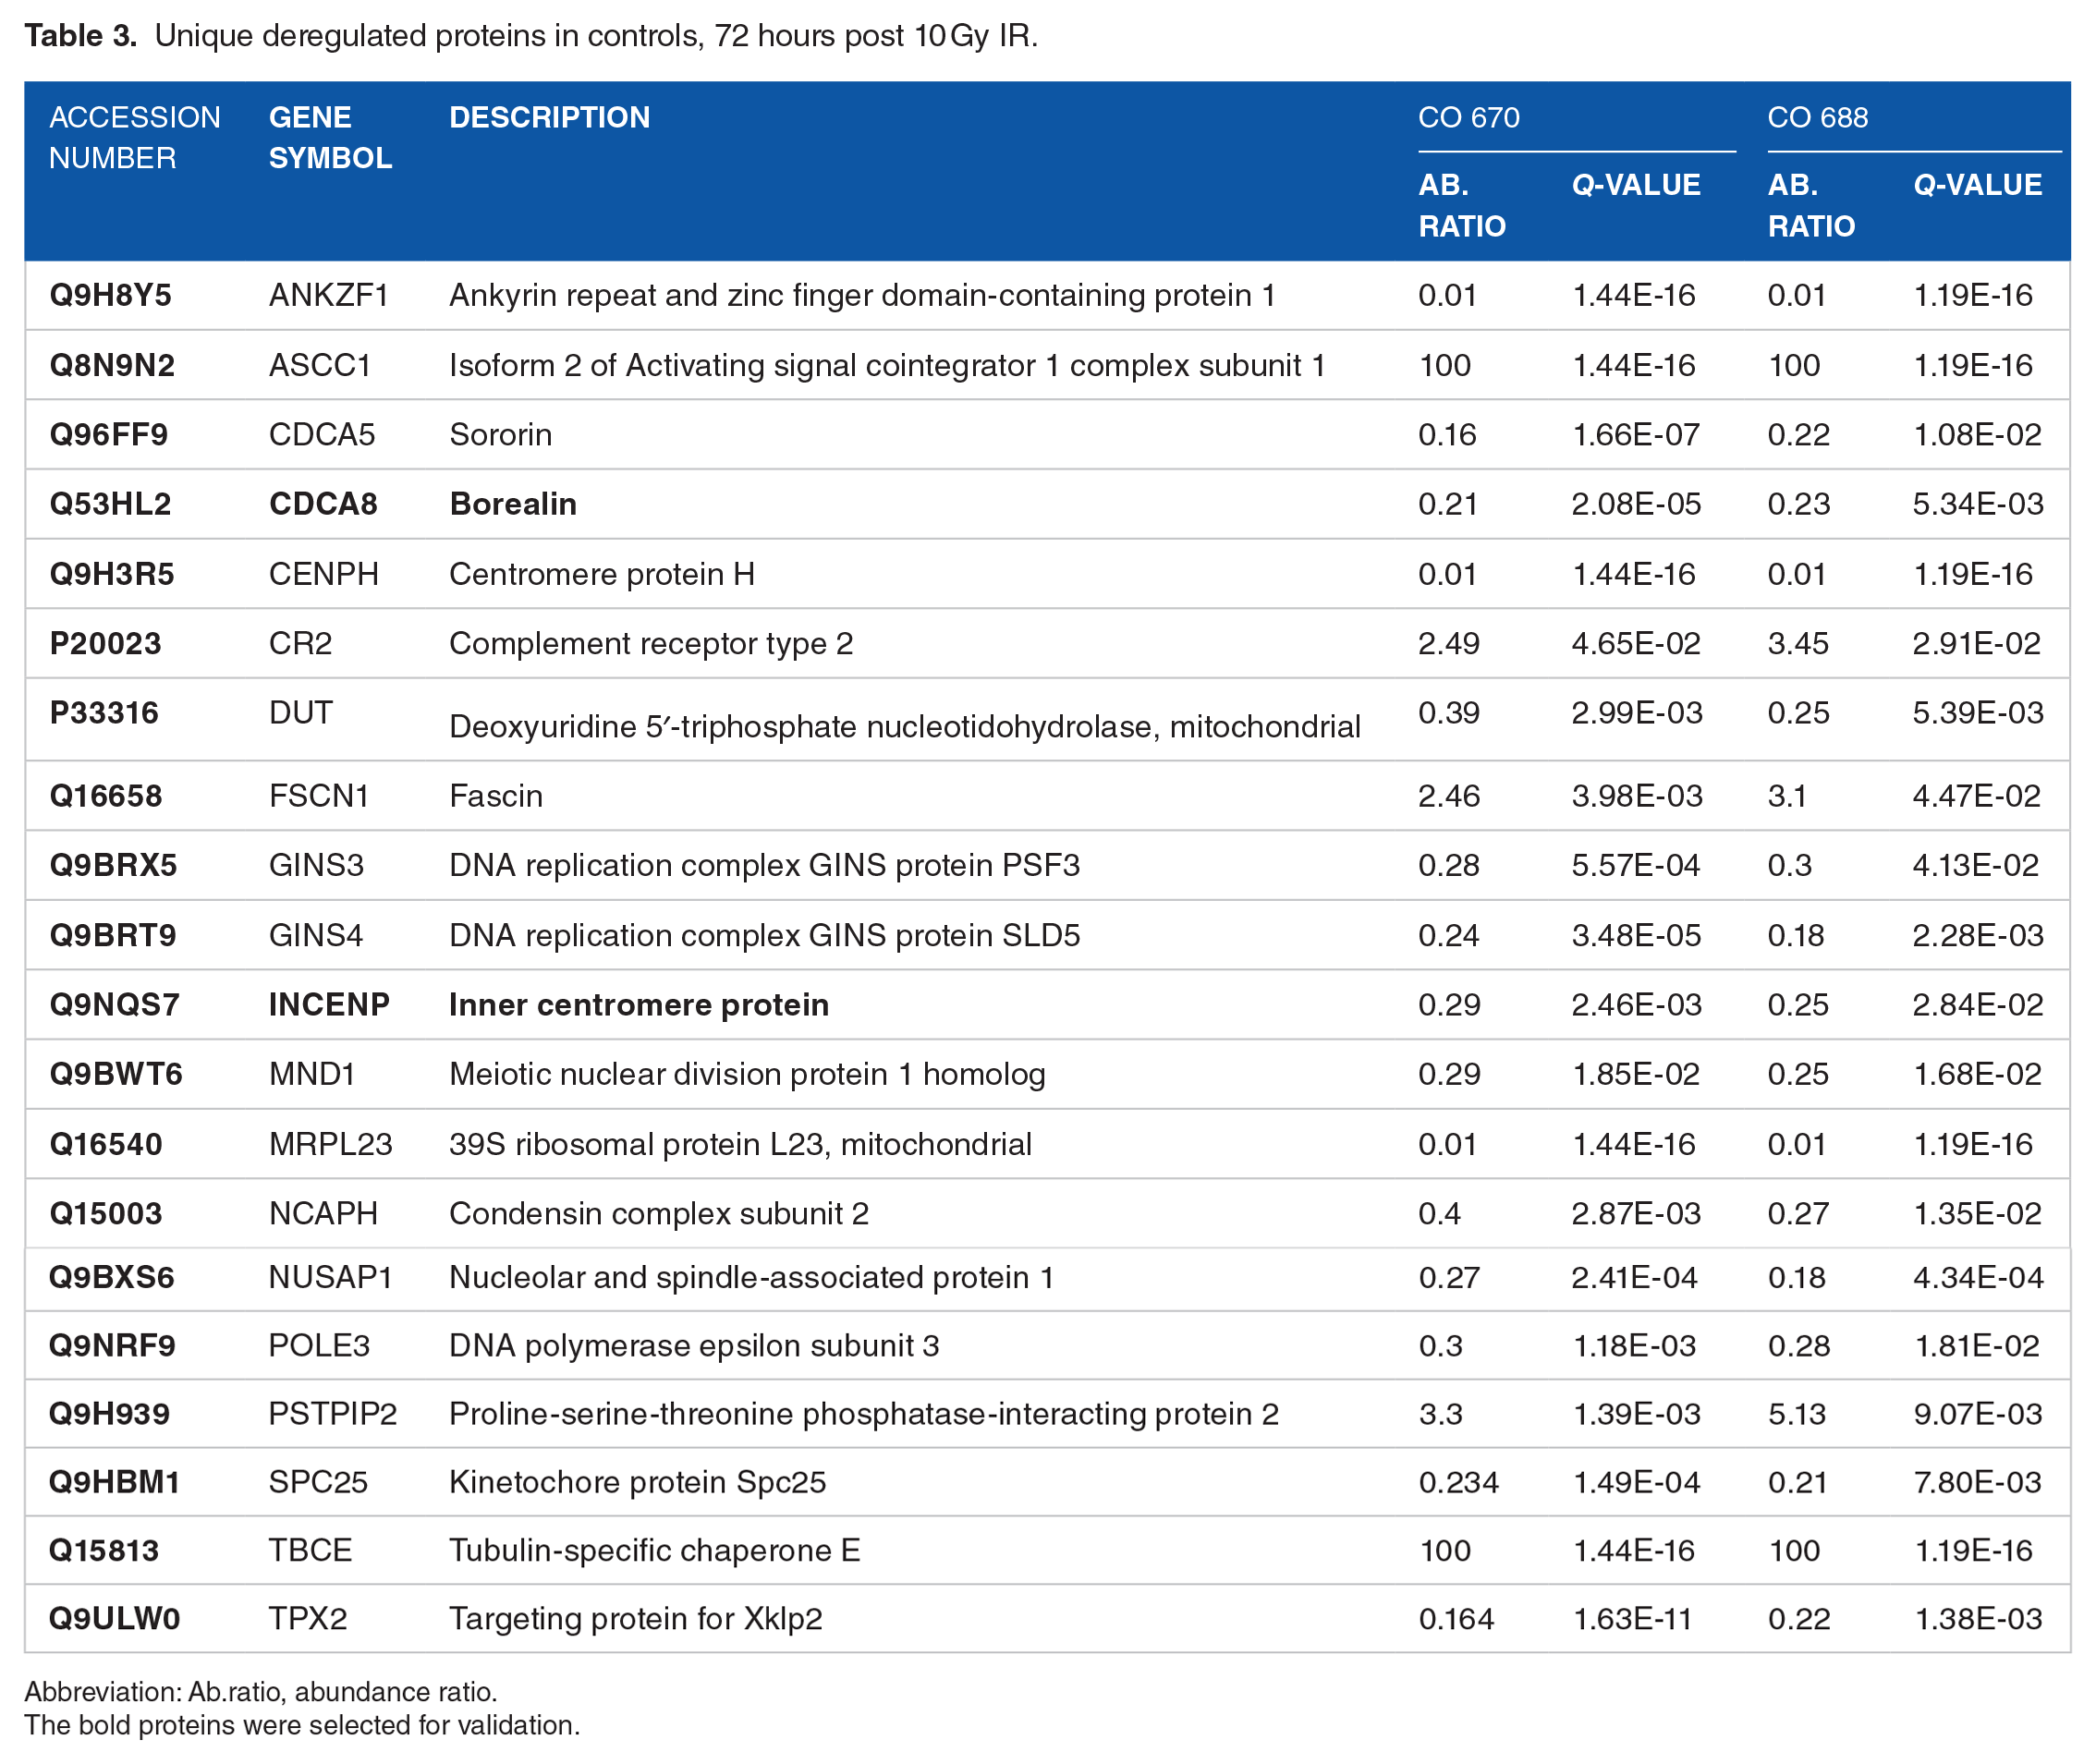
Abbreviation: Ab.ratio, abundance ratio.
The bold proteins were selected for validation.
Mitosis-associated proteins are predominantly affected in controls
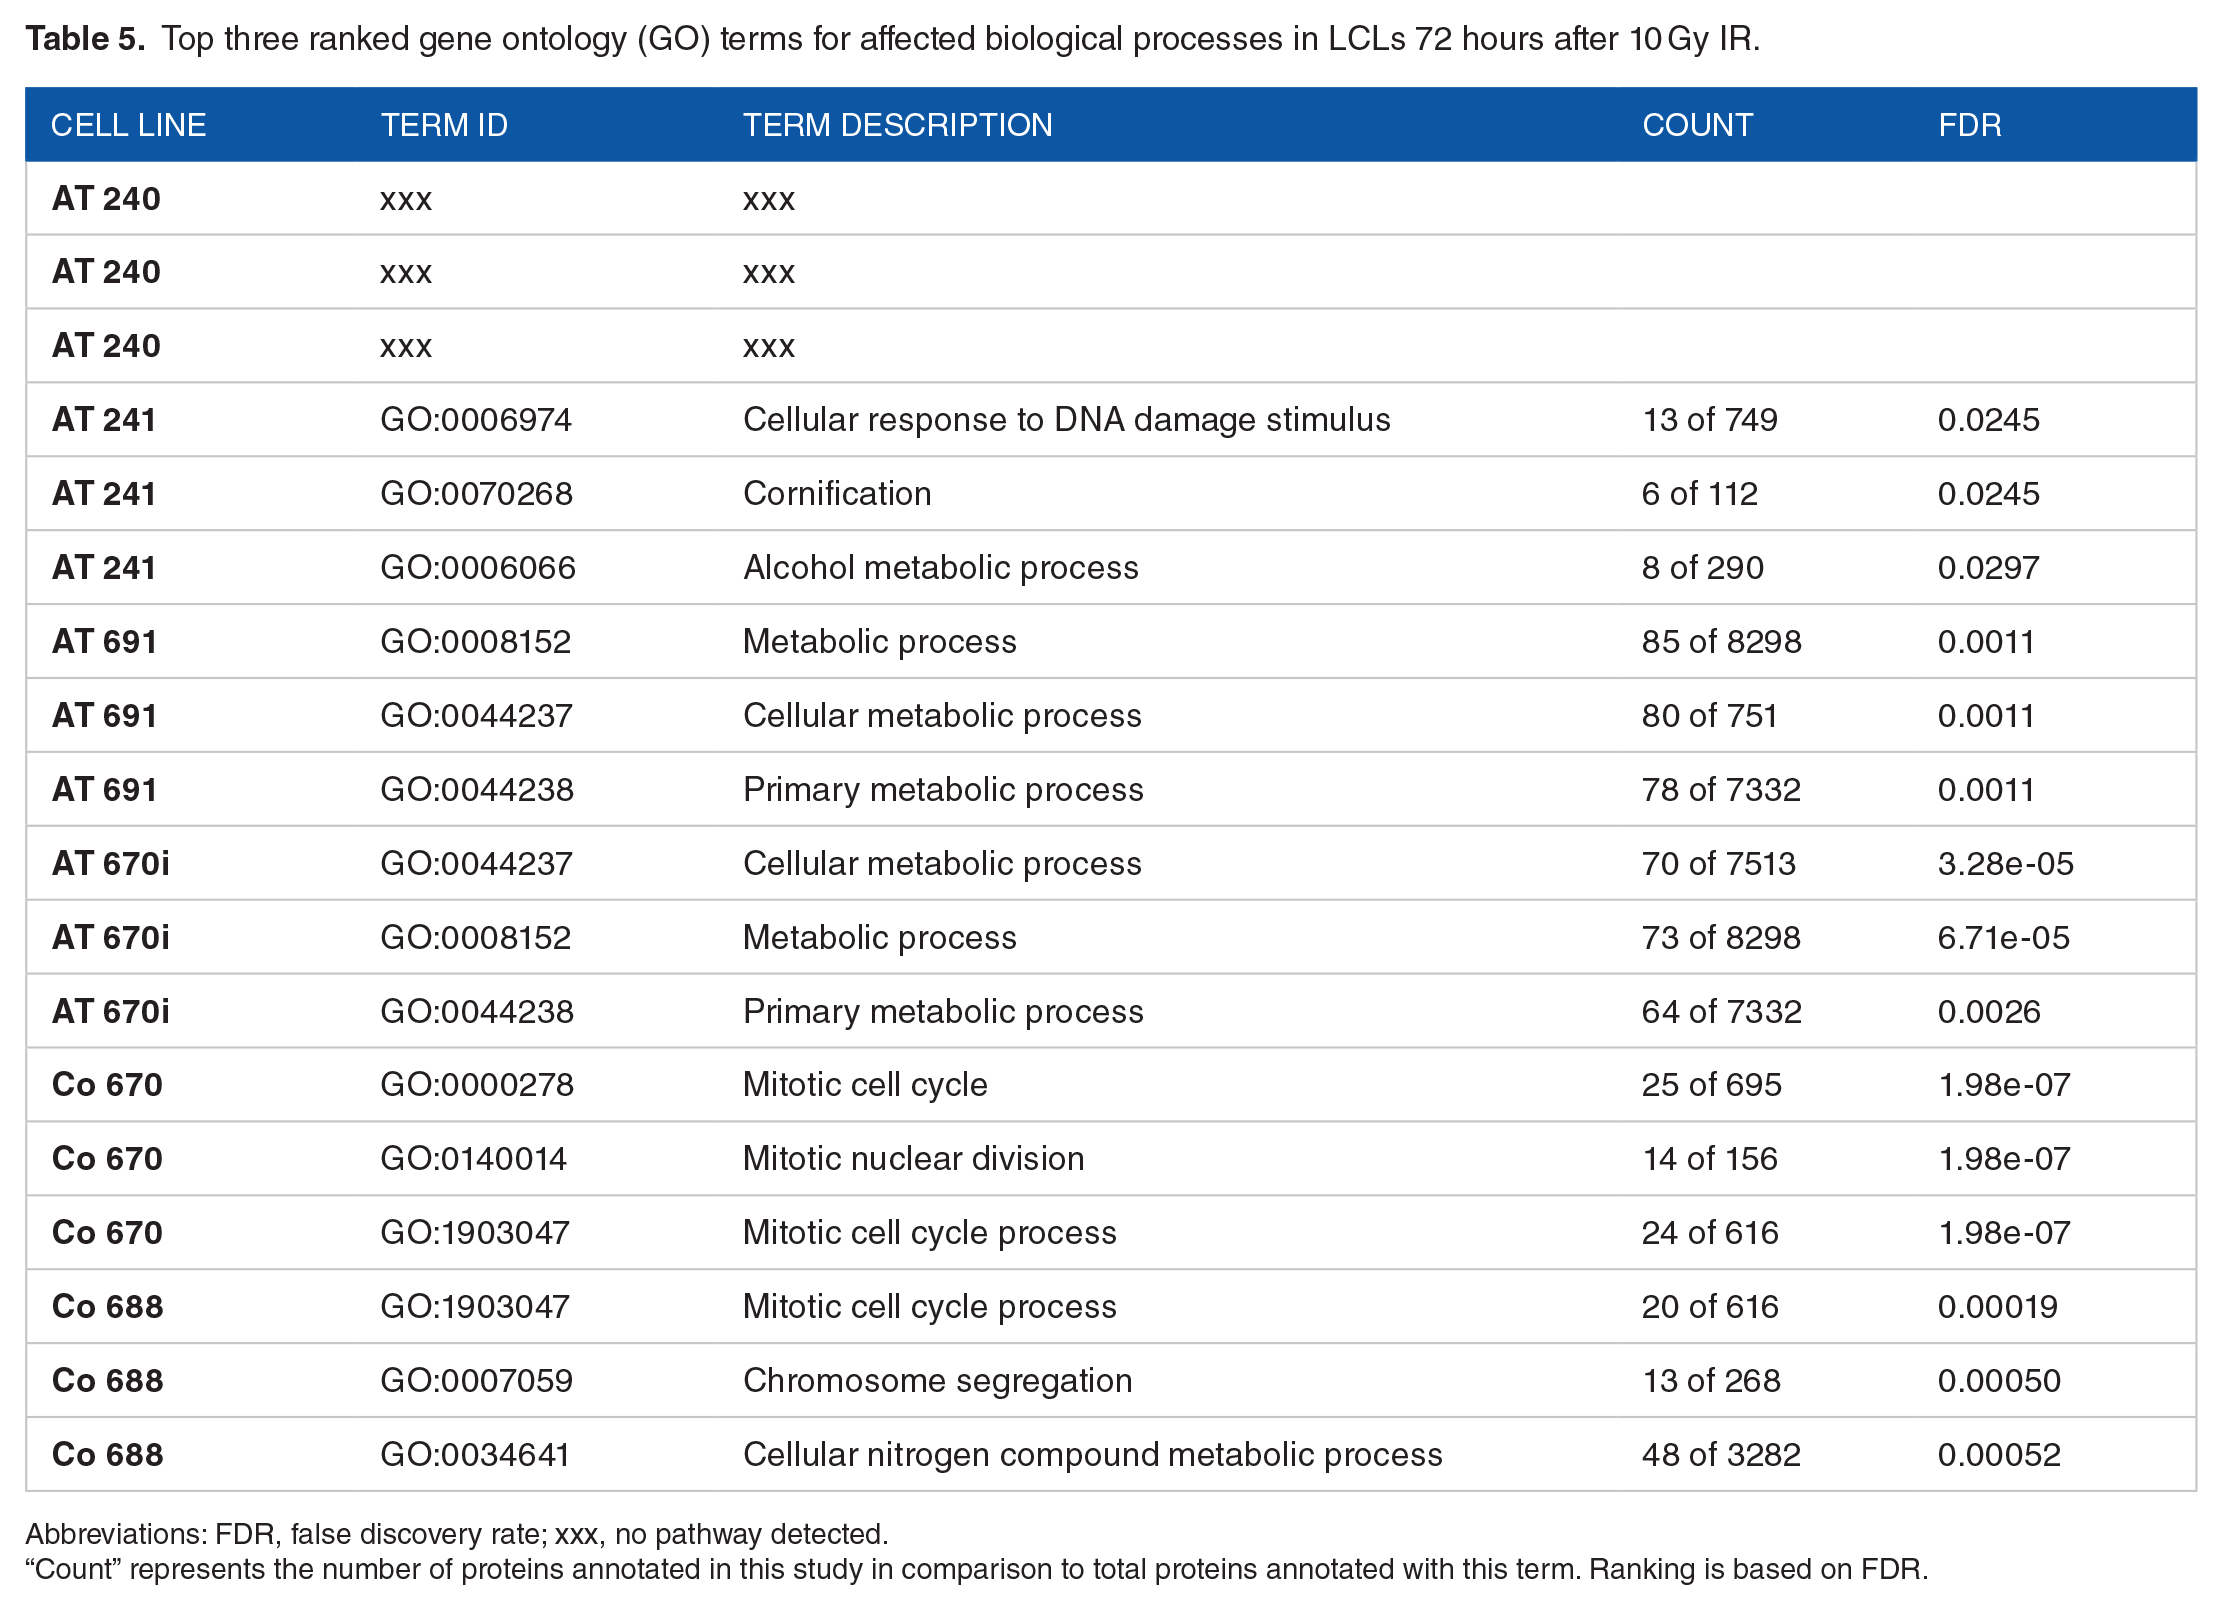
To gain a better understanding of the biological pathways that are affected after IR, the embedded STRING function for predicting biological processes associated with Gene Ontology (GO) terms was applied. The top 3 ranked GO terms for the category of biological processes on each cell line 24 and 72 hours after IR are shown in Tables 4 and 5. Twenty-four h after 10 Gy IR, deregulated proteins in AT 240 and AT 691 participate in metabolic processes (GO:0008152, GO:0044237, GO:0044238). Degradation of proteinaceous complexes (GO:0032984) is the major biological process impacted in irradiated AT 241. In AT 670i, the most significant biological processes were programmed cell death (GO:0012501), immune effector process (GO:0002252), and leukocyte-mediated immunity (GO:0002443). The majority of significantly deregulated proteins in Co 670 are involved in various mitotic processes (GO:0000278, GO:0140014, GO:1903047), while regulated exocytosis (GO:0045055), immune effector process (GO:0002252), and myeloid leukocyte activation (GO:0002274) were affected in Co 688.
Top three ranked gene ontology (GO) terms for affected biological processes in LCLs 24 hours after 10 Gy IR.

Abbreviations: FDR, false discovery rate; xxx, no pathway detected.
“Count” represents the number of proteins annotated in this study in comparison to the total proteins annotated with this term. The ranking is based on the false discovery rate (FDR).
Top three ranked gene ontology (GO) terms for affected biological processes in LCLs 72 hours after 10 Gy IR.
Abbreviations: FDR, false discovery rate; xxx, no pathway detected.
“Count” represents the number of proteins annotated in this study in comparison to total proteins annotated with this term. Ranking is based on FDR.
No GO terms for biological processes were detected for the deregulated proteins of AT 240, 72 hours after IR, which may be attributed to weak protein linkages. Significantly deregulated proteins in AT 241 contributed to the cellular response to DNA damage stimuli (GO:0006974), keratinization (GO:0070268), and alcohol metabolic process (GO:0006066). The biological processes in AT 691 are similar to those found at 24 hours. Identical processes affected in AT 240 are also found to be present in AT 670i (GO:0008152, GO:0044237, GO:0044238), suggesting that the loss of ATM function in both cell lines might affect similar signaling pathways. The majority of significantly deregulated proteins in the controls clustered in mitotic processes (GO:0000278, GO:0140014, GO:1903047). The second and third most significant biological processes in Co 688 included chromosome segregation (GO:0007059) and the cellular metabolic process of nitrogen compounds (GO:0034641).
Intercomparison of the identified GO terms indicates IR-induced deregulation of metabolic processes in AT cells (Tables 4 and 5), whereas mitosis-related functions appeared in both controls (Figure 5A). For further identification of commonly deregulated pathways in the controls, STRING analysis on the 20 proteins solely deregulated in the controls was performed. The top 5 GO terms on the basis of FDR ranking in control cells were mitotic cell cycle processes (GO:1903047), cell cycle processes (GO:0022402), chromosome segregation (GO:0007059), nuclear division (GO:0000280), and mitotic nuclear division (GO:0140014). Ten of 20 proteins (NCAPH, CDCA5, SPC25, CENPH, TPX2, CDCA8, POLE3, INCENP, TBCE, NUSAP1) are linked to mitotic cell regulation, as shown highlighted (Figure 5B).

Biological pathway analysis of radiation-deregulated proteins in control cells 72 hours after 10 Gy. (A) biological pathway analysis of 20 proteins uniquely regulated in Co 670 and Co 688 (GO terms). (B) Protein interaction map of the 20 proteins uniquely regulated in Co 670 and Co 688. Proteins assigned to mitotic cell cycle process are shown in red.
Moreover, proteins that are related to Chromosome segregation (GO:0007059) (NCAPH, CDCA5, SPC25, CENPH, CDCA8, INCENP, and NUSAP1 were significantly deregulated in controls. Amongst them, proteins INCENP and CDCA8 are components of chromosome passenger complex (CPC) along with protein Aurora B kinase (AURKB).
mRNA expression of chromosome passenger complex (CPC) components is different in healthy LCLs and AT cells after IR exposure
Ionizing radiation exposure resulted in downregulation of CPC components (INCENP and CDCA8) 72 hours after irradiation in controls. To check on whether the CPC is affected by IR in AT cells, we selected these components together with AURKB for validation on the transcriptomic level. For RT qPCR, cells were irradiated or sham irradiated with 10 Gy and harvested 24, 48, and 72 hours after IR. In good agreement with proteomics data, the analysis showed that the expression level of INCENP, AURKB, and CDCA8 mRNA were down-regulated after IR in control lines after all time points. In contrary, the expression level of all three genes was upregulated in AT cells 24 hours after IR (Figure 6).

Heat maps of radiation-induced regulation of CPC transcripts by RT-qPCR. Heat maps of (A) AuroraB Kinase (AURKB), (B) Inner Centromere Protein INCENP and (C) Borealin (CDCA8) detected by quantitative reverse transcription PCR (RT-qPCR). The heat maps illustrate that the selected differentially expressed genes were in accordance with the results of the proteome changes. The rows represent the cell lines and the columns represent 3 replicates of each time point. Blue indicates downregulation, red upregulation. The results were normalized with the housekeeping gene GAPDH.
Discussion
Since the signaling pathways underlying radiation (hyper)sensitivity are not yet understood, we were interested in identifying signaling pathways and protein targets to distinguish between the radiation response of normosensitive and radiation sensitive AT cells to provide more insight regarding the mechanisms of radiosensitivity.
To determine the radiosensitivity of lymphoblastoid cell lines in vitro, the WST1 assay was used and viability was scored 24 hours after irradiation with 10 Gy. 17 We showed that ionizing radiation decreased the viability as expected for all cell lines. However, only 2 of the 7 AT lines showed a more pronounced sensitivity than the controls, suggesting that the viability test cannot discriminate between healthy and ATM-mutated cell lines in this study at 24 hours, confirming previous results26,27
Our analysis of markers of DNA damage response including phosphorylation of KAP1 and formation of 53BP1 foci confirmed the contribution of ATM deficiency in increased radiosensitivity via impaired DNA damage repair and checkpoint signaling.
Failure to repair DNA damage results in cell death, while incorrect repair causes genomic instability and subsequently carcinogenesis. ATM phosphorylates the transcriptional co-repressor and heterochromatin assembly factor KAP1 at serine 824, allowing repair of damaged sites by non-homologous end joining or homologous recombination. 28 KAP1 is also phosphorylated (pKAP1) by the ATM downstream target Chk2 at Serine473, which regulates the expression of KAP1-related stress genes and impacts G2/M checkpoint signaling, dysregulated in AT cells after irradiation. 29 We showed significantly reduced formation of pKAP1 (Serine824) in AT cells compared to control cells. Thus, phosphorylation of KAP1 at early point (1 hour) after exposure to 4 Gy may offer a reliable marker to indicate loss of ATM function. As such, this assay is valuable for rapid, high-throughput screening of ATM functional activity and may be implemented into a clinical routine to screen radiosensitive ATM patients.
DNA repair efficiency was quantified by 53BP1 foci analysis 24 hour after irradiation. 53BP1, like yH2AX, has already shown potential to serve as a biomarker for normal tissue radiosensitivity.30,31 53BP1 supports DSB repair through the nonhomologous end-joining machinery. 32 After ATM loss, ~15% of heterochromatic DSBs cannot be repaired.8,33 -35 A slower decline in the number of foci and an associated higher residual damage 24 hours after irradiation were common features of the AT cells in this study and are consistent with the results reported in other studies.36,37 Altogether, ATM deficiency leads to loss of KAP1 phosphorylation, which potentially enhances radiosensitivity through impaired DNA damage repair and checkpoint signaling.
To find processes regulated by IR in general and in AT cells as model system for radiosensitive cells in particular, comparative proteomic analysis was performed. In line with our previous study, protein alterations following irradiation differed based on cell lines used. 18
Only ubiquitin conjugating enzyme 2C (UBE2C) is downregulated 24 hours post exposure in all cell lines studied. Multiple studies have described UBE2C as a potential oncogene and therapeutic target for cancer treatment.38 -40 The regulatory role of UBE2C in cell proliferation and transformation was described before.41,42 Rawat et al. demonstrated that inhibition of UBE2C markedly reduced proliferation and survival after IR in breast cancer cells. This result supports the notion that the radiation-induced downregulation of UBE2C contributes to the radiation response in normal and cancerous tissues. 43
Surprisingly, little overlap and interaction were found among the deregulated proteins in the AT cells tested. One important factor potentially influencing the diverse proteomic findings is increased cell death in AT 240 and AT 241 72 hours after IR. The role of ATM in regulating cell death including apoptosis, autophagy, necroptosis, and ferroptosis has been previously described.44 -49 The small overlap in AT cells could also have been a result of strict filtering of the proteomic data.50 -59
In contrast to the AT lines, radiation-regulated proteins from controls showed more similarities, indicated by mutually regulated pathways. Mitosis-associated processes were deregulated after IR in the controls. In this regard, we found a consistent downregulation of the chromosome passenger complex (CPC) proteins inner centromere protein (INCENP) and Borealin (CDCA8) 72 hours after IR. Together with the other CPC member, Aurora B Kinase (AURKB), we confirmed their downregulation on the mRNA level. An increase in INCENP and AURKB is a signature of mitosis. 60 AURKB is elevated during anaphase and decreased prior to cytokinesis upon entry into G1 phase.61,62 In higher eukaryotic cells, the catalytic activity of AURKB is required for sustained mitotic arrest in the presence of misattached kinetochore microtubules.63,64 Therefore, CPC is considered an important guardian of genomic stability. Ionizing radiation is known to induce arrest in G1, S, and G2 phases of the mammalian cell cycle, and the ATM protein plays a role in the initiation of checkpoint pathways in all phases of the cell cycle. Cells lacking ATM function exhibit both a defective G2 checkpoint and prolonged G2 arrest after IR. 65 Thus, reduction of mitosis-associated proteins in normal cells could indicate mitotic exit and entry into cytokinesis. In line, a missing downregulation of CPC in AT cells could be the consequence of a prolonged cell cycle arrest.
Furthermore, ATM is a regulator of CPC during cytokinesis. In response to persisting chromatin bridges during cytokinesis, eukaryotic cells delay abscission to prevent chromatin breakage or tetraploidization,66 -68 which is associated with genomic instability and cancer predisposition.69 -72 This abscission delay is called the “abscission checkpoint” and is a result of the optimal localization and catalytic activity of Aurora B kinase in the midbody.67,71,73 The Mre11–Rad50–Nbs1 double-strand DNA break sensor complex activates the DNA damage response kinase ATM at the midbody in cytokinesis with chromatin bridges. 74 Active ATM and the downstream target Chk2 then recruit Aurora B kinase to the flemming body at the midbody during late telophase. Chk2 phosphorylates INCENP at Serine 91, which is connected with proteins involved in abscission. Inhibition of ATM was shown to lead to accelerated abscission of daughter cells regardless of the presence of chromatin bridges. In case of an existing chromatin bridge, the abscission leads to chromatin breakage, which contributes to the development of genomic instability, which is a well-known feature of AT patients.74,75
Overall, misregulated CPC could be a consequence of impaired ATM kinase activity on CPC components and/or an indirect effect of impaired DNA damage response, consistently described for ATM-deficient cells and AT patients.
Conclusion
In this study, we identified IR-induced proteomic changes in normosensitive and ATM-mutated cell models. A decreased KAP1 phosphorylation 1 hour after IR-exposure and an increased 53BP1 foci number 24 hour after radiation exposure were detected in all AT cells and differed significantly from healthy cells. Due to its rapid detectability and pronounced differences between AT- deficient and -proficient cells, KAP1 phosphorylation represents a promising tool for the rapid identification of patients with ATM mutations. Most importantly, this study showed that proteins belonging to the chromosomal passenger complex are regulated after radiation injury in healthy control cells but not in radiosensitive ATM-deficient cells. Thus, mitosis-associated proteins represent an interesting target to gain new insights into the origin and prediction of radiosensitivity and radiation-induced cancer development in AT patients.
List of abbreviations

Supplemental Material
sj-docx-1-bmi-10.1177_11772719241274017 – Supplemental material for The Chromosome Passenger Complex (CPC) Components and Its Associated Pathways Are Promising Candidates to Differentiate Between Normosensitive and Radiosensitive ATM-Mutated Cells
Supplemental material, sj-docx-1-bmi-10.1177_11772719241274017 for The Chromosome Passenger Complex (CPC) Components and Its Associated Pathways Are Promising Candidates to Differentiate Between Normosensitive and Radiosensitive ATM-Mutated Cells by Anne Dietz, Prabal Subedi, Omid Azimzadeh, Lukas Duchrow, Felix Kaestle, Juliane Paetzold, Sarah Katharina Payer, Sabine Hornhardt, Christine von Toerne, Stefanie M Hauck, Bettina Kempkes, Cornelia Kuklik-Roos, Danielle Brandes, Arndt Borkhardt, Simone Moertl and Maria Gomolka in Biomarker Insights
Supplemental Material
sj-docx-2-bmi-10.1177_11772719241274017 – Supplemental material for The Chromosome Passenger Complex (CPC) Components and Its Associated Pathways Are Promising Candidates to Differentiate Between Normosensitive and Radiosensitive ATM-Mutated Cells
Supplemental material, sj-docx-2-bmi-10.1177_11772719241274017 for The Chromosome Passenger Complex (CPC) Components and Its Associated Pathways Are Promising Candidates to Differentiate Between Normosensitive and Radiosensitive ATM-Mutated Cells by Anne Dietz, Prabal Subedi, Omid Azimzadeh, Lukas Duchrow, Felix Kaestle, Juliane Paetzold, Sarah Katharina Payer, Sabine Hornhardt, Christine von Toerne, Stefanie M Hauck, Bettina Kempkes, Cornelia Kuklik-Roos, Danielle Brandes, Arndt Borkhardt, Simone Moertl and Maria Gomolka in Biomarker Insights
Supplemental Material
sj-xlsx-1-bmi-10.1177_11772719241274017 – Supplemental material for The Chromosome Passenger Complex (CPC) Components and Its Associated Pathways Are Promising Candidates to Differentiate Between Normosensitive and Radiosensitive ATM-Mutated Cells
Supplemental material, sj-xlsx-1-bmi-10.1177_11772719241274017 for The Chromosome Passenger Complex (CPC) Components and Its Associated Pathways Are Promising Candidates to Differentiate Between Normosensitive and Radiosensitive ATM-Mutated Cells by Anne Dietz, Prabal Subedi, Omid Azimzadeh, Lukas Duchrow, Felix Kaestle, Juliane Paetzold, Sarah Katharina Payer, Sabine Hornhardt, Christine von Toerne, Stefanie M Hauck, Bettina Kempkes, Cornelia Kuklik-Roos, Danielle Brandes, Arndt Borkhardt, Simone Moertl and Maria Gomolka in Biomarker Insights
Supplemental Material
sj-xlsx-2-bmi-10.1177_11772719241274017 – Supplemental material for The Chromosome Passenger Complex (CPC) Components and Its Associated Pathways Are Promising Candidates to Differentiate Between Normosensitive and Radiosensitive ATM-Mutated Cells
Supplemental material, sj-xlsx-2-bmi-10.1177_11772719241274017 for The Chromosome Passenger Complex (CPC) Components and Its Associated Pathways Are Promising Candidates to Differentiate Between Normosensitive and Radiosensitive ATM-Mutated Cells by Anne Dietz, Prabal Subedi, Omid Azimzadeh, Lukas Duchrow, Felix Kaestle, Juliane Paetzold, Sarah Katharina Payer, Sabine Hornhardt, Christine von Toerne, Stefanie M Hauck, Bettina Kempkes, Cornelia Kuklik-Roos, Danielle Brandes, Arndt Borkhardt, Simone Moertl and Maria Gomolka in Biomarker Insights
Footnotes
References
Supplementary Material
Please find the following supplemental material available below.
For Open Access articles published under a Creative Commons License, all supplemental material carries the same license as the article it is associated with.
For non-Open Access articles published, all supplemental material carries a non-exclusive license, and permission requests for re-use of supplemental material or any part of supplemental material shall be sent directly to the copyright owner as specified in the copyright notice associated with the article.