
Abstract
Background:
Laparoscopic sleeve gastrectomy (LSG) has emerged as a valuable treatment for various metabolic disorders, including metabolic dysfunction-associated fatty liver disease (MAFLD) in patients with obesity. Consequently, there is a pressing need to develop noninvasive biomarkers for diagnosing and monitoring disease progression.
Objectives:
This study aimed to evaluate specific biomarkers, including Cytokeratin-18 (CK-18), C-peptide, monocyte to HDL cholesterol ratio (MHR), and MACK-3, in patients with obesity with MAFLD undergoing LSG.
Design:
A prospective cohort study on patients with obesity before and 6 months after the LSG procedure.
Methods:
70 patients with obesity with confirmed MAFLD, determined by Transient Elastography (TE), were pre- and 6 months postoperatively tested. Homeostatic Model Assessment of Insulin Resistance (HOMA-IR), lipid profile, ghrelin, leptin, peptide YY, GLP-1, and liver fibrosis scores, including AST/ALT ratio (AAR), Fibrosis-4 index (FIB-4), and BARD Score were tested.
Results:
BMI significantly decreased in all participants, with a % excess weight loss of 62.0% ± 15.4%. TE measurements revealed a significant postoperative reduction from 100% to 87.1% (P = .006). All selected biomarkers showed significant postoperative improvement—a significant association of CK-18 with MAFLD markers, including AAR, FIB-4, and BARD score, were found. MACK-3 had positive associations with FIB-4. C-peptide and MHR showed no association with MAFLD markers. Furthermore, there was a positive correlation between CK-18 and MACK-3 tests and between C-peptide and CK-18 and MACK-3. Additionally, a receiver operating characteristic (ROC) curve was constructed, with CK-18 performing the best, with an estimated area under the curve of 0.863.
Conclusion:
Serum CK-18 outperformed other selected biomarkers in predicting and monitoring MAFLD in patients with obesity, suggesting its prospective utility in clinical practice. Further studies are needed to validate the accuracy of the MACK-3 test.
Plain Language Summary
A sleeve gastrectomy is an operation when patient have obesity and need to lose weight. This operation help people with obesity who also have fatty liver disease that’s not related to alcohol use. Researchers are looking for simple blood tests to track the disease. In this study, they checked how well 4 of these tests worked before and after the surgery in 70 people. They found that the patients lost a lot of weight and their liver health improved. One test, in particular, called CK-18, was really good at showing these changes. Another test, MACK-3, also showed promise, but more research is needed to be sure. The other 2 tests didn’t seem to be linked to signs of fatty liver disease. This suggests that CK-18 could be a useful tool for doctors to see how patients are doing after this surgery
Introduction
Obesity is strongly linked to the development of metabolic syndrome (MS), which elevates the risk of liver disease, particularly metabolic dysfunction-associated fatty liver disease (MAFLD), formerly termed nonalcoholic fatty liver disease (NAFLD). 1 MAFLD is characterized by macrovesicular steatosis in at least 5% of hepatocytes, excluding secondary causes of hepatic fat accumulation like viral infections, alcohol consumption, or certain medications.2,3 The pathophysiology of MAFLD has been traditionally described using the “two-hit hypothesis,” where initial fat deposition leads to insulin resistance (IR) (“first hit”), subsequently triggering inflammation, endoplasmic reticulum stress, hepatocyte injury, apoptosis, and fibrosis (“second hit”). 4 MAFLD can be histologically categorized into metabolic dysfunction-associated fatty liver (MAFL) and metabolic dysfunction-associated steatohepatitis (MASH), the latter characterized by hepatic steatosis, inflammation, hepatocellular injury (ballooning), with or without fibrosis. 5
Cytokeratin-18 (CK-18) is a cytoskeletal protein found in hepatocytes. During liver cell injury and apoptosis, notably MAFLD, CK-18 intermediate filaments are disassembled with concomitant monomeric synthesis and aggregation. Then, the caspase enzyme cleaves the CK-18 into stable fragments released from hepatocytes into circulation. 6 CK-18 levels correlate with disease activity, making it a simple and non-invasive indicator of liver cell injury.6 -8 Boursier et al 9 and Chuah et al 10 were the first to introduce the MACK-3 test, which combines aspartate aminotransferase (AST), Homeostasis Model Assessment for insulin resistance (HOMA-IR), and CK-18 to diagnose MASH.
Additionally, obesity-associated insulin resistance (IR) is attributable to the enhanced release of non-esterified fatty acids (NEFA) with the expansion in fat mass. NEFAs, together with other metabolites such as acyl-CoAs and ceramides, activate protein kinases as Protein Kinase C (PKC) and the inhibitor of nuclear factor-κB kinase-β (IKKβ). 11 These kinases then potentially compromise insulin signaling by accentuating the inhibitory serine phosphorylation of insulin receptor substrates (IRS), the principal promoter of insulin receptor signaling that leads to insulin resistance (IR).11,12 IR expresses augmented serum levels of insulin. C-peptide is a small 31-amino acid peptide cleaved from proinsulin during insulin synthesis in the endoplasmic reticulum of beta-pancreatic cells. It is stored in the Golgi secretory granules.12,13 It is secreted into circulation in equal amounts with insulin. Accordingly, it can be beneficial for screening and monitoring the degree of insulin resistance in MAFLD. 13 Furthermore, several events proceeding in parallel lead to liver inflammation and contribute to the pathophysiology of MAFLD conjointly with IR, including excess flow of fatty acids (NEFAs) to the liver with concomitant hepatic de Novo lipogenesis (DNL), lipotoxicity, oxidative stress, endoplasmic reticulum stress, and mitochondrial dysfunction.12,14 Also, enhanced hepatic fat accumulation is associated with altered hepatic lipoprotein secretion, such as increased secretion of low-density lipoproteins (LDL) and very low-density lipoproteins (VLDL) and decreased secretion of high-density lipoproteins (HDL). 15 Therefore, the monocyte-to-HDL-cholesterol ratio (MHR) is a biomarker that evaluates the balance between inflammation and oxidative stress of monocytes and HDL-C. 16 Therefore, it may present a potential biomarker of MAFLD. However, its role in MAFLD has not been fully explored.
Liver biopsy remains the definitive method for diagnosing MAFLD, yet a high failure rate and risk of complications limit it.
17
Ultrasound, though non-invasive, is less effective in patients with obesity due to excess subcutaneous fat. Advanced imaging techniques, such as computed tomography (CT) and magnetic resonance imaging (MRI), incur higher costs and complexities and often struggle to differentiate between metabolic dysfunction-associated steatohepatitis (MASH) and simple steatosis.18,19 In a 2023 systematic review, Hany et al
20
identified 14 distinct liver outcome tests for MAFLD; however, the high heterogeneity and lack of complete data precluded a meta
This study tested these biomarkers preoperatively and 6 months postoperatively, considering changes in BMI, other metabolic biomarkers, lipid profile, HOMA-IR, gut hormones including ghrelin, leptin, peptide YY, GLP-1, and liver fibrosis scores: AST/ALT ratio (AAR), Fibrosis-4 index (FIB-4), and BARD Score.
Material and Methods
This prospective cohort study on patients with obesity before and after LSG procedure with MAFLD was conducted at the Medical Research Institute, Alexandria University, Egypt, between January 2023 and April 2023, with 6 months of follow-up. The study was conducted in accordance with the principles of the Declaration of Helsinki and approved by the ethical committee board (IORG0008812) of Alexandria University, Egypt, under number E/C.S/N. R7/2022. All patients were fully informed of medical, psychological, and nutritional changes they were prone to experience after surgery, and they had to sign a written informed consent form before the start of the study. STROBE Guidelines were followed and applied (Appendix 1).
Study endpoints
Inclusion criteria
Patients eligible for BMS were aged between 18 and 65 years, with a body mass index (BMI) > 35 kg/m2 and a diagnosis of a metabolic syndrome. This was defined by at least 3 of the following: (1) triglycerides (TG) ⩾ 150 mg/dL or receiving lipid-lowering drugs, (2) fasting glucose ⩾ 100 mg/dL or receiving medication for diabetes, (3) blood pressure systolic ⩾ 130, diastolic ⩾ 85 mmHg or receiving medication for hypertension, (4) HDL-cholesterol < 35 mg/dL in men or <39 mg/dL in women, and (5) abdominal obesity (waist circumference > 102 cm in men or >88 cm in women).
Exclusion criteria
(1) Presence of liver disease as viral hepatitis infection B or C or other chronic hepatic disease as autoimmune hepatitis. (2) History of long-standing consumption of hepatotoxic drugs, such as anti-inflammatory drugs (ibuprofen and diclofenac). (3) Excessive alcohol intake (more than 20 g per week in women and more than 30 g per week in men) or history of alcohol consumption. (4) A secondary cause of obesity is Cushing syndrome.
Data collection
All data and tests were performed, obtained, and compared preoperative and 6 months postoperative.
Laboratory measurements
Lipid profile was determined using Hitachi 7180 Biochemistry Automatic Analyzer (Hitachi, Japan), and hormones were determined using ELISA (EIA-2935) [DRG International, Inc. Springfield NJ, USA]. Blood sampling was performed 1 week before surgery. First, fasting samples were obtained to measure the levels of metabolic biomarkers, including leptin, ghrelin, insulin, total cholesterol, HDLs, LDLs, FBS, and HOMA-IR. The patients were then provided with a standard meal (300 kcal) containing pasta (30 g), ground lean meat (30 g), olive oil (5 g), almonds (n = 6), yogurt (80 g), and dried prune (n = 1), providing 45% carbohydrates, 20% protein, and 35% fat. The meal duration was 15 minutes. Blood samples were collected for the postprandial determination of GLP-1 and PYY after ingestion and 120 minutes after the standard meal (full workup of all lab tastings in Appendix 3).
Preoperative workup
Before surgery, patients followed a liver-shrinking diet for 3 weeks, improving surgical safety. The diet provided 800 to 1200 kcal/day, focusing on high protein, low-fat, and low-carb foods. Protein sources included lean meats, fish, eggs, and low-fat dairy, while sugars and fried foods were eliminated. Fluid intake of at least 64 ounces per day was encouraged. Compliance was monitored through weekly dietitian consultations.
Surgical procedure
The same team performed LSG throughout the study period. Dissection was started 6 cm from the pylorus (antrum preserving) up to the gastroesophageal junction, followed by gastric transaction over a 40F bougie through sequential stapler firings.
Statistical analysis
Descriptive and inferential statistics were used for the analyses. All data were tested for normality using the Kolmogorov-Smirnov, Q-Q plot, and Levene’s tests. Categorical variables are expressed as numbers and percentages. Normally and non-normally distributed continuous variables are presented as means with standard deviations (SDs) and medians with interquartile ranges. When appropriate, categorical variables were tested using Pearson’s chi-square or Fisher’s exact test. Normally distributed continuous data were tested with dependent samples with Student’s t-test, or the Wilcoxon signed-rank test was used for skewed (nonparametric) data. Generalized Estimating Equations (GEE) were utilized to assess changes in C-peptide, CK-18, MACK-3, and MHR and their association with clinical markers pre-and post-surgery. ROC (Receiver Operating Characteristic) curve with corresponding AUC (Area Under the Curve) was tested for the biomarkers’ diagnostic utility for MAFLD. Furthermore, multivariate analysis of variance (MANOVA) was used to evaluate the impact of MAFLD status on several key biomarkers (CK-18, MACK-3 score, MHR, and C-peptide). Statistical significance was set at P < .05. Statistical analyses were performed using the R software, version 4.0.4 (R Foundation for Statistical Computing, Vienna, Austria).
Results
Baseline characteristics
This study included 78 patients who underwent an LSG operation in 2023. In total, 8 patients were lost to follow-up (−8.9%). The final analysis included 70 patients. The mean age was 37.9 ± 12.7 years. 72.9% were female with a preoperative BMI of 45.8 ± 8.1. The most common associated medical problems were 50% apnea, 37.1% diabetes, 30% osteoarthritis, and 20% hypertension (Table 1 and flow-chart in Appendix 4).
Baseline characteristics.

Abbreviation: BMI, body mass index.
Weight loss
Weight loss after 6 months was for %TWL 27.4 ± 9.5 and %EWL 62.0 ± 15.4, corresponding with a mean BMI of 32.7 ± 3.4 (P < 0.001).
Changes in laboratory investigations and biomarkers
Diabetes and insulin resistance, fasting blood glucose (FBG) decreased from a mean of 110.1 ± 37.0 mg/dL to 100.9 ± 30.7 mg/dL (P = .012). Fasting insulin levels and HOMA-IR (homeostatic model assessment of insulin resistance) also significantly decreased.
The lipid profile showed significant increases in high-density lipoprotein (HDL-cholesterol 41.0 to 46.6) and reductions in low-density lipoprotein (LDL-cholesterol 136.8 to 113.5), total cholesterol (T-cholesterol 210.8 to 186.3), and triglycerides (TG 175.1 to 133.8) (P < .001).
Gut hormones ghrelin (0.5 to 0.1), leptin (32.7 to 16.5), peptide YY (PYY 46.3 to 65.2), and glucagon-like peptide-1 (GLP-1 10.9 to 15.5) significantly changed (P < .001). Fibrosis risk markers, AST/ALT ratio (AAR), and FIB-4 were significantly changed (P < .001); only BARD was not significantly changed.
MAFLD and biomarkers postoperative
The transient elastography Liver stiffness (LS) showed a significant reduction in the number of controlled attenuation parameter (CAP) ⩾ 276 dB/m from 100% to 87.1% in 6 months (P = .006) (Table 2)
Comparison of laboratory investigations and biomarkers before and after LSG.

Abbreviations: AAR, AST/ALT ratio; CAP, controlled attenuation parameter; CK-18, Cytokeratin-18; FBG, Fasting blood glucose; FIB-4, Fibrosis-4 index; GLP-1, glucagon-like peptide-1; HDL, high-density lipoprotein; HOMA-IR, Homeostatic Model Assessment of Insulin Resistance; LDL, low-density lipoprotein; LSG, Laparoscopic sleeve gastrectomy; MHR, C-peptide, monocyte to HDL cholesterol ratio; PYY, peptide YY; TG, triglycerides.
Statistically significant (P < .05).
MAFLD biomarkers CK-18 (10.9 to 7.2), MHR (15.9 to 13.7), C-peptide (1.1 to 0.8), and MACK-3 (0.4 to 0.1) were significantly changed (P = .034 to <0.001).
When analyzing the patients with positive and negative MAFLD status after 6 months (87.1% vs 12.9%), no statistically significant differences were observed between the 2 groups for the variables age, gender, preoperative BMI, postoperative BMI, %EWL, %TWL, and associated medical problems. The same was true for the biomarkers CK-18, MACK-3, MHR, and C-peptide levels, which were also insignificant between the groups.
The MANOVA test results did not reveal statistically significant differences between the MAFLD positive group and the controls, with Pillai’s trace values of P = 0.399 before outlier removal and P = .055 after removing 14 outliers.
Confounding correction
Univariate gamma regression analyses investigate potential confounders’ impact on CK-18, MACK-3, C-peptide, and MHR, with the estimates representing the relative change (exponentiated gamma regression coefficients). The findings indicated that sex, age, BMI, and the number of associated medical problems did not significantly affect CK-18, MACK-3, C-peptide, or MHR, and further multiple regression analysis was impossible (Table 3).
Univariate Gamma regression analyses for the effect of potential confounders on CK-18, MACK3, C-peptide, and MHR.
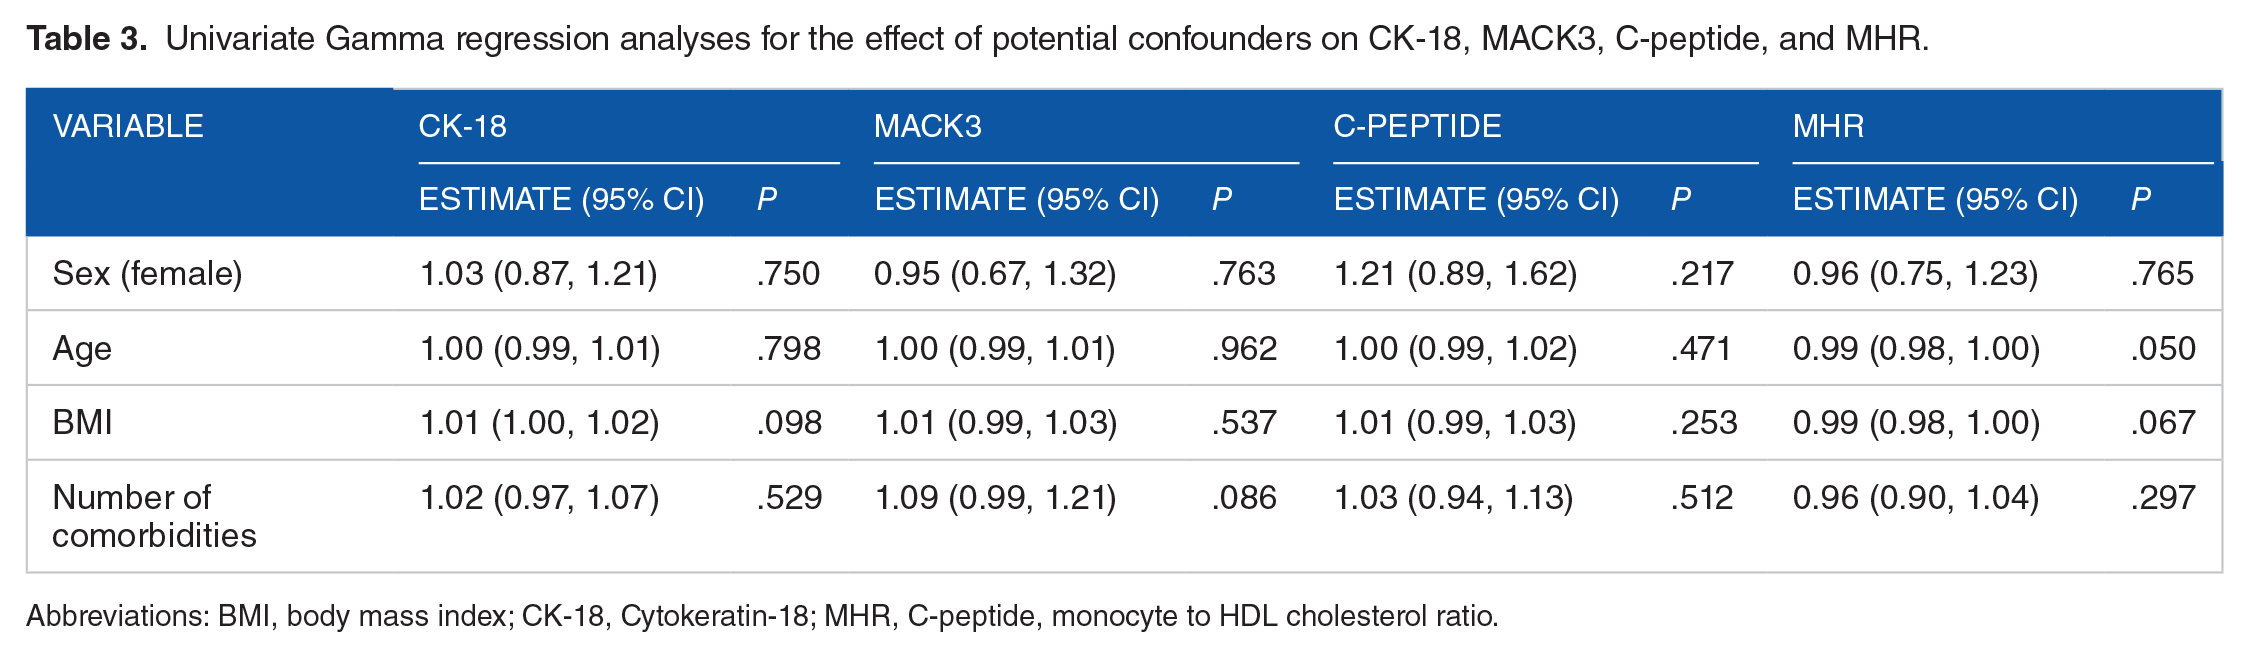
Abbreviations: BMI, body mass index; CK-18, Cytokeratin-18; MHR, C-peptide, monocyte to HDL cholesterol ratio.
Effect of biomarkers and MAFLD after weight loss
All biomarkers were tested pre- and postoperatively with generalized estimating equations. The CK-18 levels, serum C-peptide, MHR, and MACK-3 after WL showed a significant relative change over time (0.66, 0.68, 0.86, 0.30 P < .001)) and an association with BMI changes for CK-18, serum C-peptide and MACK-3 (1.02, 1.02, 1.05 P < .001)), but not in MHR.
There were significant relations between diabetes and insulin resistance (CK-18, serum C-peptide, and MACK-3), lipid (all 4 biomarkers), gut hormones (all 4 biomarkers), fibrosis marker (CK-18 and MACK-3), and MAFLD biomarkers (CK-18, serum C-peptide and MACK-3) profiles.
CK-18 showed effects on fasting insulin, HOMA-IR, HDL, LDL, TC, TG, Ghrelin, leptin, PYY, AAR, FIB-4, BARD, C-peptide, and MACK-3 (P = .025–.001) (Table 4).
Univariate GEE-based analyses for prediction of CK-18.

Abbreviations: AAR, AST/ALT ratio; CAP, controlled attenuation parameter; CK-18, Cytokeratin-18; FBG, fasting blood glucose; FIB-4, Fibrosis-4 index; GEE; Generalized Estimating Equations ; GLP-1, glucagon-like peptide-1; HDL, high-density lipoprotein; HOMA-IR, Homeostatic Model Assessment of Insulin Resistance; LDL, low-density lipoprotein; MHR, C-peptide, monocyte to HDL cholesterol ratio; PYY, peptide YY; TG, triglycerides.
Statistically significant (P < .05).
For Serum C-peptide, this was for FBG, HOMA-IR, LDL, TC, TG, leptin, CK-18, and MACK-3 (P = .025–.001) (Table 5).
Univariate GEE-based analyses for prediction of C-Peptide.

Abbreviations: AAR, AST/ALT ratio; CAP, controlled attenuation parameter; CK-18, Cytokeratin-18; FBG, fasting blood glucose; FIB-4, Fibrosis-4 index; GEE; Generalized Estimating Equations ; GLP-1, glucagon-like peptide-1; HDL, high-density lipoprotein; HOMA-IR, Homeostatic Model Assessment of Insulin Resistance; LDL, low-density lipoprotein; MHR, C-peptide, monocyte to HDL cholesterol ratio; PYY, peptide YY; TG, triglycerides.
Statistically significant (P < .05).
For MHR, this was for HDL and leptin. The MAFLD biomarkers, CK-18, C-peptide, and MACK-3 test did not show statistically significant associations with MHR (Table 6).
Univariate GEE-based analyses for prediction of MHR.

Abbreviations: AAR, AST/ALT ratio; CAP, controlled attenuation parameter; CK-18, Cytokeratin-18; FBG, fasting blood glucose; FIB-4, Fibrosis-4 index; GEE; Generalized Estimating Equations; GLP-1, glucagon-like peptide-1; HDL, high-density lipoprotein; HOMA-IR, Homeostatic Model Assessment of Insulin Resistance; LDL, low-density lipoprotein; MHR, C-peptide, monocyte to HDL cholesterol ratio; PYY, peptide YY; TG, triglycerides.
Statistically significant (P < .05).
For MACK-3, this was for FBG, fasting insulin, HOMA-IR, LDL, TC, TG, Ghrelin, leptin, GLP-1, FIB-4, and in MAFLD biomarkers in CK-18 and C-peptide (P = .025–.001) (Table 7).
Univariate GEE-based analyses for prediction of MACK-3 test.

Abbreviations: AAR, AST/ALT ratio; CAP, controlled attenuation parameter; CK-18, Cytokeratin-18; FBG, fasting blood glucose; FIB-4, Fibrosis-4 index; GEE; Generalized Estimating Equations ; GLP-1, glucagon-like peptide-1; HDL, high-density lipoprotein; HOMA-IR, Homeostatic Model Assessment of Insulin Resistance; LDL, low-density lipoprotein; MHR, C-peptide, monocyte to HDL cholesterol ratio; PYY, peptide YY; TG, triglycerides.
Statistically significant (P < .05).
Correlations between CK-18, C-peptide, MHR, and MACK-3
The correlation coefficients (rho) among the 4 biomarkers were tested. A positive correlation emerged between CK-18 and MACK-3 (rho = 0.54, P < .001). In contrast, moderate positive correlations were observed between C-peptide and both CK-18 and MACK-3, with rho values of 0.32 (P < .001) and 0.27 (P = .001). However, the associations between MACK-3, CK-18, or C-peptide with MHR were weak and not statistically significant (MACK-3 vs MHR: rho = 0.03, P > .05) (Figure 1)

Correlation plot between CK-18, C-peptide, MHR, and MACK-3.
ROC curves and AUC values for C-peptide, CK-18, MACK-3, and MHR
A ROC with AUC for the 4 biomarkers versus transient elastography postoperatively was analyzed. CK-18 demonstrates diagnostic efficacy with an AUC of 0.86 (95% CI: 0.77–0.96, P < .001), a sensitivity of 64.1%, and a specificity of 100%. Conversely, the AUC values for C-peptide, MACK-3, and MHR (0.523, 0.644, 0.568, P > .05) did not substantially exceed the threshold, highlighting their suboptimal diagnostic accuracy (Figure 2, Table 8).

ROC curves for C-peptide, CK-18, MACK-3, and MHR.
AUC for C-peptide, CK-18, MACK-3, and MHR.
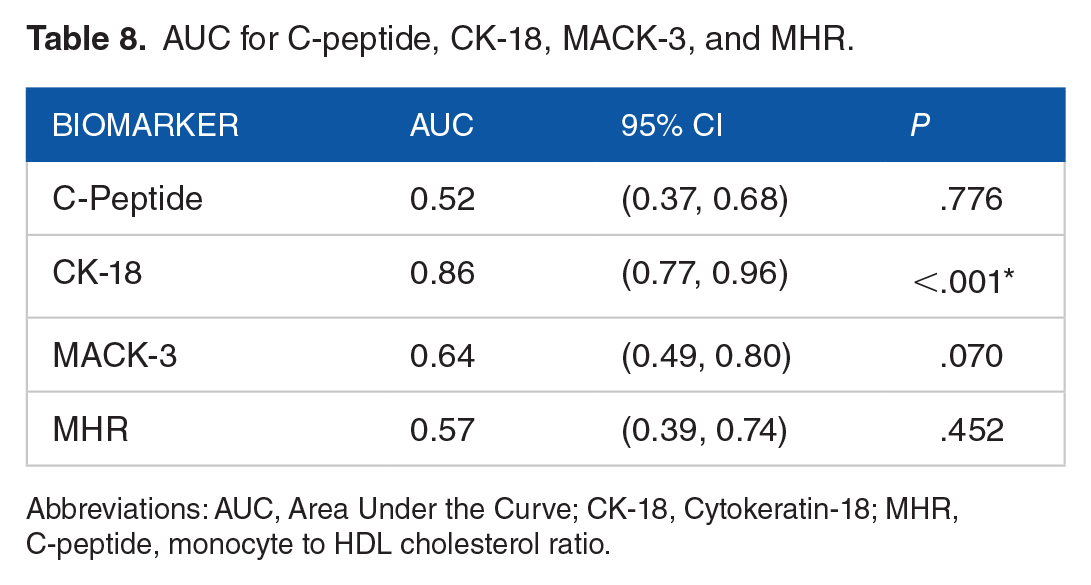
Abbreviations: AUC, Area Under the Curve; CK-18, Cytokeratin-18; MHR, C-peptide, monocyte to HDL cholesterol ratio.
Discussion
This prospective study aimed to validate the predictive and monitoring capabilities of the biomarkers CK-18, MHR, C-peptide, and MACK-3 to MAFLD and their correlation with changes in BMI in patients undergoing BMS. The study’s findings demonstrated significant postoperative reductions in % EWL and % TWL. TE measurements revealed a significant decrease in the percentage of patients with CAP ⩾ 276 dB/m, from 100% preoperatively to 87.1% postoperatively (P = .006). Furthermore, our results indicated improvements in MAFLD (fibrosis risk markers), including AAR and FIB-4, aligning with findings from previous studies.26 -28 The BARD index did not exhibit statistical significance in our study.
Bariatric metabolic surgery and MAFLD
BMS has undergone rigorous investigation as a treatment for MAFLD over the past decade, with a substantial body of evidence emerging from systematic reviews (SR). For instance, an SR conducted in 2022 demonstrated that BMS’s effectiveness in reducing the resolution of steatosis was improved in 56% of patients, ballooning degeneration in 49%, inflammation in 45%, and fibrosis in 25%. 29 This reflects the generally favorable outcomes associated with BMS in managing MAFLD with weight loss as a leading contributor.
The current literature does not answer whether biomarkers like CK-18, MACK-3, C-peptide, or MHR respond differently between LSG and RYGB surgeries. While these markers are associated with metabolic processes, the available research primarily focuses on broader metabolic outcomes such as changes in gut hormones, weight loss, and remission of associated medical problems. For instance, MACK-3, which includes CK-18 as one of its components, has been reported as a promising biomarker for diagnosing fibrotic metabolic dysfunction-associated steatohepatitis (MASH). However, its specific response to different BMS has not been validated externally. 10 Further research specifically examining the response of these biomarkers to different BMS would be necessary to establish any differences in their levels post-BMS. The existing studies highlight differences in gut hormones and broader metabolic effects, indicating that there could be differential effects on various biomarkers.25,27,29
A recent review by Papamargaritis and Le Roux, 30 published in 2021, investigated the role of hormonal changes in weight loss following various BMS (RYGB, LSG). The study sought to determine whether different BMS procedures yield divergent outcomes. Generally, the surgeries exhibited similar effects on gut hormones; however, notable differences were observed between RYGB and LSG in terms of macronutrient absorption, with RYGB specifically accelerating the absorption of glucose and protein. Still, these differences’ exact nature and extent remain to be fully elucidated.
MAFLD and biomarkers
It is well-documented that obesity plays a significant role in the development of MAFLD. Obesity leads to insulin resistance, chronic inflammation, and an increased risk of liver disease. 31 The selected biomarkers, including CK-18,6,8 MHR, 32 C-peptide,13,33 and MACK-3 10 have all been associated with different aspects of this complex relationship. CK-18, for instance, is known to reflect hepatocyte injury and may indicate the grade of liver cell injury in MAFLD. Similarly, MHR has been linked to systemic inflammation and oxidative stress, which are prevalent in obesity-associated medical problems. C-peptide is a marker of insulin resistance, and MACK-3 encompasses various factors, including insulin resistance and hepatocyte injury. However, the interplay between these biomarkers, obesity, and MAFLD is not fully understood, and our study aims to shed light on these complex relationships in the context of BMS.
CK-18
Our study found a significant decrease in serum CK-18 fragment levels postoperatively. BMI positively correlated with CK-18 levels, indicating that higher BMI was linked to elevated CK-18 levels. This is consistent with prior studies that reported increased CK-18 levels in patients with obesity, which reversed after BMS.34,35 Moreover, AAR, FIB-4, and BARD scores were significantly associated with CK-18 levels, in line with Goralska et al’s 35 findings. Our study found significant associations between higher fasting insulin, HOMA-IR, and specific lipid profiles with elevated CK-18 levels. Postoperative increases in Peptide YY and GLP-I may contribute to hepatic improvement. PYY shows a negative association with CK-18, potentially benefiting MAFLD. Additionally, CK-18 is positively associated with leptin and ghrelin.36,37 It is worth mentioning that CK-18 is released into the circulation in other liver diseases, such as hepatitis B and C patients and drug-induced liver injury, as well as in alcoholic liver disease.8,38,39
C-peptide
In our study, C-peptide levels significantly decreased postoperatively, suggesting preoperative insulin resistance (IR). Lee et al. also found C-peptide to predict T2DM resolution in patients with obesity post-BMS. 40 While C-peptide was positively associated with BMI, it was not significantly associated with MAFLD markers (AAR, FIB-4, BARD), in line with Francque et al’s 41 findings. However, it is important to note that the exact role of C-peptide in the context of MAFLD remains unclear, as some studies have linked it to MAFLD.13,42 Our results revealed associations between C-peptide, HOMA-IR, and lipid profiles, consistent with the combined occurrence of IR and dyslipidemia.36,43 Abdullah et al 44 proposed a link between elevated C-peptide and fatty liver associated with hyperinsulinemia and IR. Furthermore, C-peptide was positively associated with leptin, suggesting a role in modulating insulin sensitivity through the PI3K pathway, which is impaired in obesity-induced IR. 45 Leptin has also been implicated in MAFLD, particularly in patients with diabetes, possibly through inflammatory mechanisms.45,46
MHR
MHR is known for its role in systemic inflammation and cardiovascular diseases. Several studies have concluded that MHR significantly increases fatty liver disease and correlates with insulin resistance.47,48 Hepatic infiltration macrophages via monocyte-derived macrophages and resident macrophages named Kupffer cells secrete proinflammatory cytokines as transforming growth factor-β and platelet-derived growth factor that stimulate liver fibrosis progression during the disease. 49 Conversely, HDL-C exhibits anti-inflammatory and antioxidant actions by defending endothelial cells and preventing LDL oxidation.48,50 In the present study, MHR significantly decreased postoperatively, possibly due to reduced systemic inflammation and adipose tissue mass. The analysis in this study did not reveal an association with BMI or the other MAFLD biomarkers, FBG, or HOMA-IR. The MHR was associated solely with HDL cholesterol and leptin, possibly due to leptin’s proinflammatory properties.32,47 Still, it has less predictive value for MAFLD as a non-invasive tool. Other studies reported significant elevation in liver disease patients as hepatitis B virus-related acute liver failure and hepatocellular carcinoma.51 -53
MACK-3
MACK-3 offers promise by targeting critical components of MAFLD, including inflammation, insulin resistance (IR), and hepatocyte injury. 9 Our analysis revealed significant positive associations between MACK-3 and BMI, IR, and dyslipidemia. Furthermore, it demonstrated robust positive connections with ghrelin and leptin. In addition, the MACK-3 test displayed a strong positive association with the MAFLD marker FIB-4. This aligns with the suggestion by Canivet et al., who proposed MACK-3 as a valuable diagnostic tool for identifying patients with fibrotic MASH. 54
Correlations and clinical implications
There was a positive correlation between the biomarkers CK-18 and MACK-3 test. For C-peptide vs CK-18 and MACK-3, this was moderate. Checking the best-performing biomarker CK-18 from this study in the AUC analysis with a score of 0.86 compared with the transient elastography postoperatively with a sensitivity of 64.1% and a specificity of 100% still highlights some uncertainties. First, the displayed sensitivity of 64.1% may not be high enough to rule out the disease in all patients with a negative result, indicating that additional testing may be necessary to avoid false negatives. However, the specificity reached 100%, suggesting that a positive CK-18 test result is highly reliable for confirming the disease, allowing immediate and confident treatment decisions. This interplay between sensitivity and specificity underscores the importance of carefully considering the implications of diagnostic test results, especially in cases where a balance between sensitivity and specificity is required for clinical decision-making. In contrast, Boursier et al. conducted a comprehensive study involving a large multicenter series of MAFLD patients, in which they found that MACK-3 had a significantly higher AUROC (0.847 ± 0.030, P ⩽ .002, with sensitivity of 90% and specificity of 94.2%) compared to other fibrosis biomarkers such as BARD and FIB-4. 9
Lastly, the gold standard test employed in this study, transient elastography, revealed a postoperative reduction of −12.9% in MAFLD 6 months after BMS, indicating that 87.1% of patients still received an MAFLD diagnosis. The interaction among MAFLD biomarkers, weight loss, fibrosis risk markers, and improved lab results suggests that 6 months post-BMS may be insufficient to definitively confirm the impact of CK-18, as evidenced by its relatively low sensitivity. Our study did not find statistical significance for confounding factors regarding age, gender, preoperative BMI, postoperative BMI, %EWL, %TWL, effects, or the 4 biomarkers when comparing patients with and without MAFLD following LSG. Consequently, it remains unclear which potential confounding factors might have influenced the results. This highlights the need for ongoing research and extended follow-up periods to thoroughly assess the role of CK-18, alongside other potential biomarkers, in the non-invasive postoperative monitoring of MAFLD. Further investigations are essential to elucidate the factors contributing to the observed differences and their implications in the context of metabolic surgery.
Regarding the combined diagnostic systems, while CK-18 showed a strong independent performance, our study does not negate the utility of combined biomarkers such as MACK-3, which also showed positive associations with other relevant markers like FIB-4. The utility of combined biomarkers often lies in their ability to provide a more holistic view of the disease state, particularly in complex diseases like MAFLD, where multiple pathological processes are at play. However, the effectiveness of using a single biomarker or a combination can vary depending on the specific clinical outcomes being targeted and the characteristics of the patient population. For clinical outcomes and disease severity: Biomarkers may differ in their sensitivity and specificity depending on whether they are used to detect early-stage steatosis or advanced fibrosis. For instance, CK-18 is more effective in detecting apoptosis associated with NASH, a more severe form of MAFLD. The effectiveness of biomarkers can vary in monitoring response to treatment, such as weight loss interventions or pharmacotherapy. For example, changes in the MACK-3 score might be more sensitive to alterations in liver fibrosis following treatment.55,56 For patient characteristics and demographic variations: Age, gender, and ethnicity can affect biomarker levels. For example, younger patients might show different biomarker profiles than older individuals because of differences in metabolic activity and liver fat content. Comorbidities such as diabetes, obesity, or cardiovascular diseases can influence the expression and reliability of biomarkers. For instance, patients with diabetes might exhibit elevated C-peptide levels, which could interfere with interpreting this biomarker in the context of MAFLD.55,57 By considering these variables, clinicians and researchers can tailor the use of biomarkers to optimize diagnostic accuracy and therapeutic monitoring, adapting approaches based on the specific needs and characteristics of the patient population. We agree that further studies are necessary to validate the accuracy and clinical utility of CK-18 compared to MACK-3 and other combined diagnostic systems. Future research should explore these relationships in larger and more diverse populations and across different stages of MAFLD to establish a clearer consensus on the best diagnostic approach. In conclusion, our findings contribute to the ongoing discussion about the optimal biomarkers for MAFLD diagnosis and management. CK-18 has promising potential for inclusion in clinical protocols, but we also acknowledge the indispensable role of comprehensive diagnostic evaluations in certain clinical scenarios.
Limitations
Our present study had several limitations. Firstly, MAFLD was diagnosed primarily using TE non-invasive techniques alongside simple MAFLD markers (AAR, FIB-4, and BARD score), without histological biopsy confirmation. Secondly, we could not accurately assess the MHR value as an inflammatory marker, as it would have been preferable to compare it with another inflammatory biomarker, such as high-sensitivity C-reactive protein. Additionally, our study had a relatively short follow-up time of 6 months, which limited our ability to observe substantial changes in MAFLD and the impact of various biomarkers. More extended follow-up periods could reveal different insights into the dynamics of MAFLD and the effectiveness of these biomarkers over time.
Conclusion
All 4 biomarkers showed after weight loss a significant relative change over time and an association with BMI changes for CK-18, serum C-peptide, and MACK-3. This study highlights that CK-18 is the only significant promising non-invasive biomarker for MAFLD in patients with obesity undergoing BMS with a high AUC of 0.86 compared with transient elastography. It demonstrates several characteristics that make it an ideal candidate, including simplicity, hepatocyte specificity, and reproducibility. CK-18 aids in preoperative prediction and postoperative monitoring of MAFLD. While CK-18 outperformed MACK-3 in predicting MAFLD, MACK-3, which combines CK-18 with other factors, shows potential but needs further validation for clinical use. Both CK-18 and MACK-3 are related to C-peptide levels in MAFLD associated with obesity, a relationship that warrants further investigation in future studies.
Footnotes
Appendix
STROBE statement.

| Item no | Recommendation | Page no | |
|---|---|---|---|
| Title and abstract | 1 | (a) Indicate the study’s design with a commonly used term in the title or the abstract | |
| (b) Provide in the abstract an informative and balanced summary of what was done and what was found | 1 | ||
| Introduction | |||
| Background/rationale | 2 | Explain the scientific background and rationale for the investigation being reported | 4 |
| Objectives | 3 | State specific objectives, including any prespecified hypotheses | 6 |
| Methods | |||
| Study design | 4 | Present key elements of study design early in the paper | 7 |
| Setting | 5 | Describe the setting, locations, and relevant dates, including periods of recruitment, exposure, follow-up, and data collection | 7 |
| Participants | 6 | (a) Give the eligibility criteria, and the sources and methods of selection of participants. Describe methods of follow-up | 7 |
| (b) For matched studies, give matching criteria and number of exposed and unexposed | |||
| Variables | 7 | Clearly define all outcomes, exposures, predictors, potential confounders, and effect modifiers. Give diagnostic criteria, if applicable | 8-9 |
| Data sources/measurement | 8 a | For each variable of interest, give sources of data and details of methods of assessment (measurement). Describe comparability of assessment methods if there is more than one group | 8-9 |
| Bias | 9 | Describe any efforts to address potential sources of bias | 10-11 |
| Study size | 10 | Explain how the study size was arrived at | 11 |
| Quantitative variables | 11 | Explain how quantitative variables were handled in the analyses. If applicable, describe which groupings were chosen and why | 10-11 |
| Statistical methods | 12 | (a) Describe all statistical methods, including those used to control for confounding | |
| (b) Describe any methods used to examine subgroups and interactions | |||
| (c) Explain how missing data were addressed | 10-11 | ||
| (d) If applicable, explain how loss to follow-up was addressed | |||
| (
|
|||
| Results | |||
| Participants | 13 a | (a) Report numbers of individuals at each stage of study—e.g., numbers potentially eligible, examined for eligibility, confirmed eligible, included in the study, completing follow-up, and analyzed | 12 |
| (b) Give reasons for non-participation at each stage | |||
| (c) Consider use of a flow diagram | |||
| Descriptive data | 14 a | (a) Give characteristics of study participants (e.g., demographic, clinical, social) and information on exposures and potential confounders | 12-13 |
| (b) Indicate number of participants with missing data for each variable of interest | |||
| (c) Summarize follow-up time (e.g., average and total amount) | |||
| Outcome data | 15* | Report numbers of outcome events or summary measures over time | 12-15 |
| Main results | 16 | (a) Give unadjusted estimates and, if applicable, confounder-adjusted estimates and their precision (e.g., 95% confidence interval). Make clear which confounders were adjusted for and why they were included | 12-13 |
| (b) Report category boundaries when continuous variables were categorized | |||
| (c) If relevant, consider translating estimates of relative risk into absolute risk for a meaningful time period | |||
| Other analyses | 17 | Report other analyses done—e.g., analyses of subgroups and interactions, and sensitivity analyses | 13-15 |
| Discussion | |||
| Key results | 18 | Summarize key results with reference to study objectives | 16 |
| Limitations | 19 | Discuss limitations of the study, taking into account sources of potential bias or imprecision. Discuss both direction and magnitude of any potential bias | 21 |
| Interpretation | 20 | Give a cautious overall interpretation of results considering objectives, limitations, multiplicity of analyses, results from similar studies, and other relevant evidence | 22 |
| Generalizability | 21 | Discuss the generalizability (external validity) of the study results | 16-22 |
| Other information | |||
| Funding | 22 | Give the source of funding and the role of the funders for the present study and, if applicable, for the original study on which the present article is based | 24 |
An Explanation and Elaboration article discusses each checklist item and gives methodological background and published examples of transparent reporting. The STROBE checklist is best used in conjunction with this article (freely available on the Web sites of PLoS Medicine at http://www.plosmedicine.org/, Annals of Internal Medicine at http://www.annals.org/, and Epidemiology at http://www.epidem.com/). Information on the STROBE Initiative is available at http://www.strobe-statement.org.
Give information separately for exposed and unexposed groups.
Appendix 2: Transient Elastography
TE was performed on the right lobe of the liver in the intercostal position according to established protocols using an XL probe. LS was expressed in kilopascals (kPa), and hepatic steatosis was expressed as a controlled attenuation parameter (CAP). CAP is a feature of TE that can quantify the degree of fat deposition in the liver parenchyma by measuring ultrasound attenuation, the normal CAP cutoff is 276 dB/m. 24
Appendix 3: Laboratory measurements
Serum alanine aminotransferase (ALT) and aspartate aminotransferase (AST), glucose, total cholesterol, high density lipoprotein cholesterol (HDL-cholesterol), and triglycerides (TG) were measured enzymatically on a Hitachi 7180 Biochemistry Automatic Analyzer (Hitachi, Japan). While low-density lipoprotein-cholesterol (LDL-cholesterol) was afterward calculated using the Friedewald’s formula [(Total Cholesterol) − (HDL-cholesterol) − (TG/5)].
Fasting insulin levels were measured using ELISA (EIA-2935) [DRG International, Inc. Springfield NJ, USA]. Homeostasis model assessment of insulin resistance (HOMA-IR) was used to evaluate insulin resistance (fasting serum insulin (μIU/ml) × fasting plasma glucose (mmol/L)/22.5). Monocyte was evaluated using Sysmex XN-2800 automated hematology analyzer (Japan) and MHR was calculated as the monocyte count (109/µL)/HDL-C (mg/dL).
De Ritis ratio AST/ALT (AAR): AST (IU/l)/ALT (IU/l). MACK-3:[combination of HOMA-IR, AST, and CK-18] From following calculator (http://forge.info.univ-angers.fr/~gh/wstat/mack3-calculator.php).
Fibrosis-4 index (FIB-4) score was calculated from the formula [age (years) × AST (U/L)]/[platelet count (×109/L) × ALT (U/L)½]. 30 BARD:(BMI > 28 = 1 point) + (AAR > 0.8 = 2 points) + (DM = 1 point). Possible BARD scores range from 0-4 points. The cutoff values used for the diagnosis of severe fibrosis were AAR ⩾ 0.8, BARD score ⩾ 2, and FIB-4 score ⩾ 3.25. 30
Serum Cytokeratin (CK-18) was determined by Human cytokeratin-18 ELISA Kit (Glory Science Co., Ltd; catalog no: I4553)[ No.18 Xiwang Avenue South Rd. Yancheng City, Jiangsu P.R., China www.glorybios.com]. Serum C-peptide by ELISA Kit was estimated by (CALBIOTECH; catalog no CP441S)[ Calbiotech Inc 1935 Cordell Ct., El Cajon, CA92020 USA, www.calbiotech.com]. Serum ghrelin was measured using ELISA Kit (Cloud-Clone Corp; cat no: E-01720hu) [W. Fernhurst Dr., Unit 2201, Katy, TX 77494, USA]). Serum leptin was evaluated by ELISA Kit (Cloud-Clone Corp; cat no: E-00916hu) (TX 77494, USA). Glucagon peptide-1 (GLP-1) quantified using ELISA Kit (Cloud-Clone Corp; Cat no: E-00658hu) (TX 77494, USA). Human Peptide YY (PYY) measured by ELISA Kit (Cloud-Clone Corp; Cat no: E-01191hu) (TX 77494, USA). And fasting insulin levels were measured using ELISA (EIA-2935) [DRG International, Inc. Springfield NJ, USA].
Acknowledgements
Not applicable.
List of abbreviations
Laparoscopic sleeve gastrectomy (LSG)
metabolic dysfunction-associated liver disease (MAFLD)
Cytokeratin-18 (CK-18)
C-peptide, monocyte to HDL cholesterol ratio (MHR)
Transient Elastography (TE)
Homeostatic Model Assessment of Insulin Resistance (HOMA-IR)
AST/ALT ratio (AAR)
Fibrosis-4 index (FIB-4)
Receiver operating characteristic (ROC)
metabolic syndrome (MS)
insulin resistance (IR)
metabolic dysfunction-associated steatohepatitis (MASH)
bariatric metabolic surgery (BMS)
computed tomography (CT)
magnetic resonance imaging (MRI)
body mass index (BMI)
triglycerides (TG)
Metabolic biomarkers (MB)
percentage of total WL (%TWL)
percentage excess WL (%EWL)
Liver stiffness (LS)
Generalized Estimating Equations (GEE)
Area Under the Curve (AUC)
fasting blood glucose (FBG)
high-density lipoprotein (HDL)
low-density lipoprotein (LDL)
peptide YY (PYY)
glucagon-like peptide-1 (GLP-1)
correlation coefficients (rho)
controlled attenuation parameter (CAP)