
Abstract
Current screening methods for prostate cancer (PCa) result in a large number of false positives making it difficult for clinicians to assess disease status, thus warranting advancements in screening and early detection methods. The goal of this study was to design a liquid biopsy test that uses flow cytometry–based immunophenotyping and artificial neural network (ANN) analysis to detect PCa. Numerous myeloid and lymphoid cell populations, including myeloid-derived suppressor cells, were measured from 156 patients with PCa, 123 with benign prostatic hyperplasia (BPH), and 99 male healthy donor (HD) controls. Using pattern recognition neural network (PRNN) analysis, a type of ANN, PCa detection compared against HD resulted in 96.6% sensitivity, 87.5% specificity, and an area under the curve (AUC) value of 0.97. Detecting patients with higher risk disease (⩾Gleason 7) against lower risk disease (BPH/Gleason 6) resulted in 92.0% sensitivity, 42.7% specificity, and an AUC of 0.72. This study suggests that analyzing flow cytometry immunophenotyping data with PRNNs may prove to be a useful tool to improve PCa detection and reduce the number of unnecessary prostate biopsies performed each year.
Background
The use of liquid biopsies for cancer detection has garnered significant traction over the past decade due to their minimal invasiveness and continually expanding list of detectable biomarkers.1-3 These tests are particularly valuable in clinical practice when tumor sampling is unavailable, inaccessible, or inappropriate. Current prostate cancer (PCa) screening practices heavily rely on the prostate-specific antigen (PSA)-based blood test which is known to result in a large number of false positives that may lead to unnecessary prostate biopsies and expose patients to additional risks. Furthermore, most of the prostate biopsies result in either benign or indolent pathologies which can increase risk of overdiagnosis or unnecessary treatment warranting the development of new detection methods.4-7 Several current liquid biopsy technologies have either capitalized on factors that are excreted by the tumor cells, such as circulating tumor DNA (ctDNA) and extracellular vesicles (EVs), or on circulating tumor cells (CTCs) present in the peripheral blood (PB).8-10 In this study, we chose to focus not on the behavior of tumor cells themselves, but rather the response of the immune system to the presence or absence of the solid tumor as a means for detecting PCa.
The immune system is known to be intricately involved with tumor development and progression; this leads to the expansion and contraction of several immune cell populations over time in patients with cancer. For instance, myeloid-derived suppressor cell (MDSC) populations are known to expand in the PB, whereas effector CD8+ T lymphocytes tend to undergo higher rates of spontaneous apoptosis. 11 With the recent developments in flow and mass cytometry, more and more cell parameters can now be measured simultaneously to monitor dozens of different immune cell populations from a single prepared sample of blood. Traditionally, flow cytometry data are analyzed based on a Boolean gating strategy, or manual gating, established by an expert operator visualizing the cell populations in 2-dimensional (2D) dot plots. This laborious manual operator-driven analysis is well known to have various degrees of subjectivity and inconsistency between operators, especially with high-dimensional panels, that become further amplified with patient-dependent deviations in marker expression. Although there is much value to be gained from using these high-dimensional assays for immune monitoring, it has been difficult to implement them in a clinical setting for diagnostic use due to the inefficiency of traditional manual gating creating the need for more advanced software-based analysis.12,13
Machine learning (ML) is a subfield of artificial intelligence that focuses on computational methods, such as artificial neural network (ANNs), for automatically extracting patterns in raw data. 14 When used to make medical diagnostic predictions, ML can be more accurate than conventional techniques and can recognize complex, nonlinear relationships in input data that are too subtle for conventional analysis.14,15 Here, we investigated the use of ML to analyze flow cytometry data for prostate screening and prostate biopsy confirmatory applications that would aim to reduce the high number of men who undergo unnecessary prostate biopsies each year.4,16 We initially evaluated the counts of numerous myeloid and lymphoid cell populations using traditional manual gating to detect PCa followed by the implementation of a type of ANN that is particularly well adapted in pattern recognition and classification, called a pattern recognition neural network (PRNN). This was then used to create two different types of binary classifier systems that use flow cytometry–based immunophenotyping. By using the immune system as an amplifier for PCa detection, this ML strategy integrated with flow cytometry data may create a new type of classifier system separate from traditional flow cytometry analyses that may be easier to implement in the clinic in hopes to improve PCa detection.
Methods
Human samples
Anonymized PB samples (n = 279) were supplied through collaborative agreements with New Jersey Urology (Mt. Laurel and Voorhees, New Jersey) and MD Anderson Cancer Center at Cooper (Camden and Voorhees, New Jersey) and received at The Wistar Institute (Philadelphia, PA). The study was approved by the institutional review boards (IRBs) of MD Anderson Cancer Center at Cooper and The Wistar Institute; the Western IRB (WIRB) approved the study for New Jersey Urology. All subjects signed approved consent forms prior to collection. All blood samples were drawn into K2EDTA vacutainers (~10 mL) and shipped to The Wistar Institute for processing and analysis. Blood was procured from patients who either are undergoing an initial prostate core biopsy or have recently received one and have yet to receive treatment. All patients were either treatment naïve or last received treatment (chemotherapy, radiation therapy, or immunotherapy) for another cancer type more than 6 months prior to blood collection. Clinicopathological characteristics are described in Table 1. Androgen receptor and metastasis status were not evaluated. All samples were stored at 4°C before transport and evaluated within 36 hours after collection.
Clinicopathological characteristics of 156 patients with prostate cancer, 123 with benign prostate, and 99 male healthy donors.

Peripheral blood samples from male healthy volunteers were procured on a voluntarily basis at The Wistar Institute with no selection process outside of standard exclusion criteria for blood donation. As such, all samples were considered to be from healthy individuals and written informed consent was obtained. All blood samples were drawn into K2EDTA vacutainers (~10 mL). Additional healthy donor samples were purchased from Zen-Bio, Inc. (Research Triangle Park, NC, USA). All samples were stored at 4°C and evaluated within 24 to 36 hours after collection to mimic patient sample storage conditions.
Cell isolation, preparation, and flow cytometry
Peripheral blood mononuclear cells (PBMCs) were isolated by centrifugation over a Ficoll-Paque PLUS (Fisher Scientific, Waltham, MA, USA) in a SepMate-15 (IVD) tube (Cat. #85415; STEMCELL Technologies, Vancouver, Canada) following manufacturer instructions. The PBMCs were washed 2× using autoMACS rinsing solution with bovine serum albumin (Cat. #130-091-222 and #130-091-376; Miltenyi Biotec, Bergisch Gladbach, Germany) followed by residual RBC lysis using 1× eBioscience RBC lysis buffer (multispecies) (Cat. #00-4300-54; ThermoFisher, Waltham, MA, USA). The PBMCs were enumerated using a Countess II Cell Counter (ThermoFisher) and were resuspended in autoMACS solution to a cell density of 40 × 106 PBMCs/mL.
For all samples, 1 × 10⁶ PBMCs/mL were stained for a myeloid cell and lymphoid cell panel in washing buffer using the antibodies described in Supplementary Table S1. Briefly, PBMCs were stained with antibodies for 15 minutes at 4°C in the dark followed by washing 2× using washing buffer. Cells were resuspended into washing buffer with DAPI (1:20 000; BD Biosciences, Franklin Lakes, NJ, USA) and with a minimum of 100 000 live cell events (DAPI−) collected. All samples were acquired and analyzed on a BD LSR II flow cytometer running BD FACSDiva software. For the duration of the study, the same flow cytometry protocols and compensation matrices were used. All data were analyzed using FlowJo (BD Biosciences) or Kaluza (Beckman Coulter) analysis software.
Machine learning
Five ML algorithms were selected for classification performance evaluation when classifying flow cytometry event data from 2 classes of patients. The ML algorithms were a shallow ANN with 3 hidden neurons and 4 support vector machine (SVM) variations: (1) linear SVM, (2) SVM with Gaussian kernel, (3) SVM with radial basis function (RBF) kernel, and (4) SVM with polynomial kernel. The ML algorithms were implemented in MATLAB (Version 9.6 R2019a), with the Deep Learning Toolbox (Version 12.1 R2019a), the Parallel Computing Toolbox (Version 7.0 R2019a), and the Statistics and Machine Learning Toolbox (Version 11.5 R2019a). Bayesian optimization was selected to optimize SVM hyperparameters and to select the number of neurons and learning rate of the ANN. The MATLAB fitcsvm() function was used to instantiate the SVM machines. The MATLAB patternnet() function was used to generate the shallow ANNs, and the trainscg() (scaled conjugate gradient backpropagation) function was used as the training algorithm for the MATLAB train() ANN training.
The values for the myeloid and lymphoid cell populations and age for each sample were then concatenated to create a single feature set for each sample. For both data sets, 10 different combinations of groups were evaluated, and for each group combination, a fixed number of samples from each class were selected at random for the training data set. The remainder of the samples were used for the final test, or holdout, set. Each ML algorithm was run 10 times on each of the 10 groups, and the averages of the 10 runs were averaged for each group of each data set. Finally, the results of all 10 groups were averaged together for evaluation.
HyperVOX implementation
To prepare the data, we developed a novel procedure called “hypervoxelation of cytometry events,” or HyperVOX, wherein each channel of the flow cytometry data set was used as an axis in a multidimensional space. Each Flow Cytometry Standard (FCS) file was imported into MATLAB (Version 9.6 R2019a) using the fca_readfcs() function, and each axis was divided into 4 segments with each event being defined by its segment location on each axis. These regions are referred to as hypervoxels. Each hypervoxel is a feature common to all samples, and the count of events which fall in a particular hypervoxel for each sample is the distinct numerical value for each feature for that sample. This does not use conventional manual gating.
In this study, two separate panels were used with HyperVOX implementation, each panel having a set number of flow parameters (f): a myeloid cell panel consisting of SSC-A, Lin(CD3/CD19/CD56), CD11b, CD14, CD15, CD16, CD33, HLA-DR, and DAPI (f = 9) and a lymphoid cell panel consisting of SSC-A, CD3, CD4, CD8, CD19, CD56, and DAPI (f = 7); each panel contained a total number of hypervoxels calculated as 4 f . This resulted in a 9-dimensional array containing 49, or 262 144, hypervoxel locations for the myeloid cell panel, and a 7-dimensional array containing 47, or 16 384, hypervoxels locations for the lymphoid cell panel. Each location in the 9- and 7-dimensional arrays represented a position in the flow cytometry hyperspace and contained the number of events indexed to that location. For each sample, 50 000 myeloid cell panel events were selected at random and used to populate the myeloid cell panel space hypervoxels, and 50 000 lymphoid cell panel events were selected at random and used to populate the lymphoid cell panel space hypervoxels. A count was then made of the number of events falling within each hypervoxel which became the common feature between each sample. The populated multidimensional hypervoxel spaces for each sample were then reshaped into column vectors with 4f rows. After all samples were processed, the column vectors for each sample (n) were horizontally concatenated into a single array resulting in a matrix with dimensions of 4f × n for each panel. To reduce computational time, we removed all hypervoxel regions that were found to have no cell events using null hypervoxel elimination. This reduced the number of hypervoxels for the myeloid cell and lymphoid cell panels to 36 720 and 8071, respectively.
Data augmentation
Flow cytometry data were augmented by taking advantage of the fact that substantially more events were measured for each sample than what were actually needed to populate the panel hyperspace. We used an augmentation factor of 20× by repeatedly selecting 50 000 events at random from each parent sample to generate 20 sibling samples. This had the additional benefit of using nearly all of the available event data as there was a negligible chance that any particular event would not be selected for multiple siblings.
Null hypervoxel elimination
To decrease the time for ANN training, a method to remove hypervoxels where no cell events are found was implemented. Only hypervoxels which had an event count of at least one event in any sample were retained for the hypervoxel feature set for ANN training downstream. This reduced the number of hypervoxels for the myeloid panel from 262 144 to 36 720 and for the lymphoid panel from 16 384 to 8071. The rows that corresponded to these empty hypervoxels were eliminated, resulting in a myeloid input array with dimensions of 36 720 rows by the number of samples (n) columns, and a lymphocyte input array of 8071 rows by number of samples (n) columns. Each element in each array was the number of events that were counted for each hypervoxel in that sample.
Data set construction and PRNN synthesis and training
Prior to PRNN training, 3 data sets for training were first constructed: the myeloid cell data, the lymphoid cell data, and the corresponding age for each sample. The 3 data sets were constructed as matrices where each sample was identified by its column position within each of the 3 data sets. A target vector was also constructed that contained the true diagnosis status of each training sample. Next, a scaled conjugate gradient backpropagation algorithm [trainscg()] was selected for PRNN training using the MATLAB Deep Learning Toolbox (Version 12.1 R2019a). Hyperparameters were used and are described in Supplementary Table S2. Selection of the optimum hyperparameters is strongly dependent on the data set and was determined heuristically.
For PRNN training, 500 different networks were trained using the assembled data sets in 5 sets of 100 networks each. For each network trained, 80% of samples from each augmented class of patients were randomly selected for training keeping the sibling samples grouped together. The remaining 20% from each class were used for network validation. The classes were balanced during both the training and validation processes. All training used scaled conjugate gradient backpropagation algorithms.
PRNN calibration and evaluation
After 500 networks were trained, the 3 best networks were chosen based on their performance, or classification accuracy, based on an evaluation test group. The 3 networks with the highest accuracy when testing the evaluation test group were selected for the 3-network voting ensemble. These 3 networks formed an ensemble that voted on the classification of each sample in the group, and the classification result of the ensemble was taken to be the majority vote for each sample. Within the 3 networks in the ensemble, the network having the best sensitivity had its threshold adjusted to improve for sensitivity, the network having the best specificity had its threshold adjusted to improve for specificity, and the network having the best accuracy had its threshold adjusted to improve for accuracy. This resulted in a final ensemble of 3 networks that had the best ensemble classification based on sensitivity, specificity, and accuracy after threshold adjustments. For final evaluation, a holdout sample group, ie, samples that were not used for PRNN training, was tested followed by subsequent sensitivity and specificity analysis. An overview of the PRNN architecture is shown in Supplementary Figure S1.
Statistical analysis
Statistical analysis was performed using nonparametric 2-tailed Mann-Whitney U test. Receiver operating characteristic (ROC) curve and area under the curve (AUC) metrics were used to determine algorithm performance regarding sensitivity, specificity, positive predictive value (PPV), negative predictive value (NPV), and accuracy. All ROC curves, AUC, 95% confidence intervals, and P values were calculated using GraphPad Prism 7 (GraphPad Software Inc.) or MATLAB software. Significance was determined at P < .05.
Results
Biomarker assay development: immunophenotyping differences of healthy, benign, and prostate cancer patients
We initially asked whether we could identify the existence of PCa based on using the manually gated counts of several immune cell populations. In particular, we were interested in measuring a group of heterogeneous myeloid cells called MDSCs which are known to be key contributors in supporting tumor progression and tumor escape through their ability to suppress antitumor responses mediated through T-cell and natural killer (NK) cell activity.17,18 Peripheral blood mononuclear cells were isolated from the low-density cell layer of patient blood and were analyzed for MDSC counts using previously established gating criteria. There are 3 main subpopulations of MDSCs and they are defined as follows: Lin(CD3/CD14/CD15/CD19/CD56)−HLA-DR−CD33+ early-stage MDSCs (eMDSCs), CD14−CD11b+CD15+ polymorphonuclear MDSCs (PMN-MDSCs), and CD14+HLA-DR−/lo monocytic MDSCs (M-MDSCs) (Supplementary Figure S2). 19 Given that the commonly used method for separating normal neutrophils from PMN-MDSCs requires gradient centrifugation, there are limitations that are unavoidable, such as activated neutrophils separating with the low-density PBMC fraction or PMN-MDSCs passing through the gradient into the high-density fraction. This is further amplified with longer time periods between blood collection and processing where normal PMNs are more likely to become activated during storage. 20 We attempted to mitigate this by processing all samples using the same high-throughput centrifugation method within a set time frame of 20 to 36 hours after collection and transport. In addition, samples were analyzed for other cell populations such as CD14+ monocytes, classical (CD14++CD16−) and nonclassical (CD14−/loCD16++) monocytes and CD16−CD15+ PMNs as well as total CD3+ lymphocytes (CD19−CD3+), CD3+ T cells (CD19−CD56−CD3+), CD4+ T cells (CD3+CD56−CD4+), CD8+ T cells (CD3+CD56−CD8+), B cells (CD3−CD19+), and NK cells (CD3−CD56+), NK T cells (CD3+CD56+), CD4+ NKT cells (CD3+CD56+CD4+), and CD8+ NKT cells (CD3+CD56+CD8+) (Supplementary Figure S2).
The PBMC layers from 156 patients with PCa, 123 with benign prostate hyperplasia (BPH), and 99 male healthy donors (HDM) were quantified for their MDSC populations along with the other myeloid and lymphoid cell types mentioned above. Compared only with HDM, patients with PCa showed increases in eMDSC (P < .0001), CD14+ monocyte (P = .0216), classical monocyte (P = .0271), and NK cell (P < .0001) population percentages and decreases in nonclassical monocyte (P = .0314), CD3+ lymphocytes (P = .0007), T cells (P = .0011), CD4+ T cells (P = .0002), CD8+ T cell (P = .0368), NKT cell (P = .0123), CD4+ NKT cell (P = .0005), CD8+ NKT cell (P = .0041), and B cell (P < .0001) population percentages (Figure 1A to P). Compared only with BPH, patients with PCa only showed decreases in M-MDSC (P = .0083) and CD4+ NKT cell (P = .0009) population percentages. For BPH compared only with HDM, patients with BPH showed increases in eMDSC (P < .0001), M-MDSC (P = .0003), CD16− PMN (P = .0064), CD14+ monocyte (P = .0015), classical monocyte (P = .0008), and NK cell (P = .0051) population percentages with only a decrease in the B-cell (P = .01) population percentage.

Comparisons of levels of different subsets of circulating myeloid and lymphoid cells between HDM, patients with BPH, and patients with PCa. Peripheral blood from 99 HDM, 123 patients with BPH, and 156 patients with PCa were stained for myeloid and lymphoid cell markers. Scatter plots show the median of calculated percentages of live cells from each population with interquartile ranges of (A) eMDSCs, (B) PMN-MDSCs, (C) M-MDSCs, (D) CD16‒PMN, (E) CD14+ monocytes, (F) classical monocytes, (G) nonclassical monocytes, (H) CD3+ lymphocytes, (I) T cells, (J) CD4+ T cells, (K) CD8+ T cells, (L) natural killer T (NKT) cells, (M) CD4+ NKT cells, (N) CD8+ NKT cells, (O) NK cells, and (P) B cells. (Q) ROC curves determined from calculated percentages of live cells from the 3 MDSC populations for all patients with PCa versus HDM. HDM n = 99, BPH n = 123, and PCa n = 156. BPH, benign prostatic hyperplasia; eMDSCs, early-stage MDSCs; HDM, male healthy donors; MDSCs, myeloid-derived suppressor cells; M-MDSCs, monocytic MDSCs; PCa, prostate cancer; PMN, polymorphonuclear.
Given that MDSC populations have been shown to be present in higher numbers in patients with cancer, we wanted to determine whether their gated counts could be used as an effective tool for detecting PCa.21-24 The AUCs using the gated population percentage of live cells for eMDSCs, PMN-MDSCs, and M-MDSCs between HDM and patients with PCa were found to be 0.6791 (95% confidence interval [CI]: 0.6109-0.7472), 0.5178 (95% CI: 0.4457-0.5900), and 0.5473 (95% CI: 0.4745-0.6201), respectively (Figure 1Q). The AUCs for all other measured populations based on gated percentage of live cells were determined, and CD14+ monocytes, CD16− PMN, CD3+ lymphocytes, CD3+ T cells, CD4+ T cells, NKT cells, CD4+ NKT cells, CD8+ NKT cells, NK cells, and B cells were found to have AUCs greater than 0.6—all values greater than what was found for the PMN-MDSC and M-MDSC populations (Supplementary Table S3).
Several studies have indicated that as the tumor progresses there is an increase of MDSCs found in circulation.21-24 On grouping patients with PCa by Gleason scores, we generally did not observe this with the only exception being between Gleason score 6 (G6) and Gleason score 7 (G7) for PMN-MDSCs (Figure 2). More interestingly, there was a trend for M-MDSC levels to decrease with tumor progression, and unexpectedly, patients with BPH had a higher median level of M-MDSCs than patients with PCa albeit not statistically significant. There also seemed to be more trends observed within the other myeloid and lymphoid cell populations than within the MDSCs themselves. These differences can be better visualized when the calculated median population values for each cell type from BPH, G6 PCa, G7(3 + 4) PCa, G7(4 + 3) PCa, and >G7 PCa patients are normalized to the respective HDM median population values (Figure 3A). Collectively, the myeloid cell populations showed an increase in levels compared with HDM for all patient groups; on the contrary, lymphoid cell populations overall showed decreasing levels as prostate pathologies progressed. Exceptions to this were the nonclassical monocyte and NK cell populations. When the PCa patient populations are normalized to the patients with BPH, these differences become less clear and generally trend downward as Gleason score increases (Figure 3B). Furthermore, when the AUCs were calculated based on Gleason score grouping for each MDSC population, only the eMDSC population achieved AUC values greater than 0.6 for all Gleason scores (Gleason 6 AUC = 0.6927, 95% CI: 0.6069-0.7763; Gleason 7 AUC = 0.6552, 95% CI: 0.5713-0.7390; Gleason >7 AUC = 0.7074, 95% CI: 0.6091-0.8057) (Supplementary Figure S3). In addition, when the AUCs for the MDSC populations were calculated for comparing patients with PCa to patients with BPH, all AUC values were found to be within 0.5 to 0.6 except for M-MDSCs (AUC = 0.6035; 95% CI: 0.5352-0.6717) and CD4+ NKT cells (AUC = 0.6332; 95% CI: 0.5681-0.6982) (Supplementary Table S4). Overall, these AUCs and data as a whole demonstrate a rather weak potential for using individual gated cell counts as a viable diagnostic tool for PCa detection from healthy males or patients with BPH.

Comparisons of levels of different subsets of circulating myeloid and lymphoid cells between HDM, patients with BPH, and patients with PCa. Peripheral blood from 99 HDM, 123 BPH, 59 Gleason 6 (G6) PCa, 68 Gleason 7 (G7) PCa, and 29 >Gleason 7 (>G7) PCa patients were stained for myeloid and lymphoid markers. Scatter plots show the median of calculated percentages with interquartile ranges of (A) eMDSCs, (B) PMN-MDSCs, (C) M-MDSCs, (D) CD16‒PMN, (E) CD14+ monocytes, (F) classical monocytes, (G) nonclassical monocytes, (H) CD3+ lymphocytes, (I) T cells, (J) CD4+T cells, (K) CD8+T cells, (L) natural killer T (NKT) cells, (M) CD4+NKT cells, (N) CD8+NKT cells, (O) NK cells, and (P) B cells. BPH, benign prostatic hyperplasia; eMDSCs, early-stage MDSCs; HDM, male healthy donors; MDSCs, myeloid-derived suppressor cells; M-MDSCs, monocytic MDSCs; PCa, prostate cancer; PMN, polymorphonuclear.
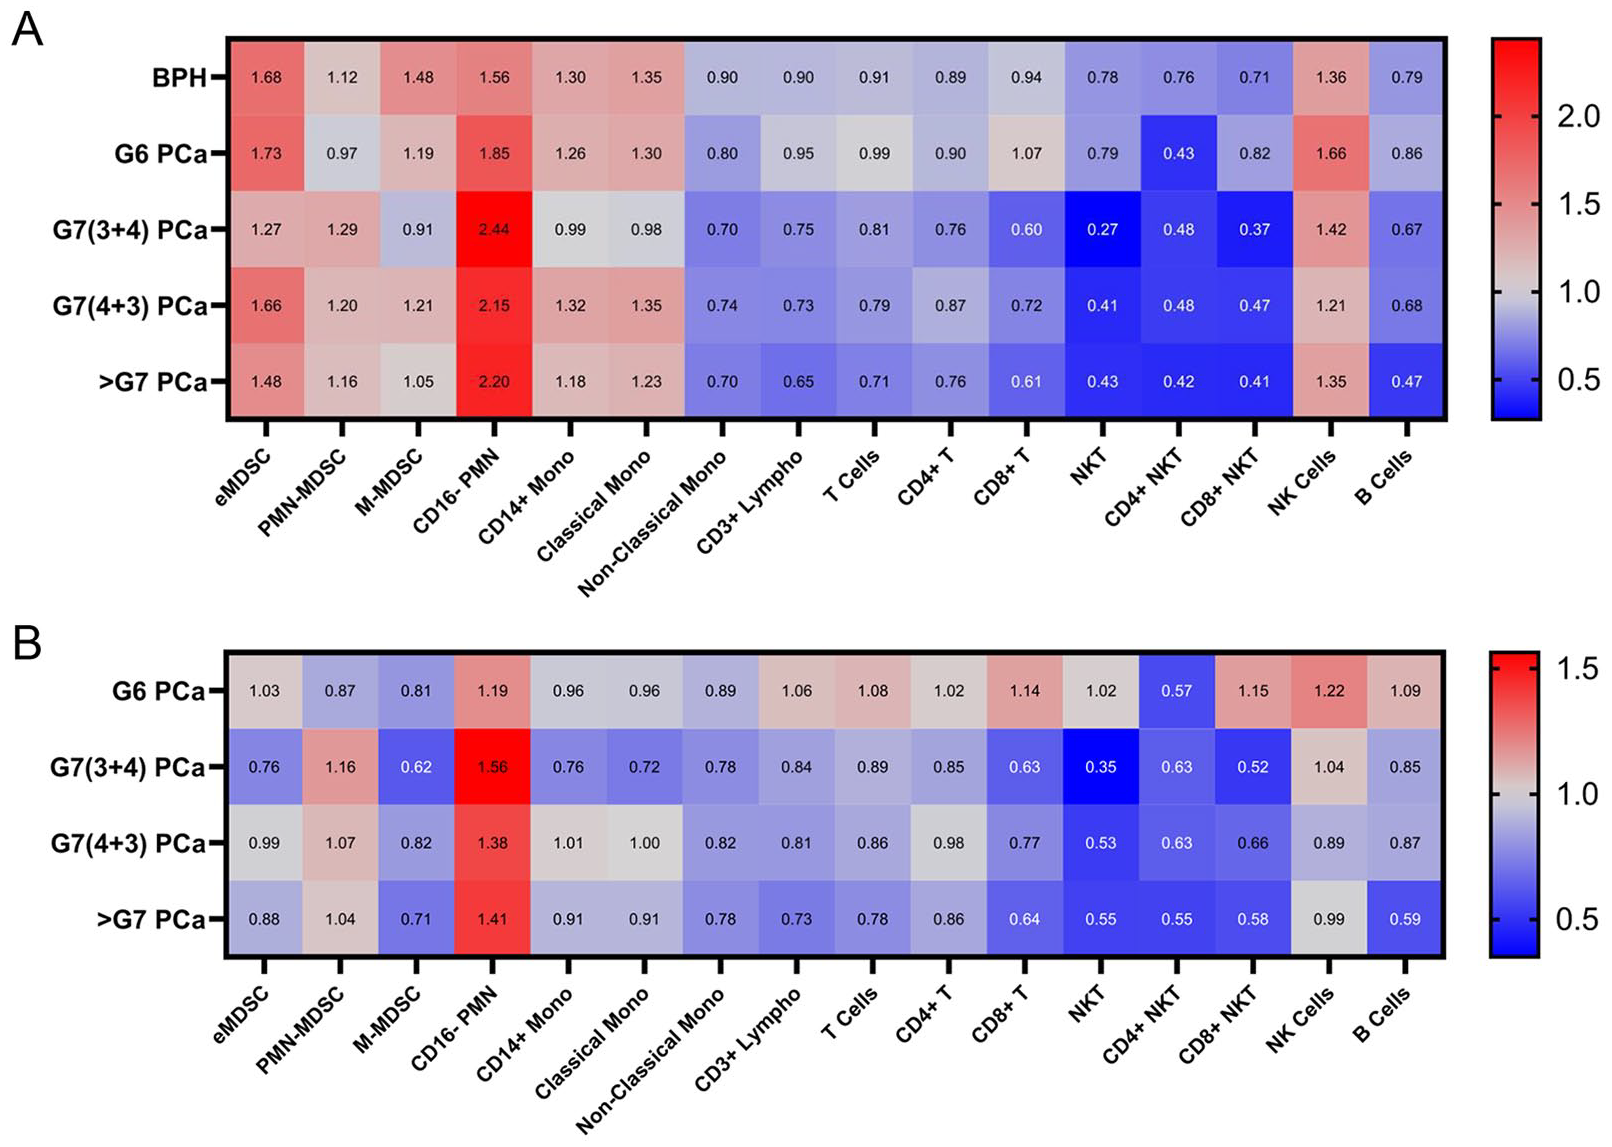
Heat map of the normalized median percentages for all myeloid and lymphoid cell populations. The numbers in the heat map represent the normalized percentage values to either HDM or patients with BPH. Increases in value are shaded in red and decreases in value are shaded in blue. (A) Median percentage values of all cell populations from BPH, G6 PCa, G7(3 + 4) PCa, G7(4 + 3) PCa, and >G7 PCa patients normalized to their respective HDM cell population value. (B) Median percentage values of all cell populations from G6 PCa, G7(3 + 4) PCa, G7(4 + 3) PCa, and >G7 PCa patients normalized to their respective BPH cell population value. BPH, benign prostatic hyperplaisa; PCa, prostate cancer; HDM, male healthy donors; G6, Gleason score 6; G7(3 + 4), Gleason score 7 (primary Gleason score 3 + secondary Gleason score 4) PCa; G7 (4 + 3), Gleason score 7(primary Gleason score 4 + secondary Gleason score 3) PCa; >G7, Gleason score >7.
Using ML models to classify PCa from manually gated counts
Because the individual gated cell counts failed to demonstrate adequate diagnostic potential, we evaluated all of the manually gated cell population counts using conventional ML models allowing us to incorporate all cell populations together rather than focusing on specific populations of interest, such as MDSCs. There are many choices of learning models to use in supervised ML when the task is inferring a classification function from labeled training data. Here, we chose 5 common ML algorithms: a shallow ANN, a linear SVM, an SVM with a Gaussian kernel, an SVM with a RBF kernel, and an SVM with a polynomial kernel. To evaluate these models, we designed two different data sets that mimic clinically relevant diagnostic tests: a PCa screening test and a prostate biopsy confirmatory test.
First, we wanted to determine the accuracies of each model when evaluated as a PCa screening test. The two classes for the labeled training data and prediction were HDM and patients with PCa of all Gleason scores. For training, 67 HDM and 97 patients with PCa were used followed by 32 HDM and 54 patients with PCa for testing and performance evaluation. Using the gated counts as input data to these five ML models, the models had accuracies between 72.8% and 73.3% with an overall average accuracy of 73.2% (Supplementary Table S5). These accuracies are higher than any accuracies based on ROC analysis of the individually manually gated cell counts for each cell population of interest.
Next, we wanted to determine the accuracies for each model when evaluated as a prostate biopsy confirmatory test. Here, the classes for the labeled training data and prediction were stratified based on disease state and predicting high-risk PCa or the need for medical intervention. Patients with a Gleason score of 6 are considered to have clinically insignificant disease, whereas patients with a Gleason score of 7 or higher are considered to have clinically significant diseases that may require subsequent medical intervention. Patients with BPH and a Gleason score 6 PCa (BPH/G6) were grouped together into a first class, whereas all patients with a Gleason score of 7 or higher (⩾G7) PCa were grouped together into a second class. For training, 41 BPH/G6 (30 BPH; 11 G6) patients and 43 ⩾G7 PCa patients were used, whereas 72 BPH/G6 (61 BPH; 11 G6) and 53 ⩾G7 PCa patients were used for testing and performance evaluation. All five models resulted in accuracies between 55.4% and 57.8% using gated counts (Supplementary Table S5). As with the manual gating, these models have their limitations and still rely on operator experience for the manual gating analysis. These results had us ask how we retain this information in a way that does not introduce operator subjectivity (ie, does not involve manual gating) and reduces preprocessing time while still incorporating all of the collected events and numerous relationships. This led us to develop a new method of processing flow cytometry data to be used in ML algorithms, specifically ANNs, in a way that minimized subjectivity while using all available information found within the FCS data file.
Using PRNNs to analyze flow cytometry data
Pattern recognition neural networks (PRNNs) are a type of ANN that are well adapted in pattern recognition and classification. Typically, they take the form of multiple densely connected layers of artificial neurons, wherein the strength of each interconnection between neurons is weighted by the amount “learned” during the initial network training. For ANNs to be effective, data inputs must share a common feature across all data sets. In imaging applications of ANNs, this common feature is typically a pixel (for 2D images) or a voxel (for 3D images) and have been used for diagnosing cancer from pathology slides and computed tomographic images.25-28 Conceptually, for flow cytometry data, no such thing exists; rather, there is only a common feature, ie, fluorescence and scatter channel values, across all cells within a single sample itself and not between each separate sample. To address this, we developed an approach called “hypervoxelation of cytometry events” (HyperVOX) to transform flow cytometry data into a useable data format to be used with PRNNs as described in the “Methods” section. Briefly, this method is based on converting unique event channel values into a common feature space that can serve as inputs for ML algorithms. We partitioned each parameter range into 4 distinct regions of interest (ROIs) and enumerated the number of events that fell within each specific ROI. When all parameter ranges are combined, we call the resulting multidimensional ROIs “hypervoxels”—each with a unique address in the newly created multidimensional space that each have their own hypervoxel counts; this is akin to pixels or voxels found in digital images (Supplementary Figure S4). These hypervoxel counts then served as the inputs into the ML algorithm. This generated 262 144 hypervoxels for the 9-parameter myeloid cell panel and 16 384 hypervoxels for the 7-parameter lymphoid cell panel. To reduce computational time, a known limitation, we removed all hypervoxel regions that were found to have no (null) cell events. This reduced the number of hypervoxels for the myeloid cell and lymphoid cell panels to 36 720 and 8071, respectively.
ANNs are notorious for requiring large training sets for robust and efficient classifications. 29 Given the difficulty and costs for generating large data sets from patient samples in clinical studies, we implemented an augmentation algorithm to increase our effective training set sample size by a factor of 20. Briefly, for each sample, 50 000 events were selected at random 20 times to generate a set of 20 different, but related, sibling samples; this process also ensured that the same number events were used for each sample to eliminate any potential bias that could be dependent event counts. We subsequently trained 500 PRNNs using the assembled data sets as described in the “Methods” section. For the PCa screening test training data set, data from 50 HDM and 50 patients with PCa (10 G6, 30 G7, and 10 ⩾G8) were used for PRNN training with 80% used for the training data set and the remaining 20% used for the validation data set. Samples from 17 HDM and 47 PCa (20 G6, 19 G7, and 8 ⩾ G8) patients were used to construct the PRNN evaluation testing group. Here, the top 3 networks for highest accuracy were selected and used for the 3-network voting ensemble. Following this, all the samples used for network training, validation, and evaluation are used for threshold calibration. Each of the 3 networks are optimized with one selected for sensitivity, one selected for specificity, and one for accuracy. Finally, a holdout sample data set with 32 HDM and 59 PCa patient samples were used to evaluate the classifier performance. The NN classified 28 out of 32 HDM and 57 out of 59 PCa samples correctly resulting in a sensitivity of 96.6% (95% CI: 88.3-99.6), specificity of 87.5% (95% CI: 71.0-96.5), PPV of 93.4% (95% CI: 85.1-98.2), and NPV of 93.3% (95% CI: 78.1-98.2) (Table 2). On Gleason score stratification, the NN classified 27 out of 28 G6, 18 out of 19 G7, and 11 out of 11 >G7 samples were classified correctly (Figure 4A). The ROC curve analysis produced an AUC of 0.9656 (95% CI: 0.9202-1) (Figure 4B). We also used this same training algorithm for the prostate biopsy confirmatory testing set. Here, samples from 50 BPH/G6 (25 BPH and 25 G6) and 50 >G6 PCa (36 G7 and 14 ⩾G8) patients were used for the training set and 22 BPH/G6 (11 BPH and 11 G6) and 22 >G6 PCa (13 G7 and 9 ⩾G8) patients were used for the evaluation testing set. The holdout sample data set consisted of 110 BPH/G6 PCa (87 BPH; 23 G6) patients and 25 >G6 PCa (19 G7 and 6 ⩾G8) patients. The NN classified 47 out of 110 BPH/G6 and 23 out of 25 >G6 samples correctly resulting in a sensitivity of 92.0% (95% CI: 74.0-99.0), specificity of 42.7% (95% CI: 33.3-52.5), PPV of 26.7% (95% CI: 23.0-30.8), and NPV of 95.9% (95% CI: 85.9-98.9) (Table 2). The NN classified 38 out of 87 BPH, 9 out of 23 G6, 17 out of 19 G7, and 6 out of 6 >G7 samples correctly (Figure 4C). The subsequent ROC analysis produced an AUC of 0.7242 (95% CI: 0.6259-0.8225) (Figure 4D). Given the number of men who undergo prostate biopsies each year, these data suggest a potential utility for this assay to have a great impact on the reducing the number of men who undergo unnecessary prostate biopsies each year.
Sensitivity and specificity results for prostate cancer screening and prostate biopsy confirmatory tests using a neural network to analyze hypervoxelated flow cytometry data.
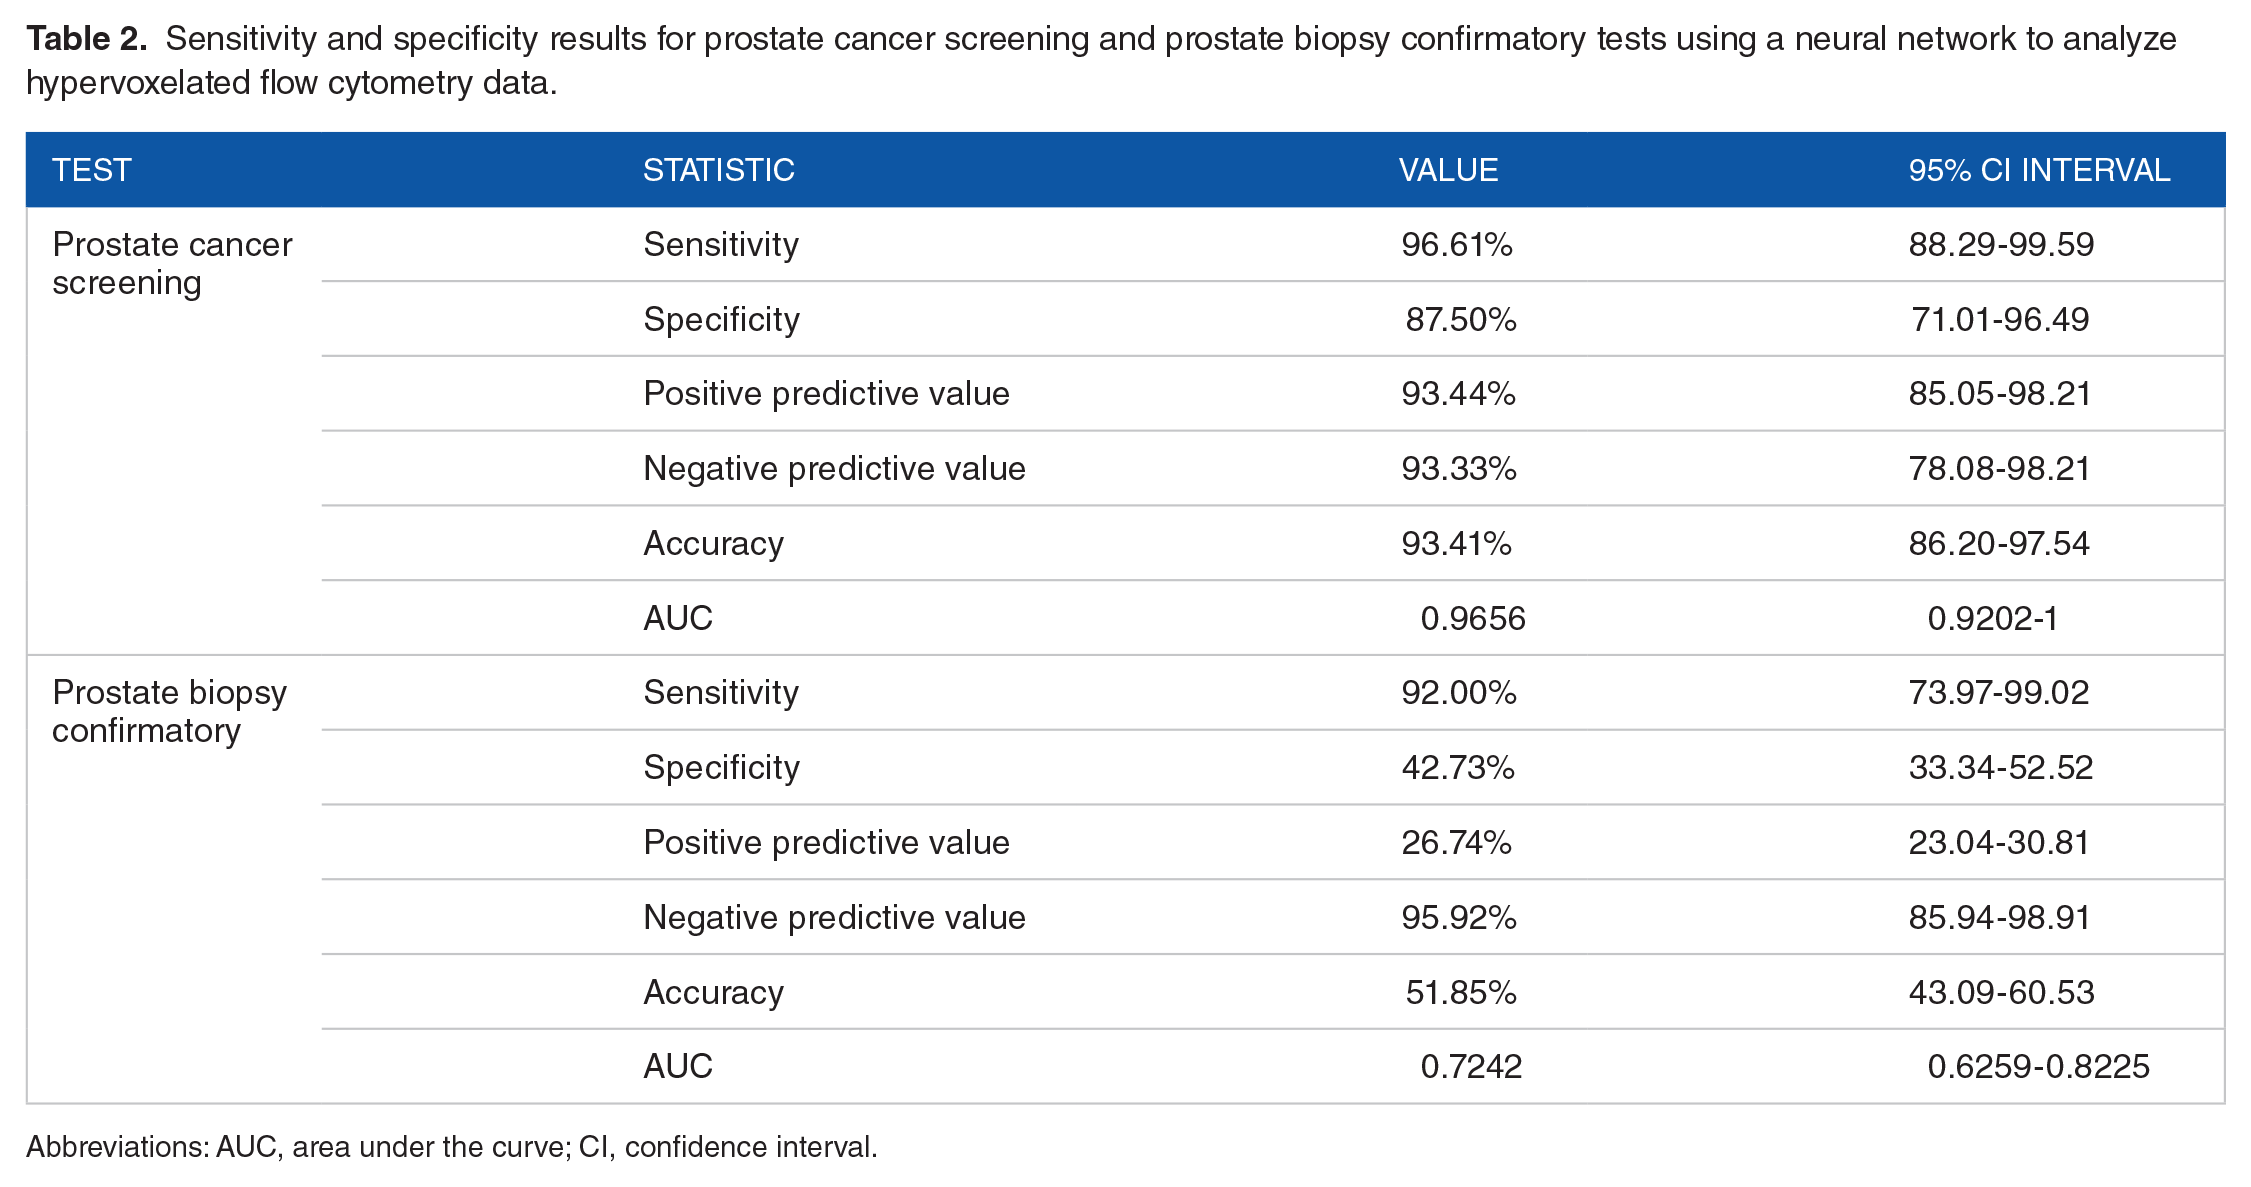
Abbreviations: AUC, area under the curve; CI, confidence interval.

Neural network analysis of hypervoxelated flow cytometry data of hold out samples for patients with PCa versus HDM and PCa versus BPH. (A) Percentages of correctly classified samples from HDM (n = 32), G6 PCa (n = 29), G7(3 + 4) PCa (n = 10), G7(4 + 3) PCa (n = 9), G8 PCa (n = 4) and G9 PCa (n = 7) and (B) ROC curve for NN analysis for holdout samples of patients with PCa versus HDM. (C) Percentages of correctly classified samples from BPH (n = 87), G6 PCa (n = 23), G7(3 + 4) PCa (n = 2), G7(4 + 3) PCa (n = 17), G8 PCa (n = 2) and G9 PCa (n = 4) and (D) ROC curve for NN analysis for holdout samples of patients with PCa versus BPH. G6, Gleason score 6 PCa; G7 (3 + 4), Gleason score 7 (primary Gleason score 3 + secondary Gleason score 4) PCa; G7(4 + 3), Gleason score 7 (primary Gleason score 4 + secondary Gleason score 3) PCa; G8, Gleason score 8 PCa; G9, Gleason score 9 PCa. BPH, benign prostatic hyperplasia; HDM, male healthy donors; NN, neural network; PCa, prostate cancer; ROC, receiver operating characteristic.
Discussion
There is a clinical need for the development of new methodologies to more accurately detect PCa due to the limitations of current methods, such as the PSA blood test. As PSA is organ-specific and not disease-specific, it is common to see men with elevated PSA values undergo a prostate biopsy with as much as 70% of those men having no prostate malignancy.30,31 Recent developments in liquid biopsy technologies have enabled improvements in early detection, prediction of prognosis, and monitoring of disease progression, relapse, and treatment responses for a variety of cancer types. 32 While most of these methods primarily use extracellular factors, such ctDNA, EVs, or CTCs, none have used flow cytometry–based immunophenotyping analyzed by ANNs to detect a solid tumor.
In recent years, there have been significant advances in the field of flow and mass cytometry that have made it possible to measure up to 40 different intracellular and extracellular markers from each cell within a single sample preparation. These advancements have led to an expanding array of computational tools that aid in the interpretation and visualization of this high-dimensional and complex cytometry data; numerous techniques, such as Spanning-tree Progression Analysis of Density-normalized Events (SPADE); t-distributed stochastic neighbor embedding (t-SNE); cluster identification, characterization, and regression (CITRUS); and PhenoGraph, have been developed using advanced computational methods to try and minimize the pitfalls of standard manual gating analyses while encouraging discovery and improving efficiency.33,34 However, these techniques have yet to be incorporated effectively into clinical practice.
In this article, we present the basis for a new liquid biopsy technique using the flow cytometry immunophenotyping of myeloid and lymphoid cell populations analyzed using PRNNs. Specifically, we describe two relevant data sets to determine the sensitivity and specificity of using this new method for PCa screening and prostate biopsy confirmatory testing. In most clinical studies, manually gated cell population percentages or counts are used to determine whether specific cell populations could be used as potential diagnostic biomarkers. One population that has received significant attention over the past decade as a potential biomarker is MDSCs. Several studies using flow cytometry have demonstrated that MDSC accumulation correlates to disease progression and can be indicative of overall patient outcomes while being found at lower levels in non–tumor-bearing individuals.21-24 In addition, studies have shown that levels of MDSCs can possibly predict responses to immune-checkpoint blockade therapy.35,36
Although MDSCs have been favored as a potential diagnostic biomarker for cancer detection, our data set demonstrates that MDSCs have limited utility as a viable diagnostic tool when only analyzed using manual gating. In fact, several other cell types had better potential with greater AUCs than the three MDSC populations in both data sets (Supplementary Tables S3 and S4). This led us to use ML models, including ANNs, to incorporate all manually gated cell population percentages together into a final predictor. The results did improve, but inherently, manual gating excludes large amounts of information through its Boolean logic hierarchy and does not adequately capture the holistic relationship between all the cell markers at once. Using our HyperVOX method, we were able to transform the original flow cytometry data set into one that can preserve some of these complex and vital relationships while mitigating the loss of information.
Machine learning has been used in medical diagnostics for detecting skin abnormalities with image recognition and in cardiology by helping to analyze electrocardiograms to better detect cardiovascular events.37-41 When we used PRNN analysis on our screening data set, the signal between healthy male individuals and biopsy-confirmed patients with PCa had a large separation (AUC = 0.9656). Most of the cancers (n = 57/59; sensitivity = 98.3%) were classified correctly with only 2 misclassified—one Gleason score 6 PCa and one Gleason score 7 PCa—while correctly classifying all men with Gleason score 8 or higher PCa disease (n = 11). Currently, the traditional cutoff PSA value of 4 ng/mL results in a 75% sensitivity for PCa detection with only a 40% specificity. 42 Using our method, we far outperform this traditional use of the PSA test with sensitivities and specificities of 96.6% and 87.5%, respectively, demonstrating potential utility for this type of test in the clinic, but further study is needed.
The prostate biopsy confirmatory data set was designed to classify patients that would be at lower risk for a prostate pathology not requiring immediate medical intervention, such as BPH or indolent disease (Gleason score 6 PCa), from those that would, such as Gleason score 7 PCa or higher. There are many prostate biopsies performed each year in the United States with the majority occurring after a PSA test has been conducted; a large proportion of these biopsies return benign findings or Gleason score 6 PCa where medical intervention would not be necessarily recommended. Using the PRNN, there was a meaningful albeit less dramatic separation between the BPH/G6 and higher Gleason score cancers (AUC = 0.7242). This decrease in performance is most likely due to more similarities in the signal between BPH and PCa—both prostate pathologies—than between a healthy male and PCa (Figure 3). We expected the presence of the precancerous atypical small acinar proliferation (ASAP) and high-grade prostatic intraepithelial neoplasia (HGPIN) pathologies to increase the likelihood of a patient with BPH to be classified as PCa. Interestingly, it was found to not have an impact as out of the 49 patients with BPH misclassified, only 8 were positive for HGPIN, 6 for ASAP, and 5 for both. More data will be needed to fully understand the relationship of these precancerous pathologies and their resulting signal.
Conclusions
We have presented data to support a novel liquid biopsy test to detect PCa in a pre-biopsy population. Although our screening data set was able to achieve high levels of sensitivity (97%) and specificity (88%), the more clinically relevant problem of how to reduce the number of unnecessary prostate biopsies was more difficult to investigate. Currently, there are no screening tools that can differentiate between PCa and a benign prostate condition but given the large number of men who undergo prostate biopsies each year in the United States, this study demonstrates potential utility for our method to still have a substantial impact on reducing the number men who unnecessarily receive them each year while ensuring those that need biopsies still receive one (92% sensitivity). A second study is currently underway where more cell surface markers are being included to improve upon the separation between PCa and BPH, along with the use a cell-fixative blood collection tube to enhance sample stability and marker expression during transport. We hope in the near future to determine whether this type of assay will provide clinicians with an additional tool to use when deciding the best clinical pathway for their patient through a clinical validation and utility study.
Supplemental Material
New_folder – Supplemental material for Detecting Prostate Cancer Using Pattern Recognition Neural Networks With Flow Cytometry-Based Immunophenotyping in At-Risk Men
Supplemental material, New_folder for Detecting Prostate Cancer Using Pattern Recognition Neural Networks With Flow Cytometry-Based Immunophenotyping in At-Risk Men by George A Dominguez, Alexander T Polo, John Roop, Anthony J Campisi, Robert A Somer, Adam D Perzin, Dmitry I Gabrilovich and Amit Kumar in Biomarker Insights
Footnotes
Acknowledgements
The authors wish to thank all study participants and staff at each clinical site.
Funding:
The author(s) disclosed receipt of the following financial support for the research, authorship, and/or publication of this article: The study was funded entirely by Anixa Biosciences, Inc.
Declaration of Conflicting Interests:
The author(s) declared the following potential conflicts of interest with respect to the research, authorship, and/or publication of this article: G.A.D., A.T.P*, J.R., A.J.C., and A.K. are employees (or former employees*) of Anixa Diagnostics Corp. and have ownership (including patents) interests.
Author Contributions
GAD, JR, AJC, and AK contributed to conception and design, and development of methodology; GAD, ATP, RAS, ADP, and DIG contributed to acquisition of data (acquired samples and managed patients, acquired and managed flow cytometry data, provided facilities, etc); GAD, JR, AJC, and ATP contributed to analysis and interpretation of data (eg, statistical analysis, computational analysis, flow cytometry analysis); GAD, ATP, JR, AJC, RAS, ADP, DIG, and AK contributed to writing, review, and/or revision of the manuscript; GAD, JR, and AJC contributed to administrative, technical, or material support (ie, reporting or organizing data, constructing database). Study supervision: AK.
Data Availability
Please contact corresponding author for available data.
Supplemental Material
Supplemental material for this article is available online.
References
Supplementary Material
Please find the following supplemental material available below.
For Open Access articles published under a Creative Commons License, all supplemental material carries the same license as the article it is associated with.
For non-Open Access articles published, all supplemental material carries a non-exclusive license, and permission requests for re-use of supplemental material or any part of supplemental material shall be sent directly to the copyright owner as specified in the copyright notice associated with the article.