
Abstract
Objectives:
The aim of this study is to investigate the role of epithelial cell transforming sequence 2 (ECT2) as a pan-cancer biomarker and to assess its potential as an immune-related target for cancer immunotherapy.
Methods:
We conducted a comprehensive analysis of ECT2 expression across 44 tumor types using large-scale transcriptomic datasets from The Cancer Genome Atlas (TCGA) and the Genotype-Tissue Expression (GTEx) project. Pan-cancer Cox regression analyses were performed to evaluate the correlation between ECT2 expression and patient survival outcomes. Functional assays, including ECT2 knockdown via shRNA in the HepG2 hepatocellular carcinoma (HCC) cell line, were employed to investigate its mechanistic role. Transcriptomic profiling and pathway analyses were also conducted to explore the impact of ECT2 on cell proliferation and the tumor immune microenvironment.
Results:
ECT2 was found to be significantly upregulated in 31 tumor types. Elevated ECT2 expression was consistently associated with worse overall survival (OS), disease-specific survival (DSS), disease-free interval (DFI), and progression-free interval (PFI) across multiple cancer subtypes. Functional assays revealed that ECT2 knockdown significantly reduced HepG2 cell viability and impaired cell cycle progression, with downregulation of Cyclin D1. Transcriptomic analysis of ECT2-depleted cells indicated enriched gene sets related to cell proliferation and mitotic regulation. Additionally, ECT2 expression was significantly correlated with immune features, including immune cell infiltration, immune checkpoint gene expression, tumor mutational burden (TMB), and microsatellite instability (MSI).
Conclusion:
ECT2 is identified as a potential pan-cancer prognostic biomarker with dual roles in tumor initiation and progression, as well as in modulating the tumor immune microenvironment. Our findings suggest that ECT2 may serve as a promising therapeutic target in cancer immunotherapy, warranting further investigation into its immune-regulatory and oncogenic functions.
Background
Human carcinogenesis is a complex, multistep process driven by the dysregulation of essential cellular programs. Aberrant activation of proto-oncogenes, inactivation of tumor suppressor genes, and disruption of genomic stability collectively promote uncontrolled proliferation, impaired differentiation, and malignant transformation.1 -4 Increasing evidence highlights the dynamic interplay between genetic and epigenetic alterations in cancer: genetic mutations reshape epigenetic landscapes, whereas epigenetic deregulation can induce genomic instability and mutational events.5 -7 Pan-cancer research has emerged as a powerful approach to delineate shared oncogenic mechanisms across malignancies by integrating large-scale multi-omics datasets. Such analyses not only uncover universal drivers of tumorigenesis but also identify novel biomarkers and therapeutic vulnerabilities, thereby accelerating advances in cancer diagnosis, treatment, and prevention.8 -10 Recent studies exemplify this paradigm: PLIN3 has been identified as a potential pan-cancer immune biomarker and oncogene, particularly in lung adenocarcinoma. 11 EPHB2 shows strong correlations with M2 macrophage infiltration across cancers, implicating it as a prognostic and therapeutic target in immune modulation, 12 and disulfidptosis-related genes (DRGs) have been used to construct a Disulfidptosis-Related Signature (DFRS), which carries prognostic value, reflects tumor immune microenvironment characteristics, and predicts immunotherapy responsiveness. 13 Together, these findings highlight an urgent need to identify novel regulators and clinically actionable biomarkers to advance precision oncology.14,15
The ECT2 gene, located on chromosome 3q26—a locus frequently altered in human cancers—encodes an 883–amino acid protein with a predicted molecular mass of ~104 kDa.16,17 Overexpression of ECT2, largely driven by tumor-specific gene amplification, has been documented across a broad spectrum of malignancies, with especially high levels reported in tumors of the brain, lung, bladder, esophagus, liver, colon, breast, pancreas, and ovary.18 -24 Accumulating evidence identifies ECT2 as a pivotal oncogenic regulator, with established roles in cell-cycle progression and proliferation, and emerging relevance in the pathogenesis of brain cancers. Yet, the broader tumorigenic functions of ECT2 across cancer types remain incompletely understood. In particular, the mechanisms by which ECT2 may influence immune regulation within the tumor microenvironment—and the implications for therapeutic response—are poorly defined. Addressing these gaps through a systematic pan-cancer investigation is thus both scientifically compelling and clinically urgent.
This study presents the first comprehensive pan-cancer analysis of ECT2, integrating multi-omics datasets from The Cancer Genome Atlas (TCGA) and the Gene Expression Omnibus (GEO). Through an integrative framework, we systematically interrogated diverse molecular dimensions, including transcriptional regulation, prognostic relevance, epigenetic alterations (with an emphasis on DNA methylation), genomic aberrations, post-translational modifications (particularly phosphorylation), features of the tumor immune microenvironment, and associated signaling networks. By leveraging this multidimensional approach, our analysis seeks to define the mechanistic roles of ECT2 in tumorigenesis and to clarify its clinical significance across a broad spectrum of human malignancies.
Materials and Methods
ECT2 Expression Pattern in Human Pan-Cancer
PROTTER (v1.0; https://wlab.ethz.ch/protter/start/) is an interactive web-based platform for the integrative visualization of protein sequence annotations. It enables the mapping of diverse protein features—including sequence annotations, predicted functional domains, peptide sequences, and post-translational modifications (PTMs)—onto the topological representation of transmembrane proteins, with customizable parameters for spatial and structural analysis. 25 GeneCards (https://www.genecards.org/) provides a comprehensive, searchable repository of annotated and predicted human genes, consolidating genomic data into an accessible interface for both research and clinical applications. 26 The Human Protein Atlas (HPA; https://www.proteinatlas.org/) integrates multiple omics technologies, including antibody-based imaging, mass spectrometry-based proteomics, transcriptomics, and systems biology, to systematically map the expression and localization of human proteins across tissues, cells, and organs.27,28 A unified and standardized pan-cancer dataset was obtained from the UCSC Xena platform (https://xenabrowser.net/) : TCGA TARGET GTEx (PANCAN, N = 19 131, G = 60 499). Gene expression data for ENSG00000114346 (ECT2) were extracted across all available samples. Sample types included solid tissue normal, primary solid tumor, primary tumor, normal tissue, primary blood-derived cancer–bone marrow, and primary blood-derived cancer–peripheral blood. Expression values were normalized using log2(x+0.001) transformation. Cancer types with fewer than three samples were excluded, yielding data from 34 cancer types. Differential expression between normal and tumor samples was computed using R software (v3.6.4), with statistical significance assessed via unpaired Wilcoxon rank-sum and signed-rank tests.
Prognostic Analysis
We obtained a unified, standardized pan-cancer dataset from the UCSC Xena platform (https://xenabrowser.net/): TCGA TARGET GTEx (PANCAN, N = 19 131, G = 60 499). Gene expression profiles for ENSG00000114346 (ECT2) were extracted across all available samples. Sample types included primary peripheral blood–derived cancers, primary tumors, metastatic samples from TCGA-SKCM, primary bone marrow–derived cancers, solid tumor–derived primary samples, and recurrent bone marrow–derived cancers. In addition, a curated TCGA prognostic dataset from a previously published study in Cell 29 was integrated, together with TARGET follow-up data retrieved from the UCSC Cancer Browser (https://xenabrowser.net/datapages/). Samples with follow-up durations shorter than 30 days were excluded. Expression values were normalized using log2(x+0.001) transformation, and cancer types with fewer than 10 samples were removed from the analysis. Following this stringent filtering, survival datasets were available for 44 cancer types (overall survival), 38 cancer types (disease-specific survival), 32 cancer types (disease-free interval), and 38 cancer types (progression-free interval). Prognostic associations between ECT2 expression and patient outcomes were evaluated using Cox proportional hazards regression models, implemented with the coxph function in the R survival package (v3.2-7). 30 Statistical significance was determined using the log-rank test, ensuring robust prognostic assessment.
Clinical Stages
We retrieved a standardized pan-cancer dataset from the UCSC Xena platform (https://xenabrowser.net/): TCGA Pan-Cancer (PANCAN, N = 10 535, G = 60 499). Gene expression profiles for ENSG00000114346 (ECT2) were extracted across all available samples. To ensure consistency, only primary tumor and primary peripheral blood–derived cancer samples were retained. Expression values were normalized using log2(x+0.001) transformation, and cancer types with fewer than 3 samples were excluded, yielding expression data for 37 distinct tumor types. Statistical analyses were conducted in R (v3.6.4). Expression differences between tumor stages were assessed using the unpaired Student’s t-test for pairwise comparisons, and analysis of variance (ANOVA) was applied for multi-group comparisons.
Pan-Cancer Analysis of the Correlation of the ECT2 Expression With Tumor Cell Infiltration and Immune Modulator Genes
We obtained a standardized pan-cancer dataset from the UCSC Xena platform and extracted gene expression profiles for ENSG00000114346 (ECT2), together with 60 marker genes representing 2 immune checkpoint pathways and 150 marker genes corresponding to 5 immune-related pathways. Only primary tumor samples—including primary solid tumors, bone marrow–derived cancers, and peripheral blood–derived cancers—were retained, while all normal tissues were excluded. Expression values were normalized using log2(x+0.001) transformation. Pearson correlation analyses were then performed between ECT2 expression and the marker genes of the 5 immune pathways to assess potential associations.
Pan-Cancer Analysis of the Relationship Between the ECT2 Gene Expression and TMB, MSI, Tumor Stemness Scores
We downloaded a unified and standardized pan-cancer dataset from the UCSC Xena database and extracted gene expression profiles for ENSG00000114346 (ECT2) across all available samples. Only primary tumor and primary blood–derived cancer (peripheral blood) samples were retained for analysis. In parallel, somatic mutation data were retrieved from the Genomic Data Commons (GDC; https://portal.gdc.cancer.gov/), specifically the level-4 Simple Nucleotide Variation dataset of all TCGA samples processed with the MuTect2 algorithm. 31 Tumor mutational burden (TMB) for each sample was computed using the maftools R package (version 2.8.05). Microsatellite instability (MSI) scores for individual tumors were obtained from previously published studies. 32 TMB, MSI, and gene expression data were subsequently integrated, with expression values normalized by log2(x+0.001) transformation. Cancer types with fewer than 3 samples were excluded, yielding expression data for 37 distinct tumor types. To further evaluate tumor stemness, stemness indices derived from DNA methylation–based signatures were retrieved from published datasets. 33 These stemness scores were integrated with ECT2 expression data, and values were normalized using log2(x+0.001) transformation. Consistent with the previous filtering criteria, cancer types represented by fewer than 3 samples were removed, resulting in final datasets encompassing 37 cancer types.
RNA Modification Gene Analysis
We retrieved the unified and standardized pan-cancer dataset from the UCSC Xena database and extracted gene expression data for ENSG00000114346 (ECT2) together with marker genes representing 3 major types of RNA modifications: N¹-methyladenosine (m¹A), 5-methylcytosine (m⁵C), and N⁶-methyladenosine (m⁶A). The dataset was further curated to include only samples derived from primary solid tumors, primary tumors, primary blood–derived cancers of the bone marrow, and primary blood–derived cancers of the peripheral blood, while all normal tissue samples were excluded. Expression values were normalized using log2(x+0.001) transformation. Subsequently, Pearson correlation coefficients were calculated to assess the association between ECT2 expression and RNA modification–related genes.
Differences in Tumor Microenvironment
We obtained a unified and standardized pan-cancer dataset from the UCSC Xena database and extracted gene expression data for ENSG00000114346 (ECT2) across all available samples. The dataset was carefully curated to include the following sample categories: primary blood-derived cancer–peripheral blood (TCGA-LAML), primary tumors, metastatic samples from TCGA-SKCM, primary blood-derived cancer–bone marrow, primary solid tumors, and recurrent blood-derived cancer–bone marrow. To ensure comparability, expression values were normalized using log2(x+0.001) transformation. For downstream analyses, gene expression profiles for each tumor type were extracted individually and mapped to their corresponding gene symbols. Immune cell infiltration across pan-cancer samples was quantified using 3 established computational algorithms implemented in the R package IOBR: xCell, 34 the quantiseq method 35 and the Timer method.36,37 Correlation analyses were subsequently performed to evaluate the association between ECT2 expression and the degree of immune cell infiltration across diverse cancer types.
Tumor-Immune System Interaction Database (TISIDB) and Tumor Immune Single Cell Hub Database (TISCH)
TISIDB is an integrative online resource that systematically characterizes tumor–immune system interactions. 38 In the present study, we employed TISIDB to evaluate ECT2 expression across 29 distinct tumor types, uncovering significant heterogeneity among immune subtypes, including C1 (wound healing), C2 (IFN-γ dominant), C3 (inflammatory), C4 (lymphocyte-depleted), and C6 (TGF-β dominant). Furthermore, the Tumor Immune Single-Cell Hub (TISCH; http://tisch.comp-genomics.org) provides a dedicated single-cell transcriptomic database designed to interrogate the complex cellular architecture and immune dynamics of the tumor microenvironment (TME). 39
Functional Enrichment and PPI Network Analysis
We applied the GPS-Prot algorithm (http://gpsprot.org/index.php) to construct and analyze the protein–protein interaction (PPI) network of ECT2. To extend this analysis, we utilized the LinkedOmics database (http://www.linkedomics.org/admin.php), a publicly accessible resource that integrates multi-omics data from 32 TCGA cancer types and 10 Clinical Proteomics Tumor Analysis Consortium (CPTAC) cohorts. Furthermore, we interrogated the General Repository of Biological Interaction Datasets (BioGRID; https://thebiogrid.org), a comprehensive and continuously updated repository that systematically curates and disseminates genetic and protein interaction data across a wide spectrum of human and model organism systems.40,41 The Protein Interaction Network Analysis (PINA) platform (https://omics.bjcancer.org/pina/) provides a comprehensive framework for the construction, filtering, analysis, visualization, and management of protein interaction networks. 42 GRNdb (Gene Regulatory Network database) offers an open-access and user-friendly resource for the exploration and visualization of predicted transcription factor (TF)-mediated regulatory networks.43,44 In addition, GSCA Lite (http://bioinfo.life.hust.edu.cn/web/GSCALite/) serves as an integrated genomic and immunogenomic platform tailored for cancer gene set research, enabling systematic interrogation of gene expression, mutation, and immune-related features across multiple cancer types. 45
Genetic Alterations
The muTarget database (https://www.mutarget.com/) provides an open-access platform that integrates somatic mutations and gene expression profiles to facilitate the identification of biomarkers and potential therapeutic targets across diverse solid tumors. 46 The UALCAN portal (http://ualcan.path.uab.edu/analysis.html) was employed to investigate methylation alterations and phosphorylation states of ECT2 in multiple cancer types and their corresponding adjacent normal tissues. In addition, the cBioPortal for Cancer Genomics (http://www.cbioportal.org/) was used to assess co-occurrence patterns of gene mutations between ECT2 signatures and other cancer-associated proteins in patient cohorts from the TCGA Pan-Cancer Atlas Studies. 47
Cell Culture and Lentivirus-Mediated ECT2 Gene Silencing
The human hepatocellular carcinoma cell line HepG2 was obtained from the Chinese Academy of Sciences and cultured in Dulbecco’s Modified Eagle’s Medium (DMEM) supplemented with 10% heat-inactivated fetal bovine serum (FBS; Gemini Bio Products). Cells were maintained at 37°C in a humidified incubator with 5% CO₂. For ECT2 gene silencing, lentiviral particles carrying a short hairpin RNA (shRNA) targeting the sequence 5′-GCCTCAGATTGAAACAAGA-3′ were synthesized by Genomeditech. Following transduction, cells were selected with 2 µg/ml puromycin (catalog no. ST551; Beyotime Biotechnology) for 72 hours to establish stable ECT2 knockdown lines.
Cell Viability Assay
Cell viability was assessed using the Cell Counting Kit-8 (CCK-8; Yeasen Biotechnology) following the manufacturer’s instructions. Briefly, cells were seeded into 96-well plates at a density of 5 × 10³ cells per well and cultured for 4 days to allow adherence and growth. At the indicated time points, CCK-8 reagent was added to each well, and the plates were incubated according to the manufacturer’s protocol. Absorbance was measured at 450 nm with a reference wavelength of 630 nm using a microplate reader.
Immunofluorescence Microscopy
After 48 h of incubation, cells were fixed with 4% paraformaldehyde for 15 minutes at 4°C, permeabilized with Triton X-100, and blocked with 5% goat serum (P0096, C0265; Beyotime Biotechnology) to reduce non-specific binding. Cells were then incubated with the primary antibody overnight at 4°C, followed by extensive washing and incubation with fluorescence-conjugated secondary antibodies—FITC-labeled goat anti-rabbit IgG (AS011; ABclonal) or Cy3-conjugated goat anti-rabbit IgG (AS007; ABclonal)—for 1 h at room temperature in the dark. Nuclei were counterstained with DAPI (C1006; Beyotime Biotechnology) for 5 minutes under light-protected conditions. Fluorescence images were acquired using a Leica DMI 6000B microscope (Leica Microsystems, Germany) under identical imaging settings, and quantitative image analysis was performed with ImageJ software (NIH, USA).
Quantitative Real-Time PCR Analysis
Total RNA was extracted using TRIzol reagent (Invitrogen; Thermo Fisher Scientific) according to the manufacturer’s protocol. Complementary DNA (cDNA) was synthesized from purified RNA with the PrimeScript RT reagent kit (RR036A; Takara Bio) following the manufacturer’s instructions. Quantitative real-time PCR (qPCR) was performed with SYBR Green Master Mix (11198ES03; Yeasen Biotechnology) on a QuantStudio 6 Flex Real-Time PCR System (Applied Biosystems). Relative mRNA expression was normalized to GAPDH and quantified using the comparative 2^−ΔΔCq method.
Statistical Analysis
Statistical analyses were conducted using Sangerbox (http://www.sangerbox.com/tool), a publicly available online platform for data analysis. 48 Differential expression of ECT2 between tumor and matched adjacent normal tissues was evaluated using independent 2-sample t-tests. Prognostic relevance was assessed by univariate Cox proportional hazards regression to estimate hazard ratios (HRs) and corresponding P-values. Patients were stratified into high- and low-expression groups according to ECT2 levels, and survival outcomes were compared using Kaplan–Meier analysis with significance determined by the log-rank test. A threshold of P < .05 was applied across all analyses.
Results
ECT2 Variants, Localization, Single-Cell Variations, and Expression Profiles Under Physiological Conditions
To determine the subcellular localization of ECT2, we performed indirect immunofluorescence staining in 3 representative cancer cell lines—A549 lung carcinoma, U-251 malignant glioblastoma (MG), and U-2 osteosarcoma (OS)—sourced from the Human Protein Atlas (HPA) database. ECT2 displayed dual localization within both the nucleus and cytoplasm across all cell lines, with no significant co-localization observed with endoplasmic reticulum or microtubule markers (Figure 1A). Complementary transcriptomic profiling revealed broad expression of ECT2 mRNA across diverse normal human tissues, including immune, internal, nervous, secretory, muscular, and reproductive systems (Figure 1B). Structural analysis further indicated that naturally occurring missense variants at Ser15 and Thr833 map to the cell membrane (Figure 1C). Single-cell RNA sequencing of FUCCI U-2 OS cells demonstrated cell cycle–dependent regulation of ECT2 transcript abundance, with protein expression patterns tightly correlated with G1, S, and G2 phase transitions (Figure 1D). Moreover, gene–disease interaction network analysis identified multiple functional partners of ECT2, implicating the protein in diverse cellular pathways and regulatory processes (Figure 1E).

ECT2 variant, localization, single-cell variations, functional partners, and expression profile under physiological conditions. (A) Immunofluorescence staining of the subcellular distribution of ECT2within the nucleus, endoplasmic reticulum (ER), and microtubules of A549 lung carcinoma cells, U-251 glioblastoma cells, and U-2 osteosarcoma cells as adopted from the HPA database. (B) Bar plot of ECT2 mRNA expressions in various normal human tissues from the GTEx database. (C) ECT2 protein topology showing membrane localization with a natural missense variant of Ser15 and Thr833. (D) Plots of single-cell RNA-sequencing data from the FUCCI U-2 osteosarcoma cell line, showing the correlation between ECT2 mRNA expression and cell cycle progression. (E) Network of functional gene partners of ECT2.
ECT2 is Aberrantly Overexpressed and is Associated With Tumor Stages, Metastases, and Poor Cancer Prognoses
We systematically compared ECT2 expression between normal and tumor tissues across TCGA cancers using unpaired Wilcoxon rank-sum and signed-rank tests. ECT2 was significantly upregulated in 31 tumor types, including GBM, GBMLGG, LGG, UCEC, BRCA, CESC, LUAD, ESCA, STES, KIRP, KIPAN, COAD, READ, PRAD, STAD, HNSC, KIRC, LUSC, LIHC, WT, SKCM, BLCA, OV, PAAD, TGCT, UCS, ALL, LAML, ACC, and CHOL (Figure 2A). To assess the prognostic significance of ECT2, we constructed Cox proportional hazards regression models using the coxph function of the R survival package, with log-rank testing for statistical evaluation. High ECT2 expression was associated with poor overall survival (OS) in 14 tumor types (GBMLGG, LGG, LAML, LUAD, KIRP, KIPAN, PRAD, LIHC, MESO, PAAD, PCPG, ACC, KICH), whereas in ovarian cancer (OV), low expression correlated with unfavorable prognosis (Figure 2B). Similarly, elevated ECT2 expression predicted poor disease-specific survival (DSS) in 14 tumor types (GBMLGG, LGG, LUAD, ESCA, KIRP, KIPAN, PRAD, KIRC, LIHC, MESO, PAAD, PCPG, ACC, KICH), while low expression conferred poor prognosis in OV (Supplemental Figure 1A). For disease-free interval (DFI), intermediate-to-high ECT2 expression was linked to inferior outcomes in CESC, LUAD, LIHC, and PAAD (Supplemental Figure 1B). Furthermore, progression-free interval (PFI) analysis revealed that medium-to-high ECT2 expression was associated with poor prognosis in 14 cancers, including GBMLGG, LGG, LUAD, ESCA, KIRP, KIPAN, PRAD, LIHC, SKCM-P, MESO, PAAD, PCPG, ACC, and KICH (Supplemental Figure 1C).Proteomic validation using CPTAC datasets further confirmed increased ECT2 protein levels in primary breast, colon, uterine corpus endometrial, lung adenocarcinoma, pancreatic adenocarcinoma, head and neck squamous cell carcinoma, glioblastoma multiforme, and hepatocellular carcinoma tissues relative to matched normal samples (Figure 2C). Additionally, stage-stratified analyses revealed significant ECT2 expression differences across clinical parameters: T1–T4 in PRAD, PAAD, and UCS (Supplemental Figure 2A); M0–M1 in GBMLGG, LGG, PRAD, THCA, and MESO (Supplemental Figure 2B); N0–N3 in HNSC, UCS, and CHOL (Supplemental Figure 2C); pathological stages I–IV in PRAD, THCA, and UCS (Supplemental Figure 2D); and histological grades G1–G3 in BRCA and ESCA (Supplemental Figure 2E).

Up-regulation of ECT2 mRNA expression in pan-cancer and the relationship between ECT2 expression and OS in tumor patients. (A) ECT2 expression levels in tumor and normal tissues based on the consolidated data of GTEx and TCGA databases. (B) Cox analysis of ECT2 expression with OS in pan-cancer. (C) The ECT2 protein expression level in normal tissues and primary tissues of breast cancer, ovarian cancer, colon cancer, clear cell RCC, and UCEC, lung adenocarcinoma, pancreatic adenocarcinoma, head and neck squamous carcinoma, glioblastoma multiforme, hepatocellular carcinoma was examined using the CPTAC dataset (*P < 0.05, **P < 0.01, and ***P < 0.001).
Genetic Alteration Analysis Data
We next performed a comprehensive genomic analysis of ECT2 across TCGA pan-cancer cohorts. Gene amplification emerged as the predominant form of DNA alteration, most frequently observed in lung squamous cell carcinoma (LUSC), followed by ovarian serous cystadenocarcinoma (OV) and esophageal adenocarcinoma (ESCA; Figure 3A). In contrast, ECT2 mutations were enriched in uterine corpus endometrial carcinoma (UCEC), skin cutaneous melanoma (SKCM), and colorectal adenocarcinoma (COAD), while deep deletions were predominantly detected in stomach adenocarcinoma (STAD). A global overview of ECT2 alterations revealed that missense mutations represented the dominant variant class, with the recurrent D320A/N/Y substitution identified in 3 UCEC cases (Figure 3B). Structural modeling further localized this hotspot mutation within the 3-dimensional architecture of the ECT2 protein (Figure 3C). Correlation analyses demonstrated that both copy number alterations and mutational status were strongly associated with RNA expression levels (Figure 3D). Statistical testing confirmed that ECT2 expression was significantly dependent on both mutation type and copy number variation (Figure 3E and F), indicating that genetic alterations may contribute to its aberrant overexpression in tumors. Clinically, patients harboring ECT2 alterations exhibited significantly poorer outcomes compared with alteration-free counterparts. Specifically, adverse effects were observed across multiple survival endpoints, including overall survival (OS), disease-specific survival (DSS), disease-free interval (DFI), and progression-free interval (PFI; Figure 3G-J). These findings underscore that ECT2 mutations exert pleiotropic effects beyond isolated protein dysfunction, potentially reshaping transcriptional programs across oncogenic signaling pathways. Collectively, our integrative analysis of somatic alterations and gene expression highlights ECT2 as a candidate biomarker and potential therapeutic target in diverse solid tumors.46,49,50 More than half of all human malignancies harbor mutations in TP53, the most frequently altered gene in cancer. 51 Through integrative genomic analysis, we observed a strong association between ECT2 expression and TP53 somatic mutation status (Supplemental Figure 3A). In addition, ECT2 expression was significantly correlated with mutations in two other canonical tumor suppressors, PTEN and RB1 (Supplemental Figure 3B and C). These results suggest that ECT2 dysregulation may be functionally linked to disruption of fundamental tumor-suppressive pathways, thereby contributing to oncogenic progression.

Mutation feature of ECT2 in different tumors of TCGA. (A) We analyzed the mutation features of ECT2 for TCGA tumors using the cBioPortal tool. The alteration frequency with mutation type. (B) The mutation site is displayed. (C) The mutation site with the highest alteration frequency (D320A/N/Y site) in the 3D structure of ECT2 is displayed. (D) Putative ECT2 copy-number alterations from GISTIC. (E and F) Mutation Type and Copy Number were statistically dependent of ECT2 expression. (G-J) The effect of ECT2 mutation status on overall, disease-specific, disease-free, and progression-free survival of cancer patients was investigated using the cBioPortal database (*P < 0.05, **P < 0.01, and ***P < 0.001).
Pan-Cancer Analysis of the DNA Methylation, RNA Modification and the Phosphorylation of ECT2
DNA methylation, a reversible epigenetic modification, plays a pivotal role in tumorigenesis. Disruption of both normal methylation patterns and global methylation levels within regulatory regions is frequently observed in the earliest stages of malignant transformation.52 -54 Within this framework, promoter methylation profiling has repeatedly been proposed as a promising biomarker for cancer diagnosis and as a potential guide for therapeutic strategy development. 55 Using the UALCAN database, we systematically profiled the promoter methylation status of ECT2 across multiple cancer types. Distinct patterns of hypomethylation were observed in testicular germ cell tumors (TGCT), sarcoma (SARC), lung squamous cell carcinoma (LUSC), lung adenocarcinoma (LUAD), esophageal carcinoma (ESCA), and colorectal adenocarcinoma (COAD; Figure 4A). In contrast, pronounced hypermethylation was detected in prostate adenocarcinoma (PRAD), hepatocellular carcinoma (LIHC), and kidney renal papillary cell carcinoma (KIRP; Figure 4B). These tumor-specific methylation signatures indicate that promoter methylation constitutes a critical epigenetic mechanism underpinning the dysregulated expression of ECT2 in malignant transformation. Emerging evidence from numerous studies has highlighted the pivotal role of m6A RNA methylation regulators in the pathogenesis of various human diseases. 56 Comprehensive genomic analyses revealed significant positive correlations between ECT2 expression and multiple RNA modification–related genes, spanning diverse modification pathways including m¹A, m⁵C, and m⁶A methylation. In particular, core RNA methyltransferase components (METTL3, METTL14, WTAP) and the m⁶A reader protein YTHDF1 exhibited strong positive associations with ECT2 expression (Figure 4C). These findings suggest that ECT2 expression may be regulated, at least in part, through RNA post-transcriptional modification. In addition, post-translational modification (PTM) has emerged as a critical molecular mechanism for ECT2 activation. Notably, Zhang et al identified a reciprocal positive feedback loop between ECT2 and the deubiquitinating enzyme USP7, in which USP7-mediated deubiquitination promotes ECT2 intermolecular self-association, thereby enhancing its stability and oncogenic activity. 57 To elucidate the role of ECT2 phosphorylation in tumorigenesis, we performed a comparative analysis of phosphorylation levels between primary tumor tissues and adjacent normal tissues using data from the Clinical Proteomic Tumor Analysis Consortium (CPTAC). Our study encompassed 6 major malignancies: breast invasive carcinoma (BRCA), clear cell renal cell carcinoma (KIRC), colorectal adenocarcinoma (COAD), lung adenocarcinoma (LUAD), ovarian serous cystadenocarcinoma (OV), and uterine corpus endometrial carcinoma (UCEC). Comprehensive interrogation of the CPTAC dataset revealed striking alterations in ECT2 phosphorylation patterns across cancer types. Notably, head and neck squamous cell carcinoma (HNSCC) demonstrated markedly elevated phosphorylation at multiple sites, including S367, T373, S442, S443, T444, T857, S858, and S861, relative to normal counterparts. Distinct site-specific changes were also evident in other malignancies: T373 phosphorylation was upregulated in BRCA; T359 phosphorylation was significantly elevated in pancreatic adenocarcinoma; hepatocellular carcinoma displayed pronounced increases in both T359 and S866 phosphorylation; and LUAD exhibited robust upregulation at S858 and T359 (Supplemental Figure 4). Together, these findings strongly support a pivotal role for site-specific phosphorylation of ECT2 in cancer biology. The observed phosphorylation signatures likely contribute to oncogenic processes underlying tumor initiation and progression, positioning ECT2 as a potential therapeutic target across diverse malignancies.

DNA methylation and mutation features of ECT2 in pan-cancer. (A and B) Promoter methylation level of ECT2 in pan-cancer. The results were obtained from the UALCAN database. (C) The correlation of ECT2 expression and RNA modification regulator expression in pan-cancer. (*P < 0.05, **P < 0.01, and ***P < 0.001.).
ECT2 Affects Tumor Immune Infiltration and Microenvironment in Pan-Cancer
With the rapid advances in tumor molecular biology and computational technologies, our understanding of the complexity and heterogeneity of the tumor microenvironment (TME) has markedly expanded, particularly regarding its influence on treatment response.58 -60 The TME comprises not only malignant cells but also diverse stromal and immune cell populations, including fibroblasts, inflammatory cells, vascular-associated cells, and an extracellular matrix scaffold of collagen, elastin, and glycoproteins. 61 To dissect the immunological context of ECT2, we applied multiple deconvolution algorithms—including TIMER, 62 CIBERSORT, 63 QUANTISEQ, 35 XCELL, 34 MCPCOUNTER, 64 IPS, 65 EPIC 66 —to interrogate immune infiltration patterns across TCGA cancer types. Using the deconvo_xCell method, ECT2 expression was found to be significantly associated with immune infiltration in 44 cancer types (Figure 5A). Similarly, the deconvo_quantiseq approach revealed correlations between ECT2 expression and infiltration scores of 11 immune cell subsets (B cells, M1/M2 macrophages, monocytes, neutrophils, NK cells, CD4⁺ T cells, CD8⁺ T cells, Tregs, dendritic cells, and others), spanning 43 cancers (Figure 5B). TIMER-based analyses corroborated these associations, showing significant relationships with 6 immune cell types—B cells, CD4⁺ T cells, CD8⁺ T cells, neutrophils, macrophages, and dendritic cells—in 37 cancers (Figure 5C). Notably, NK cells, Th1 cells, Th2 cells, and CD4⁺ T cells exhibited the strongest positive correlations with ECT2 expression. Additional analyses using CIBERSORT, MCPCOUNTER, IPS, and EPIC further validated the robust associations between ECT2 expression and immune infiltration (Supplemental Figure 5). Single-cell RNA sequencing datasets revealed that ECT2 is preferentially expressed in malignant cells across several tumor types, including HNSC, KIRC, LIHC, NHL, NSCLC, ALL, and MM. Importantly, among TME-resident immune populations, elevated ECT2 expression was observed in CD8⁵ T cells, conventional CD4⁵ T cells, exhausted CD8⁵ T cells, monocytes/macrophages, and proliferating T cell subsets (Supplemental Figure 6). Together, these findings indicate that ECT2 is intricately linked to immune cell infiltration and TME composition, underscoring its potential role as a key modulator of tumor–immune interactions.

The ECT2 expression correlated with immune infiltration. (A) The ECT2 expression significantly correlated with the infiltration levels of various immune cells based on xCell. (B) The ECT2 expression significantly correlated with the infiltration levels of various immune cells in the QUANTISEQ database. (C) The ECT2 expression significantly correlated with the infiltration levels of various immune cells in the Timer database. (*P < 0.05, **P < 0.01, and ***P < 0.001.).
The Effect of ECT2 on Immunological Status in Pan-Cancers
Pan-cancer analyses of the immunological role of ECT2 are essential for identifying tumor types that may benefit from anti-ECT2 immunotherapeutic strategies. Our integrative findings revealed that ECT2 expression was negatively correlated with the majority of immunomodulators in neuroblastoma (NB), thymoma (THYM), testicular germ cell tumor (TGCT), glioblastoma multiforme (GBM), and lung squamous cell carcinoma (LUSC), whereas positive correlations predominated in other cancer types (Figure 6A). Notably, in NB, THYM, TGCT, GBM, and LUSC, most major histocompatibility complex (MHC) molecules were negatively associated with ECT2, suggesting impaired antigen presentation and processing in ECT2-high tumors. By contrast, chemokines such as CCL2, CCL3, CCL4, CCL5, CCL19, CCL20, CCL21, CXCL11, and CXCL13, together with their cognate receptors CCR1, CCR2, CCR5, CCR6, and CXCR3, exhibited strong positive correlations with ECT2. These chemokine–receptor interactions are known to facilitate the recruitment of effector tumor-infiltrating immune cells (TIICs), including CD8⁵ T cells, TH17 cells, and antigen-presenting cells. However, given the multifaceted and context-dependent functions of the chemokine network, analyses of individual chemokines were insufficient to delineate the overall immunological impact of ECT2 within the tumor microenvironment (TME). To this end, we further examined the activities of the cancer–immunity cycle, which provides a comprehensive framework for evaluating chemokine and immunomodulator function. 67 Immune surveillance is critical for shaping patient prognosis, and tumor cells frequently exploit immune checkpoint pathways, including PD-1, PD-L1, and CTLA-4, to evade host responses. 68 Consistently, our analyses demonstrated that ECT2 expression was positively correlated with a broad set of immune checkpoint inhibitors and stimulators—including HMGB1, LAG-3, VEGFA, IDO1, and CD80—across most cancer types, while negative correlations were predominantly restricted to NB and TGCT (Figure 6B). To contextualize these findings, we assessed ECT2 expression across the 6 immune subtypes defined by Thorsson et al 69 —C1 (wound healing), C2 (IFN-γ dominant), C3 (inflammatory), C4 (lymphocyte depleted), C5 (immunologically quiet), and C6 (TGF-β dominant). ECT2 expression differed significantly across immune subtypes in 29 tumor types (Supplemental Figure 7), underscoring its immunological heterogeneity. Collectively, these results indicate that ECT2 overexpression is TME-specific, associated with altered immunomodulator and immune checkpoint landscapes, and shaped by tumor immune subtype context. This immunogenomic profile highlights ECT2 as a promising candidate for rationally designed and subtype-adapted immunotherapeutic interventions.

The effect of ECT2 on immunological status in pan-cancers. (A) Correlation between ECT2 and immunomodulators (chemokines, receptors, MHC, and immunostimulators). (B) Correlation between ECT2 and immune checkpoints (Inhibitory, Stimulaotry) The color indicates the correlation coefficient. The asterisks indicate a statistically significant p-value calculated using spearman correlation analysis. (*P < 0.05, **P < 0.01, and ***P < 0.001.).
Pan-Cancer Analysis of the Correlation Between the ECT2 Expression and TMB
Tumor mutation burden (TMB) and microsatellite instability (MSI) are 2 established biomarkers predictive of immunotherapy responsiveness. TMB, in particular, has been shown to strongly correlate with the efficacy of PD-1/PD-L1 inhibitors, enabling patient stratification for immune checkpoint blockade.70 -72 In our analyses, ECT2 expression demonstrated significant correlations with TMB across 13 tumor types, including GBM, GBMLGG, LUAD, COAD, COADREAD, STES, KIPAN, STAD, PRAD, KIRC, PCPG, ACC, and KICH (Figure 7A). We next assessed the relationship between ECT2 expression and MSI across diverse malignancies. Positive correlations were identified in 10 cancer types—GBM, COAD, COADREAD, STES, SARC, STAD, KIRC, LUSC, LIHC, and READ—while GBMLGG, PRAD, and DLBC exhibited negative associations (Figure 7B). These divergent patterns underscore the complexity of MSI regulation and warrant further mechanistic investigation. Beyond immunogenomic biomarkers, we evaluated the association of ECT2 expression with tumor stemness, a hallmark defined by self-renewal and multilineage differentiation potential.73,74 Two stemness indices—mRNA-based stemness scores (RNAss) and DNA methylation-based stemness scores (DNAss)—were used to assess the correlation between ECT2 and stemness signatures. Notably, ECT2 expression was significantly correlated with DNAss in 9 tumor types, of which 8 exhibited positive associations and 1 exhibited a negative relationship (Figure 7C). Similarly, positive correlations between ECT2 expression and RNAss were observed in GBM, GBMLGG, LGG, LUAD, STES, STAD, and LUSC, whereas THYM displayed a negative correlation (Figure 7D). Taken together, these findings highlight the multifaceted role of ECT2 in tumorigenesis, linking its expression to mutational load, genomic instability, and cancer stemness. By intersecting immunotherapy-related biomarkers (TMB, MSI) with stemness features, our results suggest that ECT2 may serve as a potential integrative biomarker for both immune responsiveness and tumor aggressiveness.

Correlation of ECT2 gene expression with TMB and MSI in pan-cancer tissues. (A) A stick chart showing the relationship between ECT2 gene expression and TMB in different tumors. (B) A stick chart showing the association between ECT2 gene expression and MSI in different tumors. (C) A stick chart shows the relationship between the ECT2 gene expression and DNAss in diverse tumors. (D) A stick chart shows the relationship between the ECT2 gene expression and DMPss in diverse tumors.
Enrichment Analysis of ECT2-Related Partners
To further elucidate the molecular mechanisms by which ECT2 contributes to tumorigenesis, we systematically identified ECT2-binding proteins and genes associated with ECT2 expression for enrichment analyses. Using the BioGRID and PINA databases, we identified 136 potential ECT2-interacting proteins (Figure 8A). Pathway enrichment analysis using the Kyoto Encyclopedia of Genes and Genomes (KEGG) revealed significant enrichment in metabolic pathways, RNA transport, Hippo signaling, and cell cycle regulation (Figure 8B and C). Consistently, Gene Ontology (GO) analysis indicated that ECT2-binding proteins were predominantly involved in cell cycle–related processes (Figure 8D). We next evaluated the correlation between ECT2 and 14 functional states across various cancers. These analyses demonstrated that ECT2 is primarily associated with cell cycle progression and cellular proliferation, and also plays a significant role in DNA damage repair (Figure 8E). Supporting this, LinkedOmics-based analysis of genes correlated with ECT2 expression in adrenocortical carcinoma (ACC) revealed that both positively and negatively associated genes were enriched in cell cycle and DNA replication pathways (Figure 8F, Supplemental Figure 8A and B). 75 Given the central role of transcriptional regulation in oncogenesis, we investigated transcription factors (TFs) predicted to regulate ECT2 using the GRNdb database. We identified 8 candidate TFs, which were predominantly involved in cell cycle regulation, apoptosis, and DNA damage repair (Supplemental Figure 8C and D). Collectively, these results indicate that ECT2 serves as a critical regulator of cell cycle progression and genome stability through its extensive protein–protein interaction network and transcriptional regulation. This reinforces its importance as a nodal factor in cancer biology and highlights its potential as a therapeutic target.

Enrichment analysis of ECT2-related genes. (A) ECT2-binding proteins were obtained from the BioGRID database and the PINA database. (B and C) Analysis of ECT2-binding proteins by Kyoto Encyclopedia of Genes and Genomes pathway analysis. (D) Analysis of ECT2-binding proteins by Gene ontology (GO) analysis. (E) The correlation between 14 functional states and ECT2 in different cancers. (F) Genes positively and negatively associated with ECT2 in adrenocortical carcinoma (ACC) in the LinkedOmics database.
ECT2 Promotes Cell Cycle Transition and Proliferation in Hepatocellular Carcinoma Cells
To further delineate the role of ECT2 in hepatocellular carcinoma (HCC), we generated a lentiviral-mediated ECT2 knockdown (shECT2) model in HepG2 cells. qPCR validation confirmed effective ECT2 silencing (Figure 9A), while immunofluorescence analysis demonstrated a marked reduction in ECT2 protein levels accompanied by decreased expression of the cell cycle regulators Cyclin D1 and CDK1 (Figure 9B and C). Consistently, qPCR analysis revealed significant downregulation of Cyclin D1 and CDK1 mRNA expression in shECT2 cells (Figure 9D). Functionally, CCK-8 assays showed that ECT2 knockdown markedly inhibited HepG2 cell proliferation (Figure 9E). Moreover, immunofluorescence revealed a reduction in the epithelial–mesenchymal transition (EMT) markers Slug and Snail, indicating that ECT2 depletion impairs EMT initiation and progression in HCC (Figure 9F and G). To explore the molecular mechanisms underlying ECT2 function, we performed RNA sequencing (RNA-seq) in shECT2 and control HepG2 cells. Differential expression analysis identified 1403 significantly altered genes, including 1103 upregulated and 300 downregulated genes (Figure 10A and B). GO enrichment analysis revealed that these genes were predominantly involved in mitotic cell cycle checkpoint regulation, IκB kinase/NF-κB signaling, DNA-binding transcription factor activity, and Rho GDP-dissociation inhibitor binding (Figure 10C). KEGG pathway analysis highlighted the enrichment of Jak–STAT and AMPK signaling pathways (Figure 10D). Notably, ECT2 knockdown strongly impacted transcription factor families, with the ZF-C2H2 family exhibiting the most significant alterations (Figure 10E). Collectively, these findings demonstrate that ECT2 promotes cell cycle progression, proliferation, and EMT in HCC cells, in part through the regulation of transcriptional networks and oncogenic signaling pathways. These results underscore the potential of ECT2 as a therapeutic target for the treatment of HCC.

Effect of ECT2 knockdown in HCC cell lines on cell proliferation. (A) qPCR confirmed the efficiency of ECT2 knockdown. (B and C) Immunofluorescence analysis revealed a significant reduction in the expression of cell cycle proteins Cyclin D1 and CDK1 following ECT2 depletion. (D) qPCR further demonstrated decreased mRNA levels of Cyclin D1 and CDK1, along with altered expression of P16 and P21. (E) CCK-8 assays showed that ECT2 knockdown significantly inhibited HepG2 cell proliferation. (F and G) Immunofluorescence also indicated a marked reduction in the expression of epithelial-mesenchymal transition (EMT) markers Slug and Snail in shECT2 cells. (*P < 0.05, **P < 0.01, ***P < 0.001, ****P < 0.0001).
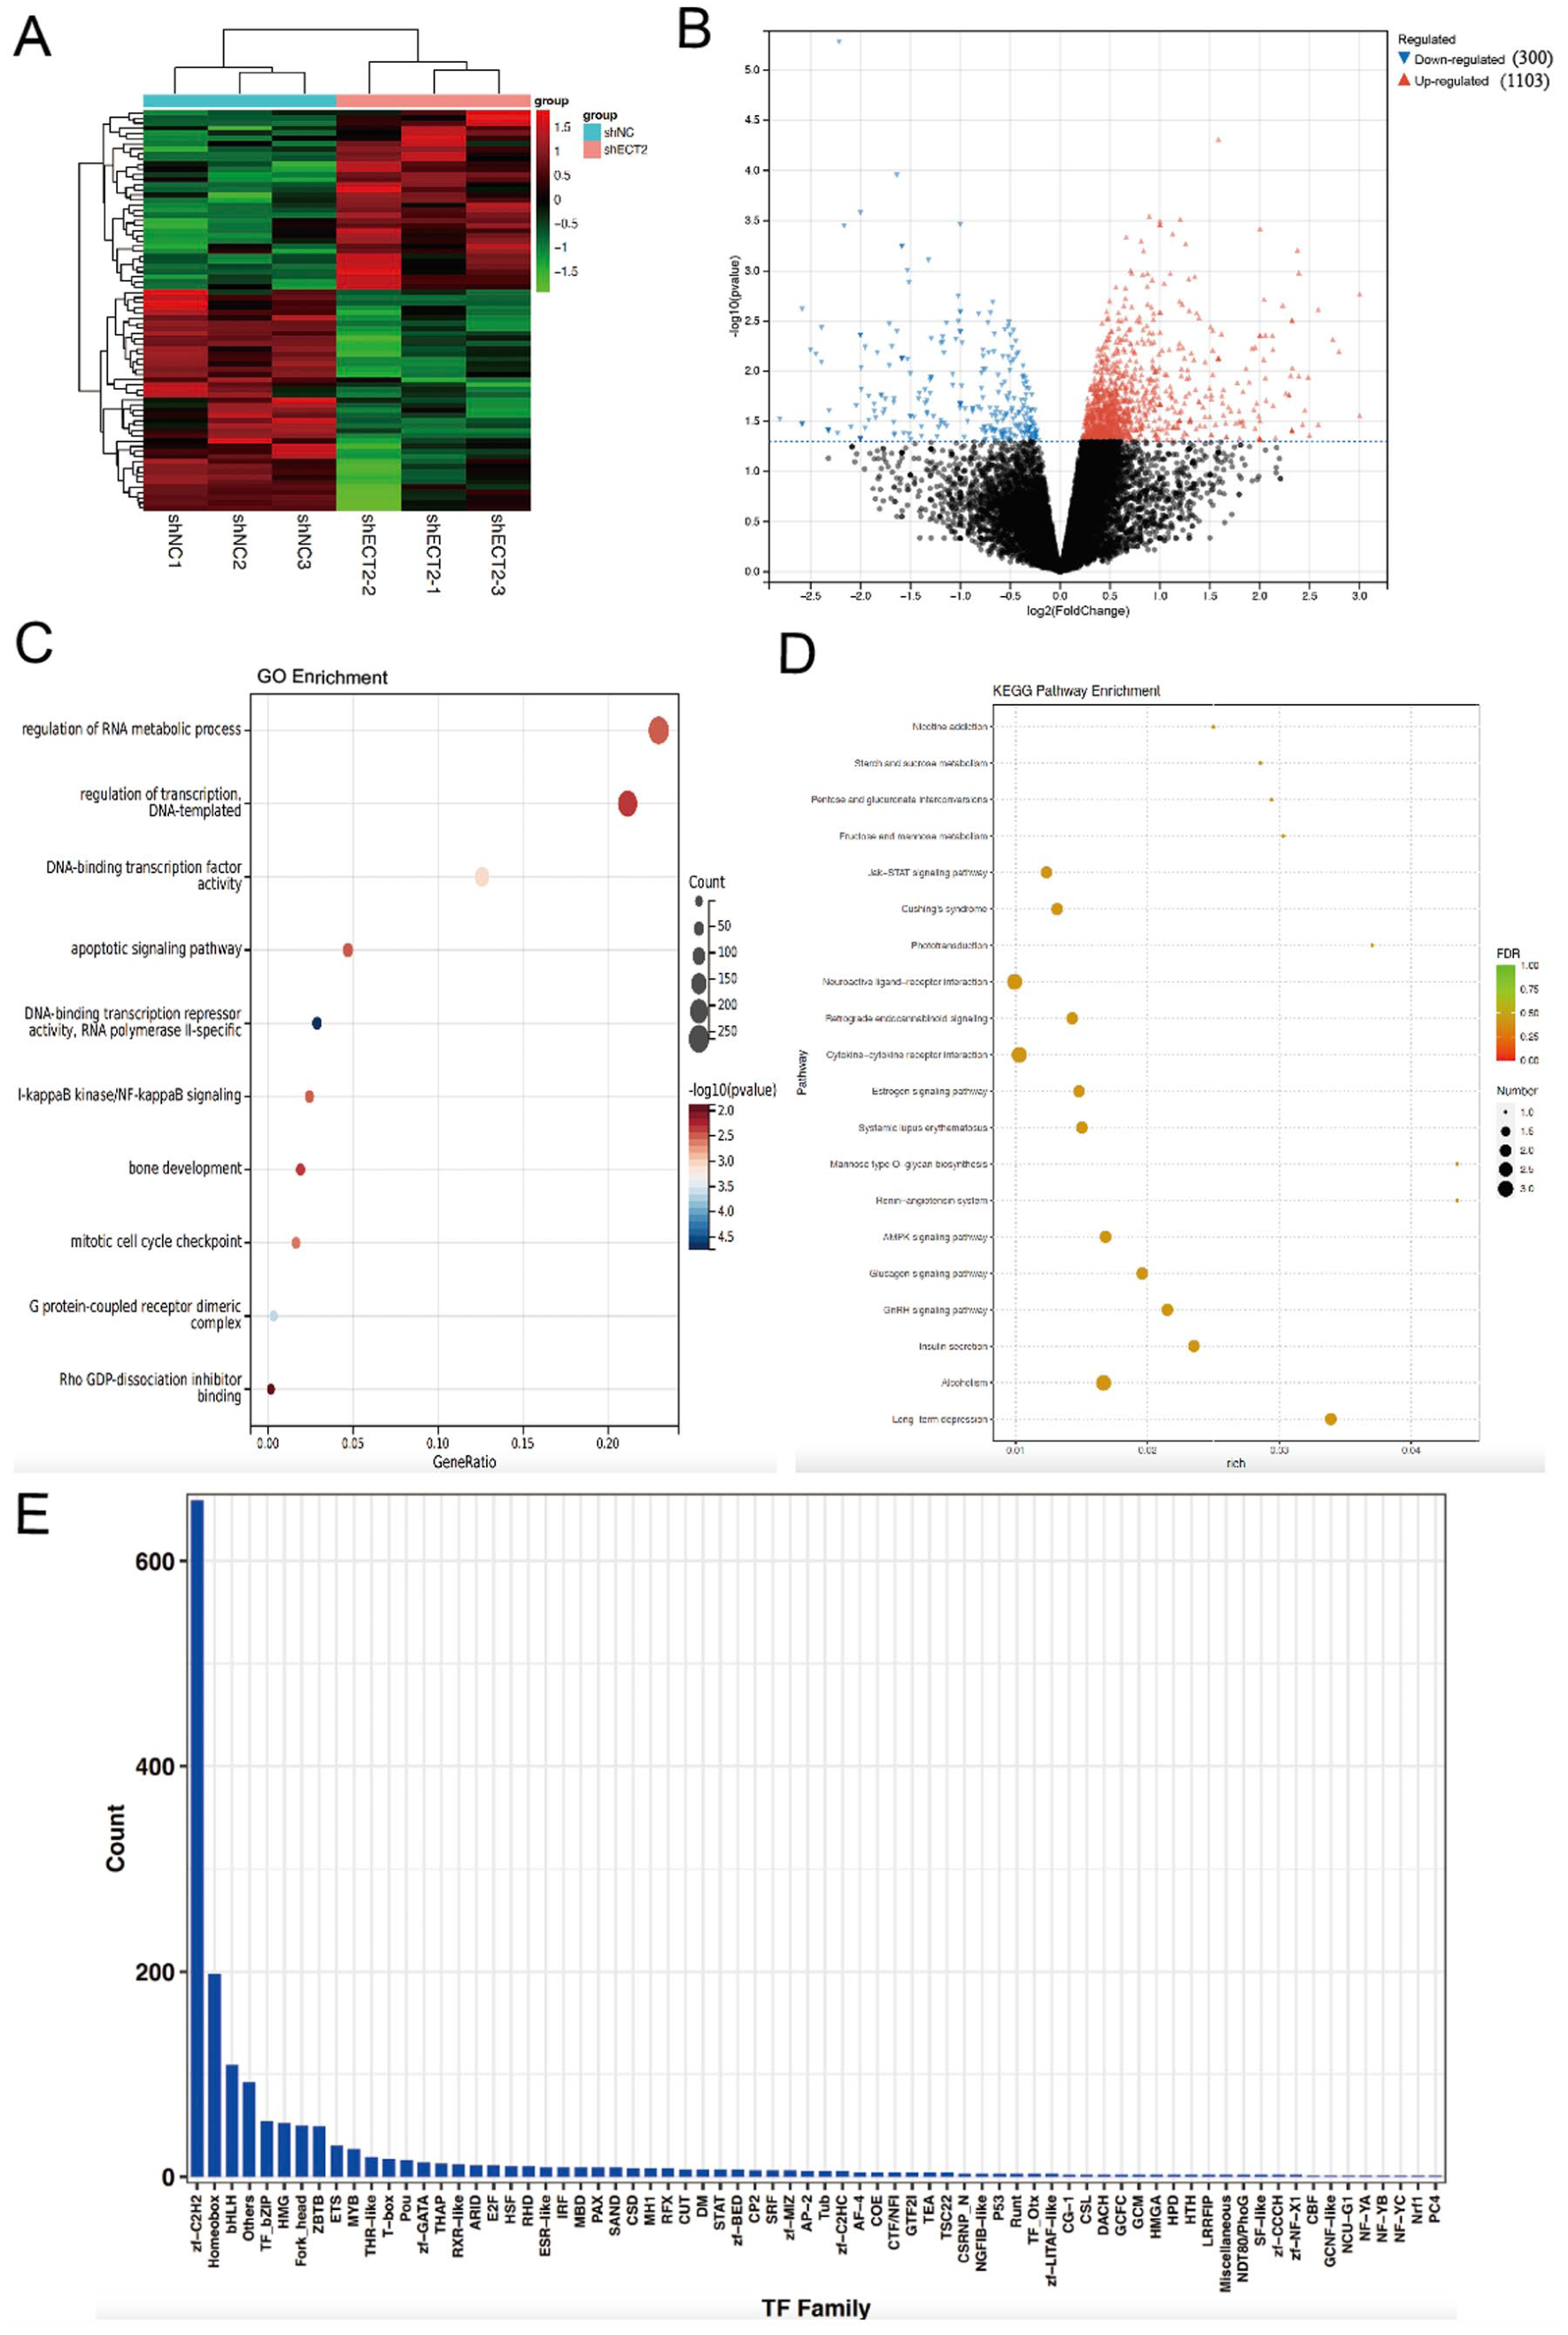
RNA-seq after knockdown of ECT2 in HepG2 cells. (A) Correlation analysis of samples; (B) Volcano plot of differentially expressed genes; (C) gene ontology (GO) enrichment analysis of differentially expressed genes; (D) KEGG pathway enrichment analysis of differentially expressed genes; (E) Transcription factor family enrichment analysis of differentially expressed genes.
Discussion
Immunotherapy targeting immune checkpoints has emerged as one of the most promising strategies in oncology, significantly improving patient prognosis across multiple cancer types. 76 With the rapid globalization of research and continuous advancements in immunotherapy and targeted therapy, outcomes for cancer patients have improved considerably.77,78 Nevertheless, overall survival (OS) remains unsatisfactory, largely due to the intrinsic heterogeneity of tumors. Thus, early detection and the identification of effective therapeutic targets are crucial for improving clinical outcomes. In this context, considerable attention has been directed toward discovering novel immunotherapy-related targets. Recent genome-wide pan-cancer analyses have provided valuable insights into gene mutations, RNA alterations, and cancer driver genes associated with tumorigenesis, thereby contributing to early diagnosis and biomarker discovery.79,80 Accumulating evidence indicates that ECT2 is aberrantly expressed and functionally implicated in the initiation and progression of various cancers. Moreover, multiple studies have reported functional associations between ECT2 and clinical disease, particularly malignant tumors.24,57,81,82 However, the precise role and molecular mechanisms of ECT2 in diverse tumor types remain poorly understood. Notably, despite the growing body of evidence highlighting its oncogenic potential, no comprehensive pan-cancer analysis of ECT2 has been reported to date.
In this study, we systematically analyzed the expression of ECT2 across multiple tumor types using data from The Cancer Genome Atlas (TCGA) database. Our results revealed that ECT2 expression was significantly upregulated in 31 different cancers. Furthermore, integrating previous literature with our survival analyses—including overall survival (OS), disease-specific survival (DSS), disease-free interval (DFI), and progression-free interval (PFI)—we demonstrated that ECT2 overexpression is consistently associated with poor prognosis across several malignancies. We found that ECT2 expression was correlated with GBMLGG, 81 PAAD, LUAD, 82 BRCA, 57 ESCA, 83 LIHC21,84 and COADREAD 22 linked with poor prognosis. In contrast, in OV, low ECT2 expression was associated with poorer DSS and warrants further study.
Epigenetics refers to the heritable regulation of gene expression without alterations in the DNA sequence. Multiple types of epigenetic modifications have been described, including DNA methylation, histone modifications, chromatin remodeling, and non-coding RNA regulation, among which DNA and RNA methylation are particularly critical. 85 Aberrant DNA methylation has been shown to regulate key aspects of cancer pathophysiology, including therapeutic response and metastasis.86,87 In our analysis of TCGA pan-cancer data, we identified ECT2 amplification as the most frequent DNA alteration, with missense mutations representing the predominant genetic variation. Importantly, patients with ECT2 alterations exhibited significantly worse overall survival, disease-specific survival, disease-free interval, and progression-free interval compared with those without alterations. Promoter methylation analysis further revealed cancer-type–specific patterns: ECT2 was hypomethylated in TGCT, SARC, LUSC, LUAD, ESCA, and COAD, whereas hypermethylation was observed in PRAD, LIHC, and KIRP. These findings suggest that DNA methylation acts as an epigenetic mechanism contributing to the dysregulation of ECT2 in tumorigenesis.
Immune cells in the tumor microenvironment (TME) exert a dramatic influence on tumorigenesis and development. 88 Our study further elucidates the broader tumor applicability of ECT2 and confirms that ECT2 expression is tightly related to the biological processes of immune cells and immune-related molecules in nearly all cancers. In addition, our study revealed that ECT2 is co-expressed with genes encoding MHC, immune activation, immune suppression, chemokines, and chemokine receptor proteins. In addition, we founded that ECT2 is expressed differently in immune and molecular subtypes of numerous human cancer types. ECT2 expression in most other tumor types was positively associated with a broad spectrum of chemokines (eg, CCL2, CCL5, CXCL11, CXCL13) and their cognate receptors (CCR1, CCR2, CCR5, CXCR3). These interactions are classically known to mediate the recruitment of effector immune cells, including CD8⁺ T cells, TH17 cells, and antigen-presenting cells. However, the chemokine system is inherently pleiotropic, as the same molecules can also attract immunosuppressive subsets such as Tregs and MDSCs. Therefore, the net immunological effect of ECT2-driven chemokine expression likely depends on the tumor-specific immune context, requiring further experimental validation. These results suggest that the expression of ECT2 is closely correlated with the immune infiltration of tumor cells, affects the prognosis of patients, and proffers a new target for the development of immunosuppressants. Our findings highlight that ECT2 functions as a classical oncogene by driving tumor cell proliferation, survival, and resistance to apoptosis through regulation of Rho/ERK and related pathways. However, these intrinsic proliferative effects are not isolated from the tumor immune microenvironment (TME). Rapidly proliferating tumor cells often release cytokines and chemokines that recruit immunosuppressive populations, such as TAMs, MDSCs, and Tregs, which in turn suppress antitumor immunity and promote tumor progression. Moreover, ECT2-driven proliferative stress may shape the mode of tumor cell death: while immunogenic cell death can enhance antigen presentation and trigger robust immune activation, ECT2-mediated survival signaling may favor escape from such responses, or alternatively promote the secretion of immunosuppressive mediators. Taken together, our findings highlight ECT2 as more than a cell-cycle regulator—it emerges as a context-dependent modulator of the tumor immune microenvironment. This dual functionality suggests that ECT2 could serve as both a prognostic biomarker and a therapeutic target. Rationally designed interventions combining ECT2 inhibition with checkpoint blockade may provide synergistic benefits, particularly in ECT2-high tumors with immune-inflamed but functionally suppressed profiles. Future mechanistic studies and preclinical models are warranted to clarify whether modulation of ECT2 can restore effective antitumor immunity and to identify patient subgroups most likely to benefit from anti-ECT2 immunotherapeutic strategies.
TMB is used as an auspicious pan-cancer predictive biomarker that can guide immunotherapy in the era of precision medicine, and TMB can also predict the prognosis of pan-cancer patients after immunotherapy.89,90 MSI is additionally an essential biomarker in immune checkpoint inhibitors (ICIs).91,92 Our analysis demonstrates that ECT2 expression exhibits significant correlations with 2 well-established immunotherapy biomarkers, tumor mutation burden (TMB) and microsatellite instability (MSI). Specifically, ECT2 was positively associated with TMB across 13 cancer types, including GBM, LUAD, COAD, and STAD, all of which are known to be sensitive to PD-1/PD-L1 blockade. This suggests that high ECT2 expression may coincide with mutationally enriched tumors, potentially increasing the neoantigen load and improving immunogenicity. However, correlations with MSI were more heterogeneous, with positive associations observed in gastrointestinal and other tumors, but negative relationships in GBMLGG, PRAD, and DLBC. This divergence underscores the complexity of ECT2′s relationship with genomic instability, suggesting that its impact on immune responsiveness may be tumor-type specific. Taken together, the observed associations position ECT2 as a multifaceted biomarker that integrates immune responsiveness with tumor biology. On 1 hand, its correlation with TMB and MSI highlights potential utility in predicting sensitivity to immune checkpoint blockade. On the other hand, its strong association with tumor stemness signatures suggests that ECT2 may also capture dimensions of tumor progression and treatment resistance. These dual roles imply that ECT2 could be leveraged both as a predictive biomarker for immunotherapy and as a therapeutic target for overcoming tumor aggressiveness.
In addition, information on ECT2-binding components and ECT2 expression-related genes from all tumors was integrated. Significant enrichment of a range of identified biological terms characterizing processes associated with “mitotic cell cycle processes,” “cell cycle” and “DNA replication.” In a variety of tumors, ECT2 is broadly speaking involved in the cell cycle and cell proliferation, and additionally performs an important role in DNA damage repair. These findings propose that ECT2 may also make contributions to cancer cell proliferation with the aid of promoting cell cycle progression. This study investigated the role of ECT2 in hepatocellular carcinoma (HCC) by establishing a lentiviral-mediated ECT2 knockdown (shECT2) model in the HepG2 HCC cell line. Knockdown efficiency was confirmed via qPCR, and immunofluorescence revealed reduced ECT2 protein expression, accompanied by decreased levels of cell cycle regulators Cyclin D1 and CDK1, indicating disrupted cell cycle progression. Functional assays demonstrated that ECT2 knockdown significantly inhibited HepG2 cell proliferation. Additionally, immunofluorescence revealed reduced expression of epithelial-mesenchymal transition (EMT) markers Slug and Snail, suggesting ECT2′s role in EMT regulation. These findings collectively indicate that ECT2 promotes cell cycle transition, proliferation, and EMT in HCC cells, contributing to tumor progression. The study underscores ECT2 as a potential therapeutic target in HCC treatment. ECT2 is a key oncogenic driver across multiple human cancers, with substantial druggability potential. While achieving specificity in targeting its GEF activity remains challenging, leveraging its PH domain function and PPI interfaces provides opportunities for diversified drug design. Systematic screening of existing chemical libraries, coupled with rational structure-based drug design, holds promise for the discovery of effective ECT2 inhibitors, offering new therapeutic avenues for cancer treatment. A major limitation of this study lies in the reliance on a single hepatocellular carcinoma (HCC) cell line, which may not adequately capture the biological functions of ECT2 or reflect the biological and clinical heterogeneity of HCC. To strengthen and generalize our findings, future work will incorporate additional HCC cell lines and in vivo models to further validate the biological roles and immunological properties of ECT2. As scientists strive to uncover the complexity of disease biology and improve therapeutic outcomes, drug development, particularly in the field of multi-omics research, is advancing rapidly. Multi-omics approaches integrate data from genomics, transcriptomics, proteomics, metabolomics, and other omics disciplines, which are crucial for understanding the complex molecular mechanisms of diseases. These methods provide a comprehensive view of the biological processes and interactions involved in disease development and progression, offering new insights into potential therapeutic targets and biomarkers.93,94 Multi-omics has shown tremendous potential in drug development, particularly in predicting drug sensitivity. With advancements in technology, the potential of multi-omics continues to grow in transforming disease treatment and improving patient survival rates, making ECT2 a key target in the ongoing fight against tumors.
Conclusion
This study demonstrates that ECT2 is aberrantly upregulated across multiple cancer types and consistently associated with poor prognosis. Genomic analyses revealed frequent ECT2 amplification and epigenetic dysregulation, while its expression was strongly correlated with tumor mutation burden (TMB), microsatellite instability (MSI), and stemness features, suggesting its potential role as an integrative biomarker linking immune responsiveness and tumor aggressiveness. Furthermore, ECT2 expression was significantly associated with immune modulators, chemokines, and checkpoint molecules, highlighting its capacity to remodel the tumor immune microenvironment and contribute to immune evasion. Functional assays further validated that ECT2 promotes cell cycle progression, proliferation, and epithelial–mesenchymal transition (EMT), thereby facilitating tumor progression. Collectively, our findings indicate that ECT2 functions not only as a classical oncogene but also as a context-dependent regulator of the tumor–immune interface. These results position ECT2 as a promising prognostic biomarker and therapeutic target, warranting further mechanistic studies and exploration of anti-ECT2 immunotherapeutic strategies.
Supplemental Material
sj-docx-1-cix-10.1177_11769351251396242 – Supplemental material for Pan-Cancer Analysis of the Prognostic and Immunological Role of ECT2: A Promising Target for Survival and Immunotherapy
Supplemental material, sj-docx-1-cix-10.1177_11769351251396242 for Pan-Cancer Analysis of the Prognostic and Immunological Role of ECT2: A Promising Target for Survival and Immunotherapy by Lulu Wang, Hua Jin, Xiaowei Liu and Hanzhi Zhang in Cancer Informatics
Footnotes
Abbreviations
ACC: Adrenocortical carcinoma
BLCA: Bladder Urothelial Carcinoma
BRCA: Breast invasive carcinoma
CESC: Cervical squamous cell carcinoma and endocervical adenocarcinoma
CHOL: Cholangiocarcinoma
COAD: Colon adenocarcinoma
COADREAD: Colon adenocarcinoma/Rectum adenocarcinoma Esophageal carcinoma
DLBC: Lymphoid Neoplasm Diffuse Large B-cell Lymphoma
ESCA: Esophageal carcinoma
FPPP: FFPE Pilot Phase II
GBM: Glioblastoma multiforme
GBMLGG: Glioma
HNSC: Head and Neck squamous cell carcinoma
KICH: Kidney Chromophobe
KIPAN: Pan-kidney cohort (KICH+KIRC+KIRP)
KIRC: Kidney renal clear cell carcinoma
KIRP: Kidney renal papillary cell carcinoma
LAML: Acute Myeloid Leukemia
LGG: Brain Lower Grade Glioma
LIHC: Liver hepatocellular carcinoma
LUAD: Lung adenocarcinoma
LUSC: Lung squamous cell carcinoma
MESO: Mesothelioma
OV: Ovarian serous cystadenocarcinoma
PAAD: Pancreatic adenocarcinoma
PCPG: Pheochromocytoma and Paraganglioma
PRAD: Prostate adenocarcinoma
READ: Rectum adenocarcinoma
SARC: Sarcoma
STAD: Stomach adenocarcinoma
SKCM: Skin Cutaneous Melanoma
STES: Stomach and Esophageal carcinoma
TGCT: Testicular Germ Cell Tumors
THCA: Thyroid carcinoma
THYM: Thymoma
UCEC: Uterine Corpus Endometrial Carcinoma
UCS: Uterine Carcinosarcoma
UVM: Uveal Melanoma
OS: Osteosarcoma
ALL: Acute Lymphoblastic Leukemia
NB: Neuroblastoma
WT: High-Risk Wilms Tumor
Author Contributions
LW, HJ, XL conceived the study, drafted the manuscript and performed the analysis. HZ revised the manuscript and finally approved the version to be published. All authors read and approved the final manuscript.
Funding
The authors received no financial support for the research, authorship, and/or publication of this article.
Declaration of Conflicting Interests
The authors declared no potential conflicts of interest with respect to the research, authorship, and/or publication of this article.
Data Availability Statement
All the datasets were open access datasets.
Supplemental Material
Supplemental material for this article is available online.
References
Supplementary Material
Please find the following supplemental material available below.
For Open Access articles published under a Creative Commons License, all supplemental material carries the same license as the article it is associated with.
For non-Open Access articles published, all supplemental material carries a non-exclusive license, and permission requests for re-use of supplemental material or any part of supplemental material shall be sent directly to the copyright owner as specified in the copyright notice associated with the article.