
Abstract
Objective:
Osteosarcoma (OS) is a rare and complex form of cancer that mostly affects children and adolescents. Pain is a common symptom for patients in OS which causes significant unhappiness and persistent aches. To date, there is minimal knowledge on the mechanisms underlying OS induced pain and few treatment options for patients. Previous genetic studies have demonstrated that the panel of four genes, artemin (ARTN), persephin (PSPN), glial cell line-derived neurotropic factor (GDNF), and neurturin (NRTN) are associated with the regulation of pain processing in OS and analgesic responses.
Methods:
In the present study, by utilising a scRNA-seq OS dataset, we aimed to measure the gene expression levels of four pain related genes, and compare them between the different cell types in human OS tissues and cell lines.
Results:
Within a complex and diverse range of cell types in OS tissues, including osteoblastic OS cells, carcinoma associated fibroblasts (CAFs), B cells, myeloid cells 1, myeloid cells 2, NK/T cells, plasmocytes, ARTN and NRTN genes had the highest expression in Osteoblastic OS cells, GDNF gene had a peak expression in carcinoma associated fibroblasts, and PSPN gene in endothelial cells. In addition, all four genes showed deferential pattern of expression in 16 OS cell lines.
Conclusion:
Future studies should investigate the potential to target deferentially expressed pain-related genes in specific cell types of OS for therapeutic benefit to improve the quality of life for patients living with pain caused by OS.
Introduction
Osteosarcoma (OS) also known as osteogenic sarcoma is a type of cancer that originates in osteoblast cells that form bone. OS can spread to distant sites in the body such as the lungs increasing chances of death. 1 It occurs primarily in children and young adults with an initial peak in the years 10 to 14 correlating with the pubertal growth spurt. 2 Blacks are the ethnic group most affected by OS followed by Hispanics and Whites, respectively. 2 The incidence of OS is higher in males than in females with an incidence of 5.4 cases per year per million and four cases per year per million, respectively. 2 In terms of its pathophysiology, OS most frequently occurs approximate to the metaphysis of long bones in the skeleton followed by the femur, tibia, and humerus, 2 and is divided into seven subtypes, including conventional OS (osteoblastic, chondroblastic, fibroblastic), telangiectatic OS, low-grade OS, small-cell OS, parosteal OS, periosteal OS, and high-grade surface OS. 1 The current treatment options for patients include surgery, chemotherapy, samarium, targeted therapy, and radiotherapy that are dependent on position, size and stage of the of the tumour. The five-year survival rate for OS is approximately 70%. 1 The quality of life of OS patients has improved over the last several decades. 2 However, our knowledge of the aetiology of OS is obscure. Besides, our understanding of the cellular and molecular mechanisms underlying OS pathogenic pain remains minimal.
ScRNA-seq is a recently developed genomic technique that allows researchers to measure the gene expression of each individual single cell in a tissue. 3 Previous scRNA-seq and bioinformatic studies by our group have shown that OS is highly heterogenous across patients and within the same tumour.4,5 Other labs have identified candidate genes involved in the development and progression of OS including mutations in tumour protein (TP53), Kirsten rat sarcoma virus (Kras), MYC, and retinoblastoma (Rb).6 -8 However, the expression of pain related genes have not been well elucidated in human OS tissues and cell lines.
Pain could be a dismal and emotional experience and is the most common symptom of OS metastases.9,10 The development of OS induced pain is complex and the mechanisms that maintain it are unclear. 11 For example, in a previous study, 91.6% of patients with metastatic bone disease experienced pain, with 36.2% reporting intense pain. 12 In the present study, we have sought to examine the expression of four genes that are associated with the regulation of pain processing and analgesic response in OS and other pathological conditions, including artemin (ARTN), persephin (PSPN), glial cell line-derived neurotropic factor (GDNF), and neurturin (NRTN).13,14 It is aimed that this study will improve our understanding of the pathological pain in OS.
Methods
GEO Database Analyses
Gene expression profile were compared using the GEO database with the dataset GSE42352, which consists of genome-wide gene expression profiling of different sources, including mesenchymal stem cells (MSCs), osteoblasts, OS cell lines, and OS biopsy.15,16 As previously described, 113 sets of normalised gene expression data of the OS biopsies and OS cell lines were defined as the tumour group. Fifteen sets of normalised gene expression data of MSCs and osteoblasts were defined as the normal group. 17 Student’s t-test, was performed and a P value < 2.2 × 10⁻¹⁶ value is considered statistically significant.
ScRNA-seq Data Collection
The OS scRNA-seq datasets were retrieved from previously published datasets. We analysed the GSE162454 datasets (available at https://www.ncbi.nlm.nih.gov/geo/query/acc.cgi?acc=GSE162454). 18 This dataset comprises 29 278 cells isolated from six primary tumour samples of OS patients. We proceeded by analysing four pain related genes in the single cells for subsequent analysis.
Cell Clustering and Differential Expression Analysis in OS Cells
We conducted cell clustering and visualisation using Uniform Manifold Approximation and Projection (UMAP) with the Dimplot function, setting the parameters to ‘dim=1:30’ and ‘resolution=0.10’. Colour adjustments were made using the ‘ggsci’ package (version 2.9). The scale was done according to the Seurat package process scale of data (https://satijalab.org/seurat/articles/pbmc3k_tutorial). The cell type definitions aligned with those from our earlier studies.5,18 Subsequently, we used the FeaturePlot function to display gene expression distribution. Expression level was measured in transcript per million (TPM).
Cell Quality Control
Data quality control was conducted using the same parameters from the Seurat package (version 3.2.1) as outlined in the author’s previous study. 18 In brief, to ensure high data quality, cells were filtered out if they had between 300 and 4500 expressed genes and a mitochondrial gene percentage greater than 10%. After this filtering process, 29 278 cells remained for the identification of differentially expressed genes (DEGs). Kruskal-Wallis test was performed and a P value < 2.2 × 10⁻¹⁶ value was considered statistically significant. Finally, the Harmony package (version 1.0; https://github.com/immunogenomics/Harmony) was utilised to integrate the data.
Cancer Cell Line Encyclopedia (CCLE) Dataset Analyses
Cancer cell lines are the most commonly used models for studying cancer biology, validating cancer targets and for defining drug efficacy. 19 Therefore, cancer Cell Line Encyclopedia (CCLE) dataset was used to obtain related gene expression in OS cell lines. The CCLE database has performed large-scale deep sequencing on 947 human cancer cell lines derived from more than 30 different tissue sources, integrating genetic information including DNA mutations, gene expression, and chromosomal copy numbers. 19
Kaplan-Meier Survival Analysis
Kaplan-Meier survival analysis was carried out by using R’s survival packages as described previously. 17 K–M < .05 was used as a cut-off criterion for the indication of a survival-related gene.
Results
Differential Expression of ARTN, GDNF, NRTN, and PSPN Based on the Human OS Dataset GSE42352
To compare the gene expression profile of ARTN, GDNF, NRTN, and PSPN between OS samples versus normal tissues, the gene expression plots were generated using the dataset GSE42352. The results showed that the ARTN, GDNF, and NRTN transcripts were found to be upregulated in human OS cells when compared with the control (Figure 1), whereas the expression of PSPN show no difference between human OS cells and the control.

Violin plots showing the gene expression levels of ARTN (A), GDNF (B), NRTN (C), and PSPN (D) in OS and normal tissues. The violin plots filling in red representing normal groups, and the blue plots represent OS groups. The y-axis indicates the expression level of the genes. By using Student’s t-test, P < .05 was considered statistically significant (***P < .001, ****P < .00001).
Cellular Landscape of the OS Tumour Cell Microenvironment
Our scRNA-seq obtained from results indicate that the cellular composition of OS includes myeloid cells 1, osteoblastic OS cells, NK/T cells, myeloid cells 2, osteoclasts, carcinoma-associated fibroblasts, plasmocytes, endothelial cells, and B cells (Figure 2).

Uniform Manifold Approximation and Projection (UMAP) depiction of scRNA-seq data showing the 9 main cell types in OS.
ARTN, GDNF, NRTN, and PSPN Gene Expression in Osteoblastic OS Cells Versus All Other OS Cells
The ARTN gene was highly expressed in osteoblastic OS cells (Figures 3 and 4). It was observed that the ARTN gene exhibited significant differential expression (DE) between Osteoblastic OS cells and NK/T cells (P-value = 1.816 × 10⁻²⁴). However, the ARTN gene did not show DE between osteoblastic OS cells and myeloid cells 2 (P-value = 2.43 × 10⁻¹³) and osteoblastic OS cells and plasmocytes (7.58 × 10⁻⁴). Additionally, there was no significant DE of the ARTN gene between osteoblastic OS cells and osteoclasts (P-value = 1.37 × 10⁻⁶) and Osteoblastic OS cells and endothelial cells (P-value= 2.76 × 10⁻²). Furthermore, the ARTN gene was not DE between osteoblastic OS cells and carcinoma-associated fibroblasts (P-value = 1). The ARTN gene was not DE between B cells and osteoblastic OS cells (P-value = 2.76 × 10⁻²).

Uniform Manifold Approximation and Projection (UMAP) plot showing the relative mRNA expression in TPM of ARTN (A), GDNF (B), NRTN (C), and PSPN (D) in the 9 main OS cell types.
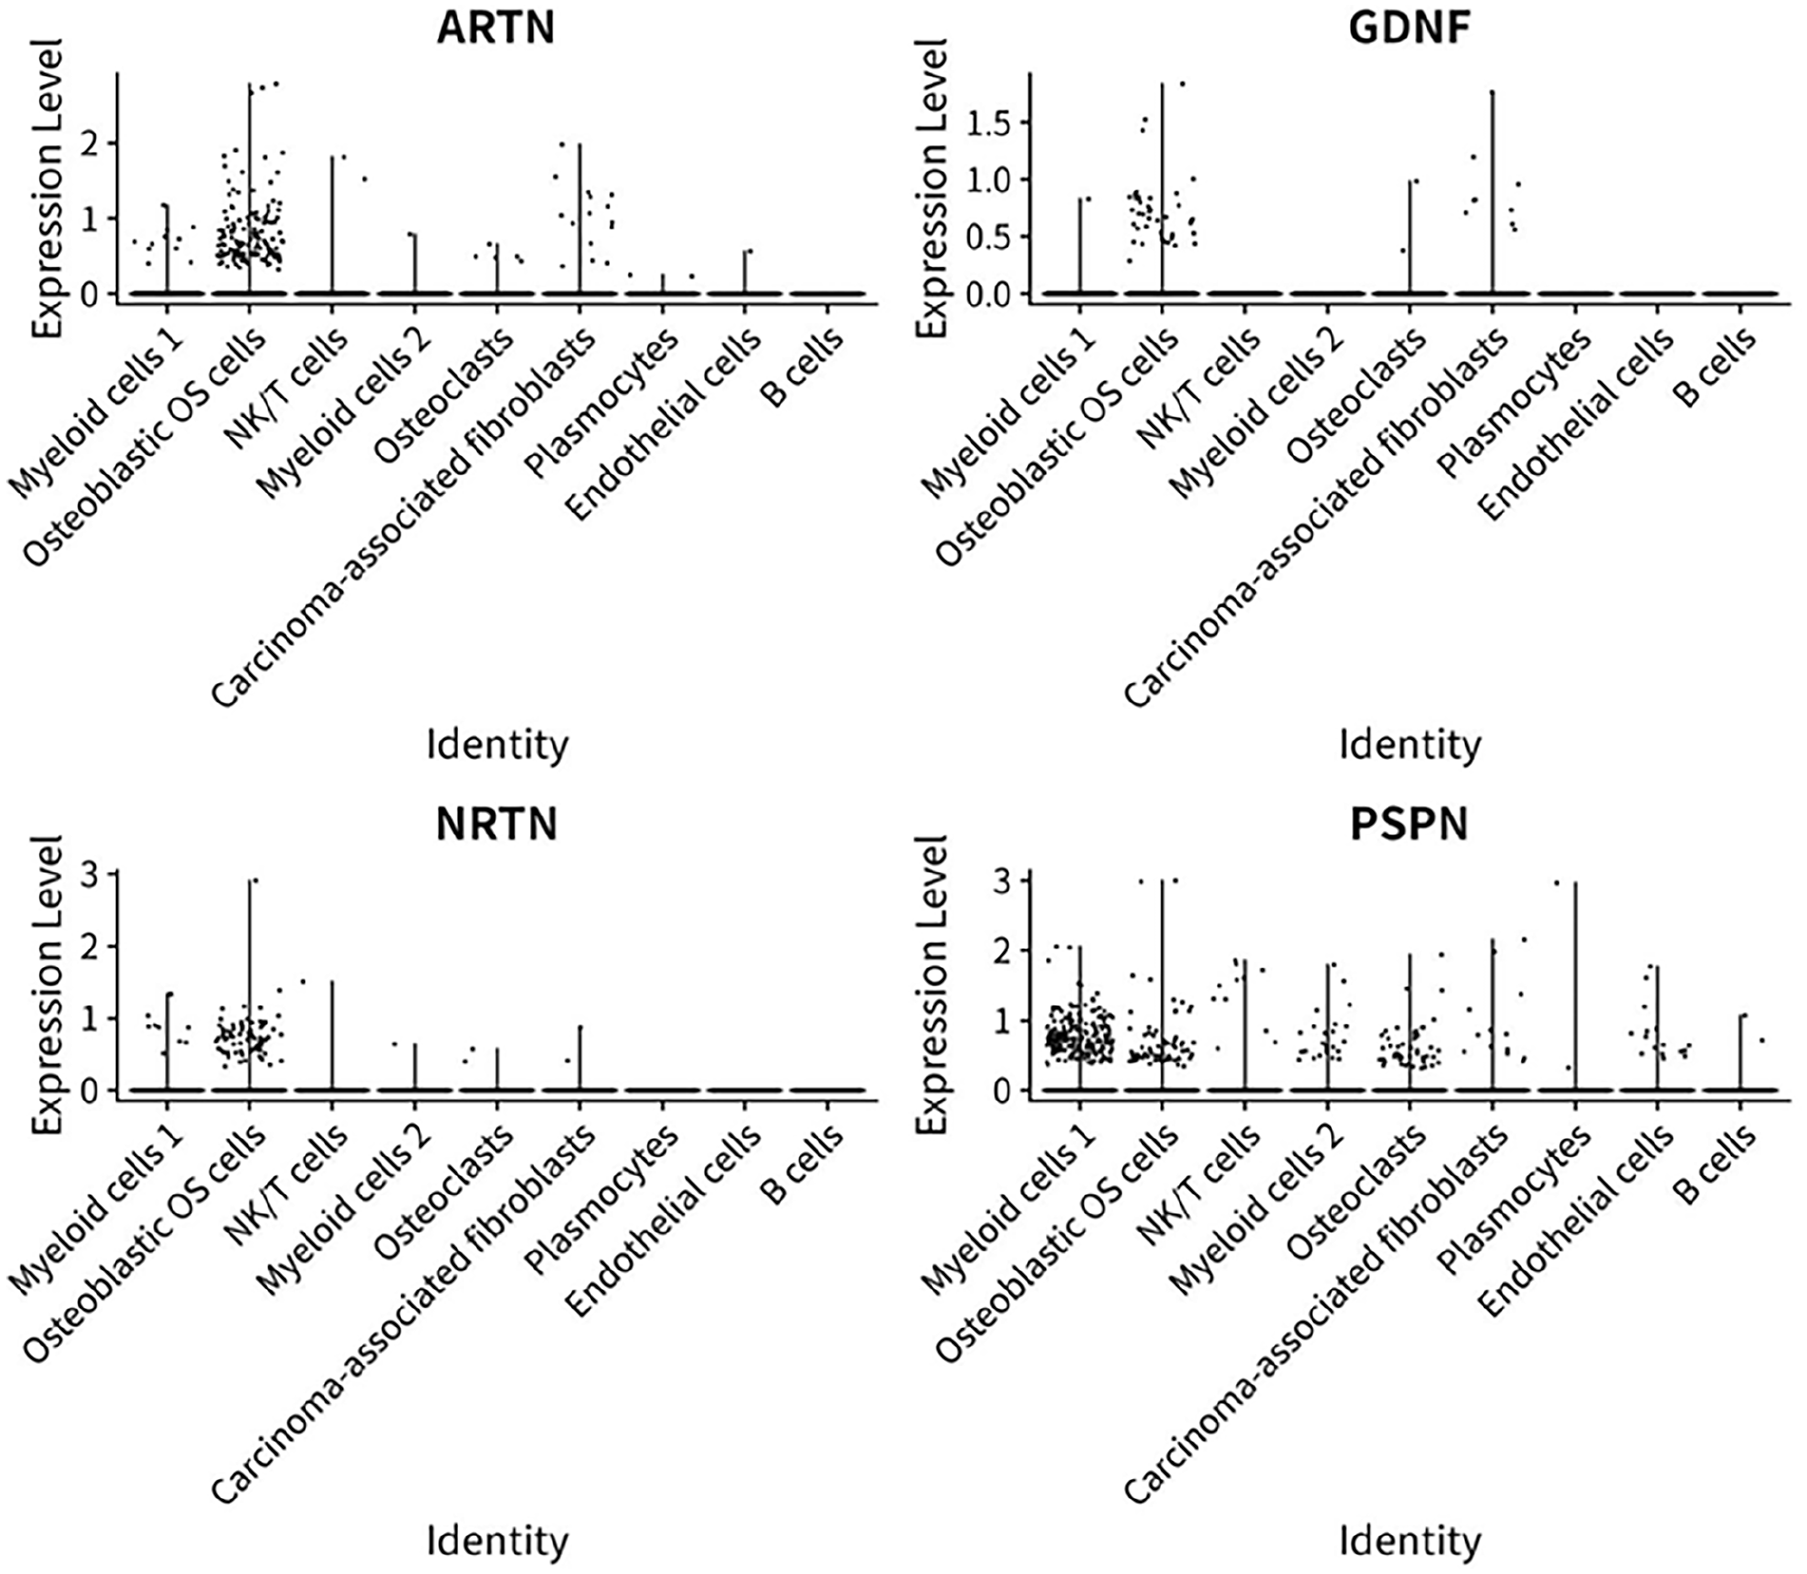
Dot plot displaying expression levels in TPM of four pain related genes in diverse OS cells.
Overall, our findings showed that the osteoblastic OS cells had low expression of GDNF (Figure 4). It was revealed that the GDNF gene exhibited no significant DE between osteoblastic OS cells and NK/T cells (P-value = 4.32 × 10⁻⁸). Moreover, the GDNF gene did not show DE between osteoblastic OS cells and myeloid cells 2 (P-value = 2.27 × 10⁻⁴) and osteoblastic OS cells and plasmocytes (1.7 × 10⁻⁴). Additionally, there was no significant DE of the GDNF gene between osteoblastic OS cells and osteoclasts (P-value = 7.39 × 10²) and osteoblastic OS cells and endothelial cells (P-value = 6.01 × 10⁻¹). Furthermore, the GDNF gene was not DE between osteoblastic OS cells and carcinoma-associated fibroblasts (P-value = 1). The GDNF gene was not DE between B cells and osteoblastic OS cells (P-value = 7.67 × 10⁻¹).
It appeared that the PSPN gene exhibited no significant DE between osteoblastic OS cells and NK/T cells (P-value = 6.56 × 10⁻⁷). Moreover, the PSPN gene did not show DE between osteoblastic OS cells and myeloid cells 2 (P-value = 1) and osteoblastic OS cells and plasmocytes (1.65 × 10⁻¹). Additionally, there was no significant DE of the PSPN gene between osteoblastic OS cells and osteoclasts (P-value = 2.27 × 10⁻⁵) and osteoblastic OS cells and endothelial cells (P-value = 6.75 × 10⁻³). Furthermore, the PSPN gene was not DE between osteoblastic OS cells and carcinoma-associated fibroblasts (P-value = 1). The PSPN gene was not DE between B cells and oteoblastic OS cells (P-value = 1).
The NRTN gene had the highest expression in osteoblastic OS cells compared with all other OS cell types (Figures 4 and 5). It was revealed that the NRTN gene exhibited no significant DE between osteoblastic OS cells and NK/T cells (P-value = 1.88 × 10⁻¹³). Moreover, the NRTN gene did not show DE between osteoblastic OS cells and myeloid cells 2 (P-value = 5.20 × 10⁷) and osteoblastic OS cells and plasmocytes (1.79 × 10⁻²). Additionally, there was no significant DE of the NRTN gene between osteoblastic OS cells and osteoclasts (P-value = 7.84 × 10⁻⁴) and osteoblastic OS cells and endothelial cells (P-value = 2.25 × 10⁻¹). Furthermore, the NRTN gene was not DE between osteoblastic OS cells and carcinoma-associated fibroblasts (P-value = 1). Finally, the NRTN gene was not DE between B cells and osteoblastic OS cells (P-value = 4.11 × 10⁻¹).
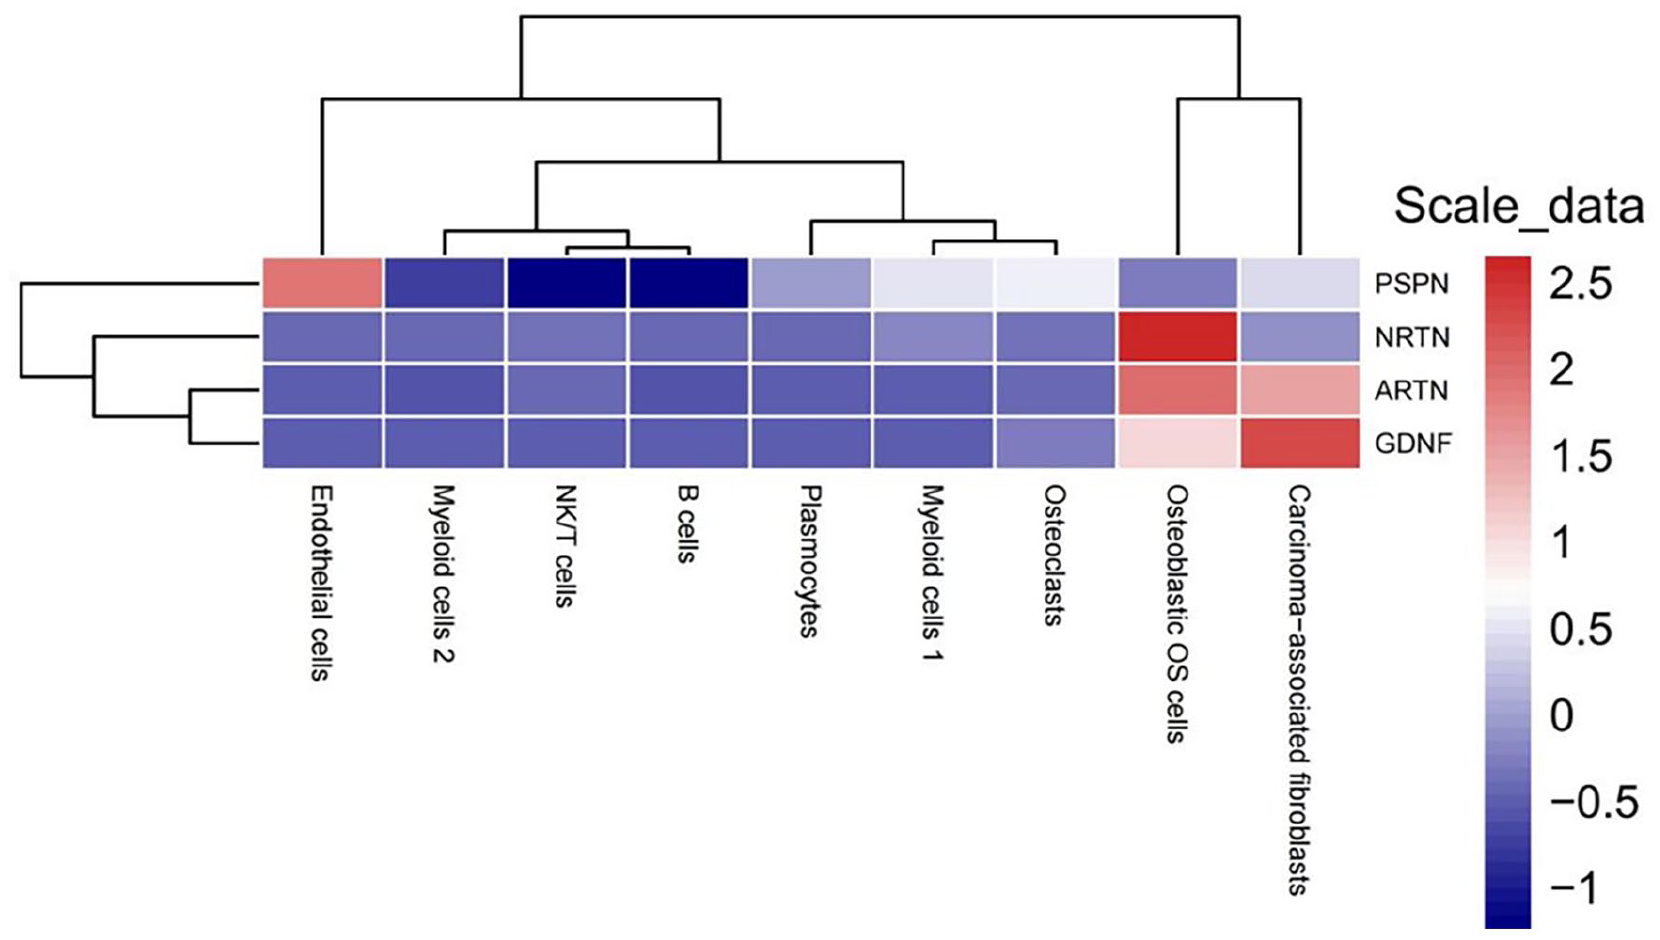
Heatmap displaying mRNA gene expression in TPM of four pain related genes PSPN, NRTN, ARTN, and GDNF in 9 OS cell types.
ARTN, GDNF, NRTN, and PSPN Gene Expression in Myeloid Cells 1 Versus All Other OS Cells
Our results showed that the ARTN gene exhibited significant DE between myeloid cells 1 and osteoblastic OS cells (P-value = 9.75 × 10−42). It was observed that the ARTN gene exhibited significant DE between myeloid cells 1 and NK/T cells (P-value = 1). However, the ARTN gene did not show DE between myeloid cells 1 and myeloid cells 2 (P-value = 1) and myeloid cells 1 and plasmocytes (P-value = 1). Additionally, there was no significant DE of the ARTN gene between myeloid cells 1 and osteoclasts (P-value = 1) and myeloid cells 1 and endothelial cells (p-value = 1). Furthermore, the ARTN gene was not DE between myeloid cells 1 and carcinoma-associated fibroblasts (P-value = 2.5 × 10⁻¹⁵). The ARTN gene was not DE between B cells and myeloid cells 1 (P-value 1).
Our results showed that the GDNF gene exhibited significant DE between myeloid cells 1 and osteoblastic OS cells (P-value = 7.76 × 10⁻¹⁵). It was observed that the GDNF gene exhibited significant DE between myeloid cells 1 and NK/T cells (P-value = 1.94 × 10⁻¹). However, the GDNF gene did not show DE between myeloid cells 1 and myeloid cells 2 (P-value = 1) and myeloid cells 1 and plasmocytes (P-value = 1). Additionally, there was no significant DE of the GDNF gene between myeloid cells 1 and osteoclasts (P-value = 1.94 × 10⁻¹) and myeloid cells 1 and endothelial cells (P-value = 1). Furthermore, the GDNF gene was not DE between myeloid cells 1 and carcinoma-associated fibroblasts (P-value = 1.5 × 10⁻¹⁶). The GDNF gene was not DE between B cells and myeloid cells 1 (P-value 1).
It was revealed that the PSPN gene exhibited no significant DE between myeloid cells 1 and osteoblastic OS cells (P-value = 3.94 × 10⁻⁴). We observed that the GDNF gene exhibited significant DE between myeloid cells 1 and NK/T cells (P-value = 3.12 × 10⁻¹⁷). However, the GDNF gene did not show DE between myeloid cells 1 and myeloid cells 2 (P-value = 2.83 ×10⁻³) and myeloid cells 1 and plasmocytes (P-value = 2.34 × 10⁻³). Additionally, there was no significant DE of the GDNF gene between myeloid cells 1 and osteoclasts (P-value = 7.611 × 10⁻¹) and myeloid cells 1 and endothelial cells (P-value = 1). Furthermore, the GDNF gene was not DE between myeloid cells 1 and carcinoma-associated fibroblasts (P-value = 9.7 × 10⁻¹). The GDNF gene was not DE between B cells and myeloid cells 1 (P-value = 2.6 × 10⁻¹).
It appeared that the NRTN gene exhibited significant DE between myeloid cells 1 and osteoblastic OS cells (P-value = 2.38 × 10⁻²⁰). It was observed that the NRTN gene exhibited no significant DE between myeloid cells 1 and NK/T cells (P-value = 1). However, the NRTN gene did not show DE between nyeloid cells 1 and myeloid cells 2 (P-value = 1) and myeloid cells 1 and plasmocytes (P-value = 1). Additionally, there was no significant DE of the NRTN gene between myeloid cells 1 and osteoclasts (P-value = 1) and myeloid cells 1 and endothelial cells (P-value = 1). Furthermore, the NRTN gene was not DE between myeloid cells 1 and carcinoma-associated fibroblasts (P-value = 1). The NRTN gene was not DE between B cells and myeloid cells 1 (P-value = 1).
ARTN, GDNF, NRTN, and PSPN Gene Expression in Myeloid Cells 2 Versus Other OS Cells
Our results showed that the ARTN gene exhibited significant DE between myeloid cells 2 and osteoclasts (P-value = 8.21 × 10⁻⁵). It was observed that the ARTN gene exhibited significant DE between myeloid cells 2 and carcinoma-associated fibroblasts (p-value = 1). However, the ARTN gene did not show DE between plasmocytes and myeloid cells 2 (P-value = 4.15 × 10⁻¹) and myeloid cells 2 and endothelial cells (P-value = 3.11 × 10⁻³). Additionally, there was no significant DE of the ARTN gene between myeloid cells 2 and B cells (P-value = 1).
Our results showed that the GDNF gene exhibited significant DE between myeloid cells 2 and osteoclasts (P-value = 7.73 × 10⁻¹). It was observed that the GDNF gene exhibited significant DE between myeloid cells 2 and carcinoma-associated fibroblasts (P-value = 2.95 × 10⁻⁵).
Our results showed that the PSPN gene exhibited significant DE between myeloid cells 2 and osteoclasts (P-value = 8.21 × 10⁻⁵). It was observed that the PSPN gene exhibited significant DE between myeloid cells 2 and carcinoma-associated fibroblasts (P-value = 1). However, the PSPN gene did not show DE between plasmocytes and myeloid cells 2 (P-value = 4.15 × 10⁻¹) and myeloid cells 2 and endothelial cells (P-value = 3.11 × 10⁻³). Additionally, there was no significant DE of the PSPN gene between myeloid cells 2 and B cells (P-value = 1).
It appeared that the NRTN gene exhibited no significant DE between myeloid cells 1 and osteoblastic OS cells (P-value = 1). It was observed that the NRTN gene exhibited no significant DE between myeloid cells 1 and NK/T cells (P-value = 1). However, the NRTN gene did not show DE between myeloid cells 1 and myeloid cells 2 (P-value = 1) and myeloid cells 1 and plasmocytes (P-value = 1). Additionally, there was no significant DE of the NRTN gene between myeloid cells 1 and osteoclasts (P-value = 1) and myeloid cells 1 and endothelial cells (P-value = 1). Furthermore, the NRTN gene was not DE between myeloid cells 1 and carcinoma-associated fibroblasts (P-value = 1). The NRTN gene was not DE between B cells and myeloid cells 1 (P-value = 1).
ARTN, GDNF, NRTN, and PSPN Gene Expression in Osteoclasts Versus Other OS Cells
Our results showed that the ARTN gene exhibited no significant DE between plasmocytes and osteoclasts (P-value = 1). It was observed that the ARTN gene exhibited no significant DE between osteoclasts and endothelial cells (P-value = 1). The ARTN gene did not show DE between osteoclasts and B cells (P-value = 1). The ARTN gene was not DE between osteoclasts and carcinoma associated fibroblasts (P-value = 1.43 × 10⁻²).
Our results showed that the GDNF gene exhibited no significant DE between plasmocytes and osteoclasts (P-value = 1). It was observed that the GDNF gene exhibited no significant DE between osteoclasts and endothelial cells (P-value = 1). However, the GDNF gene did not show DE between osteoclasts and B cells (P-value = 1). The GDNF gene was not DE between osteoclasts and carcinoma associated fibroblasts (P-value = 4.81 × 10⁻²).
Our results showed that the NRTN gene exhibited no significant DE between plasmocytes and osteoclasts (P-value = 1). It was observed that the NRTN gene exhibited no significant DE between osteoclasts and endothelial cells (P-value = 1). However, the NRTN gene did not show DE between osteoclasts and B cells (P-value = 1). The NRTN gene was not DE between osteoclasts and carcinoma associated fibroblasts (P-value = 1.43 × 10⁻²).
Our results showed that the PSPN gene exhibited no significant DE between plasmocytes and osteoclasts (P-value = 1.059 × 10⁻⁴). We observed that the PSPN gene exhibited no significant DE between osteoclasts and endothelial cells (P-value = 1). However, the PSPN gene did not show DE between osteoclasts and B cells (P-value = 6.398 × 10²). The PSPN gene was not DE between osteoclasts and carcinoma associated fibroblasts (P-value = 1.61 × 10⁻¹).
ARTN, GDNF, NRTN, and PSPN Gene Expression in Carcinoma-Associated Fibroblasts Versus All Other OS Cells
The GDNF gene had the highest expression in carcinoma-associated fibroblasts compared with all other OS cell types (Figure 5). Our results showed that the ARTN gene exhibited no significant DE between plasmocytes and carcinoma associated fibroblasts (P-value = 8.183 × 10⁻²). It was observed that the ARTN gene exhibited no significant DE between carcinoma associated fibroblasts and endothelial cells (P-value = 3.76 × 10⁻¹). The ARTN gene did not show DE between carcinoma associated fibroblasts and B cells (P-value = 2.29 × 10⁻¹).
Our results showed that the GDNF gene exhibited no significant DE between plasmocytes and carcinoma associated fibroblasts (P-value = 8.12 × 10⁻²). It was observed that the GDNF gene exhibited no significant DE between carcinoma associated fibroblasts and endothelial cells (P-value = 4.11 × 10⁻¹). the GDNF gene did not show DE between carcinoma associated fibroblasts and B cells (P-value = 2.29 × 10⁻¹).
Our findings demonstrated that the NRTN gene exhibited no significant DE between plasmocytes and carcinoma associated fibroblasts (P-value = 1). It was observed that the NRTN gene exhibited no significant DE between carcinoma associated fibroblasts and endothelial cells (P-value = 1). The NRTN gene did not show DE between carcinoma associated fibroblasts and B cells (P-value = 1).
Our results showed that the PSPN gene exhibited no significant DE between plasmocytes and carcinoma associated fibroblasts (P-value = 1.611 ×10⁻¹). We observed that the PSPN gene exhibited no significant DE between carcinoma associated fibroblasts and endothelial cells (P-value = 2.7 × 10⁻¹). The PSPN gene did not show DE between carcinoma associated fibroblasts and B cells (P-value = 1).
ARTN, GDNF, NRTN, and PSPN Gene Expression in Plasmocytes Versus Other OS Cells
Our results showed that the ARTN gene exhibited no significant DE between plasmocytes and endothelial cells (P-value = 1). It was observed that the ARTN gene exhibited no significant DE between plasmocytes and B cells (P-value = 1).
It was revealed that the PSPN gene exhibited no significant DE between plasmocytes and endothelial cells (P-value = 1.30 × 10⁻⁴). We observed that the PSPN gene exhibited no significant DE between plasmocytes and B cells (P-value = 1).
ARTN, GDNF, NRTN, and PSPN Gene Expression in Endothelial Cells Versus All Other OS Cells
The ARTN gene had the highest expression in endothelial cells compared with all other OS cell types (Figure 5). Our results showed that the ARTN gene exhibited no significant DE between B cells and endothelial cells (P-value = 1). It was found that the ARTN gene exhibited no significant DE between B cells and endothelial cells (P-value = 6.4 × 10⁻²).
Expression Level of ARTN, GDNF, PSPN, and NRTN Genes in 16 OS Cell Lines
OS has many subtypes, and different subtypes of OS display various histopathological patterns and clinical behaviour and would have different tumour microenvironment and gene expression profile. 1 Using 16 Cancer Cell Line Encyclopedia (CCLE) datasets of OS cell lines, we showed varying expression levels for the four pain-associated genes (ARTN, GDNF, NRTN, and PSPN; Figure 6). Specifically, the GDNF gene had the highest expression level of 4.24 in the G292CLONEA141B1 cell line (Figure 6). The NRTN gene was most highly expressed at 2.6 in the SISA1 cell line. The ARTN gene reached its peak expression of 1.8 in the HOS cell line. Lastly, the PSPN gene had its highest expression of 2.4 in the OS052 cell line (Figure 6).

Genes expression in Cancer Cell Line Encyclopedia (CCLE) datasets. Bar plot displaying mRNA gene expression in TPM of four pain related genes (PSPN, NRTN, ARTN, and GDNF) in 16 OS cell lines.
Survival Analysis of ARTN, GDNF, PSPN, and NRTN Gene Expression in OS
We then compared survival in OS patients based on the four genes. Our results showed that all four genes were not statistically significant in their association with overall OS patient survival (Figure 7A-D). We found OS patients with lowest survival expressing the NRTN gene (Figure 7C). The expression of PSPN in OS patients showed overall highest survival (Figure 7D).

Plots of Kaplan-Meier analysis of the survival rate of OS patients with the expression levels of ARTN (A), GDNF (B), NRTN (C), and PSPN (D) genes. Red colour represents genes with high expression, whereas blue colour represents genes with low expression. No significant difference in survival probability was found between high and low expression of these genes in OS patients.
Discussion
OS is rare and aggressive bone tumour that is most common in children and young adults. Our understanding of the OS tumour microenvironment is lacking and treatment for the management of OS pain is an unmet clinical need. 20 In this study, we have measured and compared the gene expression level of four pain related genes in diverse OS cells using scRNA seq bioinformatic analyses. Myeloid cells 1 is the main cell type found in the OS tumour microenvironment followed by osteoblastic OS cells, NK/T cells, myeloid cells 2, osteoclasts, carcinoma associated fibroblasts, plasmocytes, endothelial cells, and B cells, respectively. Notably, we observed that the ARTN gene had the highest expression in osteoblastic OS cells (Figure 4). The GDNF gene had the highest expression in carcinoma associated fibroblasts (Figure 4). The NRTN gene also had the highest expression in osteoblastic OS cells (Figure 4). PSPN gene exhibited the highest expression in endothelial cells (Figure 4).
The ARTN gene, also known as artemin, is a member of GDNF family of ligands. 14 This gene encodes a protein that plays a significant role in neurodevelopment and various cellular processes. 14 In cancer, ARTN has been shown to promote tumour growth, metastases, and drug resistance. 14 Our study showed that the ART gene was highly expressed in osteoblastic OS cells in OS tumours (Figure 4), suggesting that ARTN gene expression in osteoblastic OS cells might be involved in OS pain.
GDNF is a neurotrophic factor traditionally known for its role in the development and maintenance of the nervous system.21,22 Recent research has expanded its relevance to oncology, particularly in OS. 23 In the context of OS, GDNF has an emerging role in tumour growth, treatment resistance, and pain.13,22,24 Studies have shown that GDNF can influence OS cell proliferation, survival, and metastasis. The interaction between GDNF and its receptor, GFRα1, may affect tumour cell behaviour and contribute to the aggressive nature of OS. 24 This signalling pathway has been linked to increased tumour cell viability and resistance to apoptosis, which can exacerbate the disease. Furthermore, GDNF’s role in OS suggests potential therapeutic strategies. Targeting the GDNF/GFRα1 signalling axis could offer new avenues for treatment, aiming to inhibit tumour growth and improve patient outcomes. In the present study, we have found that GDNF gene was highly expressed in carcinoma associated fibroblasts among a diverse range of OS cells. Understanding the mechanistic involvement of GDNF in OS could provide valuable insights into developing novel targeted therapies and enhancing current treatment regimens.
The NRTN gene encodes neurturin that is closely related to GDNF. 13 Neurturin, like GDNF, plays a significant role in neuronal survival and development. 25 Emerging research has highlighted its relevance beyond neurobiology, particularly in oncology, where its expression, and function are being investigated in OS. In OS, NRTN has been found to influence tumour behaviour, progression and pain. 13 Studies suggest that NRTN can impact OS cell proliferation, migration, and survival, potentially contributing to the aggressive nature of the disease. The NRTN gene’s product exerts its effects through interaction with the GFRα2 receptor and the Ret tyrosine kinase, pathways that are also implicated in the pathology of OS. 24 The involvement of NRTN in OS indicates its potential as a biomarker for tumour progression and a target for therapeutic intervention. 24 By modulating the NRTN/GFRα2/Ret signalling axis, it might be possible to develop novel strategies to inhibit tumour growth and improve treatment outcomes for patients with OS. 24 Understanding the role of the NRTN gene in OS provides important insights into the tumour’s molecular mechanisms and opens avenues for targeted therapies aimed at disrupting its growth and spread.
The PSPN gene encodes a protein that is involved in various cellular processes including growth, survival, and differentiation.24,26 In the context of OS, PSPN has emerged as a significant factor influencing tumour behaviour and pain. 13 Research has shown that PSPN is often overexpressed in OS tissues compared to normal bone tissues. This overexpression is associated with increased tumour cell proliferation, enhanced invasion, and poor clinical outcomes. 24 The role of PSPN in OS suggests that it may act as a potential biomarker for diagnosis and prognosis. Additionally, targeting PSPN or its associated pathways could offer new therapeutic strategies for combating OS induced pain. In our research, we showed that PSPN was not significantly DE between the different OS cells. In addition, PSPN gene was highly expressed in endothelial cells and lowly expressed in NK/T cells and B cells (Figure 4), suggesting its potential role in the angiogenesis of OS.
Previous findings demonstrate osteoclast-induced bone destruction plays a role in bone cancer pain. 27 The tumour can also invade or compress nearby peripheral nerves, causing pain through direct nerve involvement. 28 In cases of metastatic disease, especially when the tumour spreads to internal organs (eg, lungs), visceral pain may also develop. 29 Further research is required to determine the precise mechanism of action related to neuropathic pain, such as rearrangement during transfection (RET) tyrosine kinase receptor signalling pathway.30,31
Conclusion
In summary, this paper investigates the expression of four pain related genes in OS tissues and OS cell lines, and predict their role in associate with OS pain and survival. Our results show that the panel of four genes, PSPN, NRTN, GDNF, and ARTN genes are DE between some OS cells, however a majority of the genes were not DE in these cells. ARTN and NRTN genes are expressed most abundantly in osteoblastic OS cells, GDNF in carcinoma associated fibroblasts, and PSPN in endothelial cells. Further research into mechanistic insights into pain-related genes is crucial for improving the quality of life of OS patients in order to manage severe pain and suffering experienced during disease progression. For instance, preclinical studies using human OS cell lines to inhibit the pain genes in mice would be employed to confirm their effects in vivo, thus paving the way for therapeutic development of OS using these targets.
Footnotes
Author Contributions
MF and WF contributed to the preparation of paper. MF, WF, HL, ML, ER, DS contributed figure construction, and data analyses. JZ, YL, and JX discussed and revised the paper. YL and JX supervised the studies and data collections and revised paper.
Funding
The author(s) disclosed receipt of the following financial support for the research, authorship, and/or publication of this article: This study was supported by the Natural Science Foundation of Guangxi Province (grant number: 2024GXNSFBA010318); Youth Science Foundation of Guangxi Medical University (grant number: GXMUYSF202313), Self-funded Research Project of Guangxi Health Commission (grant number: Z-A20230681). It is partly supported by Sock it to Sarcoma. DS and YL were visiting scholars to the University of Western Australia.
Conflicting Interests
The author(s) declared no potential conflicts of interest with respect to the research, authorship, and/or publication of this article.
Data Availability
The data that support the findings of this study are available from the corresponding author upon reasonable request.