
Abstract
Extensive data research is helpful to find sensitive biomarkers for prognostic prediction of metastatic breast cancer. Through analyzing multiple GEO datasets, literature retrieval, and verified in GEPIA datasets, we identify BIRC5 (Baculoviral IAP repeat containing 5) and CDO1 (Cysteine dioxygenase type 1) as DEGs (differentially expressed genes) between breast tumor and normal tissue and DEGs between metastatic breast cancer and breast cancer in situ. Then, we performed a series of in silico studies on BIRC5 and CDO1 using online tools including the UALCAN, TIMER, TCGA-BRCA, LinkedOmics Kaplan-Meier Plotter, and an R script for analysis. To verify the association of 2 genes expression and patients’ clinical data, we detected BIRC5 and CDO1 mRNA in the tissue of 48 breast cancer patients. The results showed the tumor with BIRC5high CDO1low expression generally indicated patients’ shorter overall (OS) and relapse-free survival (RFS). Specifically, BIRC5 and CDO1 levels significantly affect OS or RFS in patients with Lymph node metastasis and molecular subtypes of TNBC (triple-negative breast cancer) and Luminal A. A BIRC5high tumor displayed a purer tumor purity and expressed more KIR receptors on NK cells while activating more FOXP3+CD25+ Treg cells. The CDO1low tumors infiltrated with more immunocytes leading to less tumor purity. In our verified experiment, BIRC5 mRNA level in patients with stage III and over was significantly higher than in patients with stage 0 to II, but there were no significant differences among molecular subtyping groups; TNBC tissue expressed lower CDO1 mRNA level than HER2+ and Luminal type cancer tissue. In conclusion, a BIRC5high CDO1low expression type in breast cancer tissue indicates a poorer prognosis of patients. The potential mechanism might be increased BIRC5 expression in cancer tissue is likely to accompany NK cells inhibition, activating more Treg cells, and lacking effective CD8+ T cells proliferation. Meanwhile, CDO1 level is positively related to more immunocytes infiltration.
Introduction
Breast cancer seriously harms women’s health worldwide. It is a highly heterogeneous disease, categorized into at least 5 subtypes based on their gene expression profiles. Despite the average 5-year prognosis for breast cancer is 89%, but breast cancer remains one of the leading causes of cancer-related death in women. 1 One reason for this is that distant metastasis may be found in some newly diagnosed patients, and many women may relapse as the disease progresses. 2 Thus, it is necessary to find effective biomarkers associated metastasis and prognosis for breast cancer patients to access curative treatment.
BIRC5 and CDO1 have been reported in various human cancers.3-9 They are significantly correlated with cell apoptosis, metastasis, and invasion. The BIRC5 protein is a member of the inhibitor of apoptosis (IAP) family and exerts its effects by directly inhibiting caspases.10,11 It plays an essential role in both the regulation of cell division and in the inhibition of apoptosis. CDO1, a non-heme structure of iron-containing metalloenzyme, which converts cysteine to cysteine sulfonic acid (CSA), can inhibit breast cancer cells from producing glutathione, resulting in the formation of reactive oxygen species (ROS) and cell apoptosis. 8 Moreover, the methylation of the CDO1’s promoter region was reported in many types of cancer, especially in the stomach, esophagus, and colon cancer.7,12,13 The interaction between the 2 genes and the immunocytes in breast cancer’s Tumor Micro-Environment (TME) is rarely examined systemically.
By performing in silico studies, this work was to verify the prognostic value of BIRC5 and CDO1 in breast cancer, exploring the potential mechanism of BIRC5 and CDO1 correlated survival differences of patients.
Materials and Methods
Overall workflow
The overall analysis workflow of this study is illustrated in Figure 1.
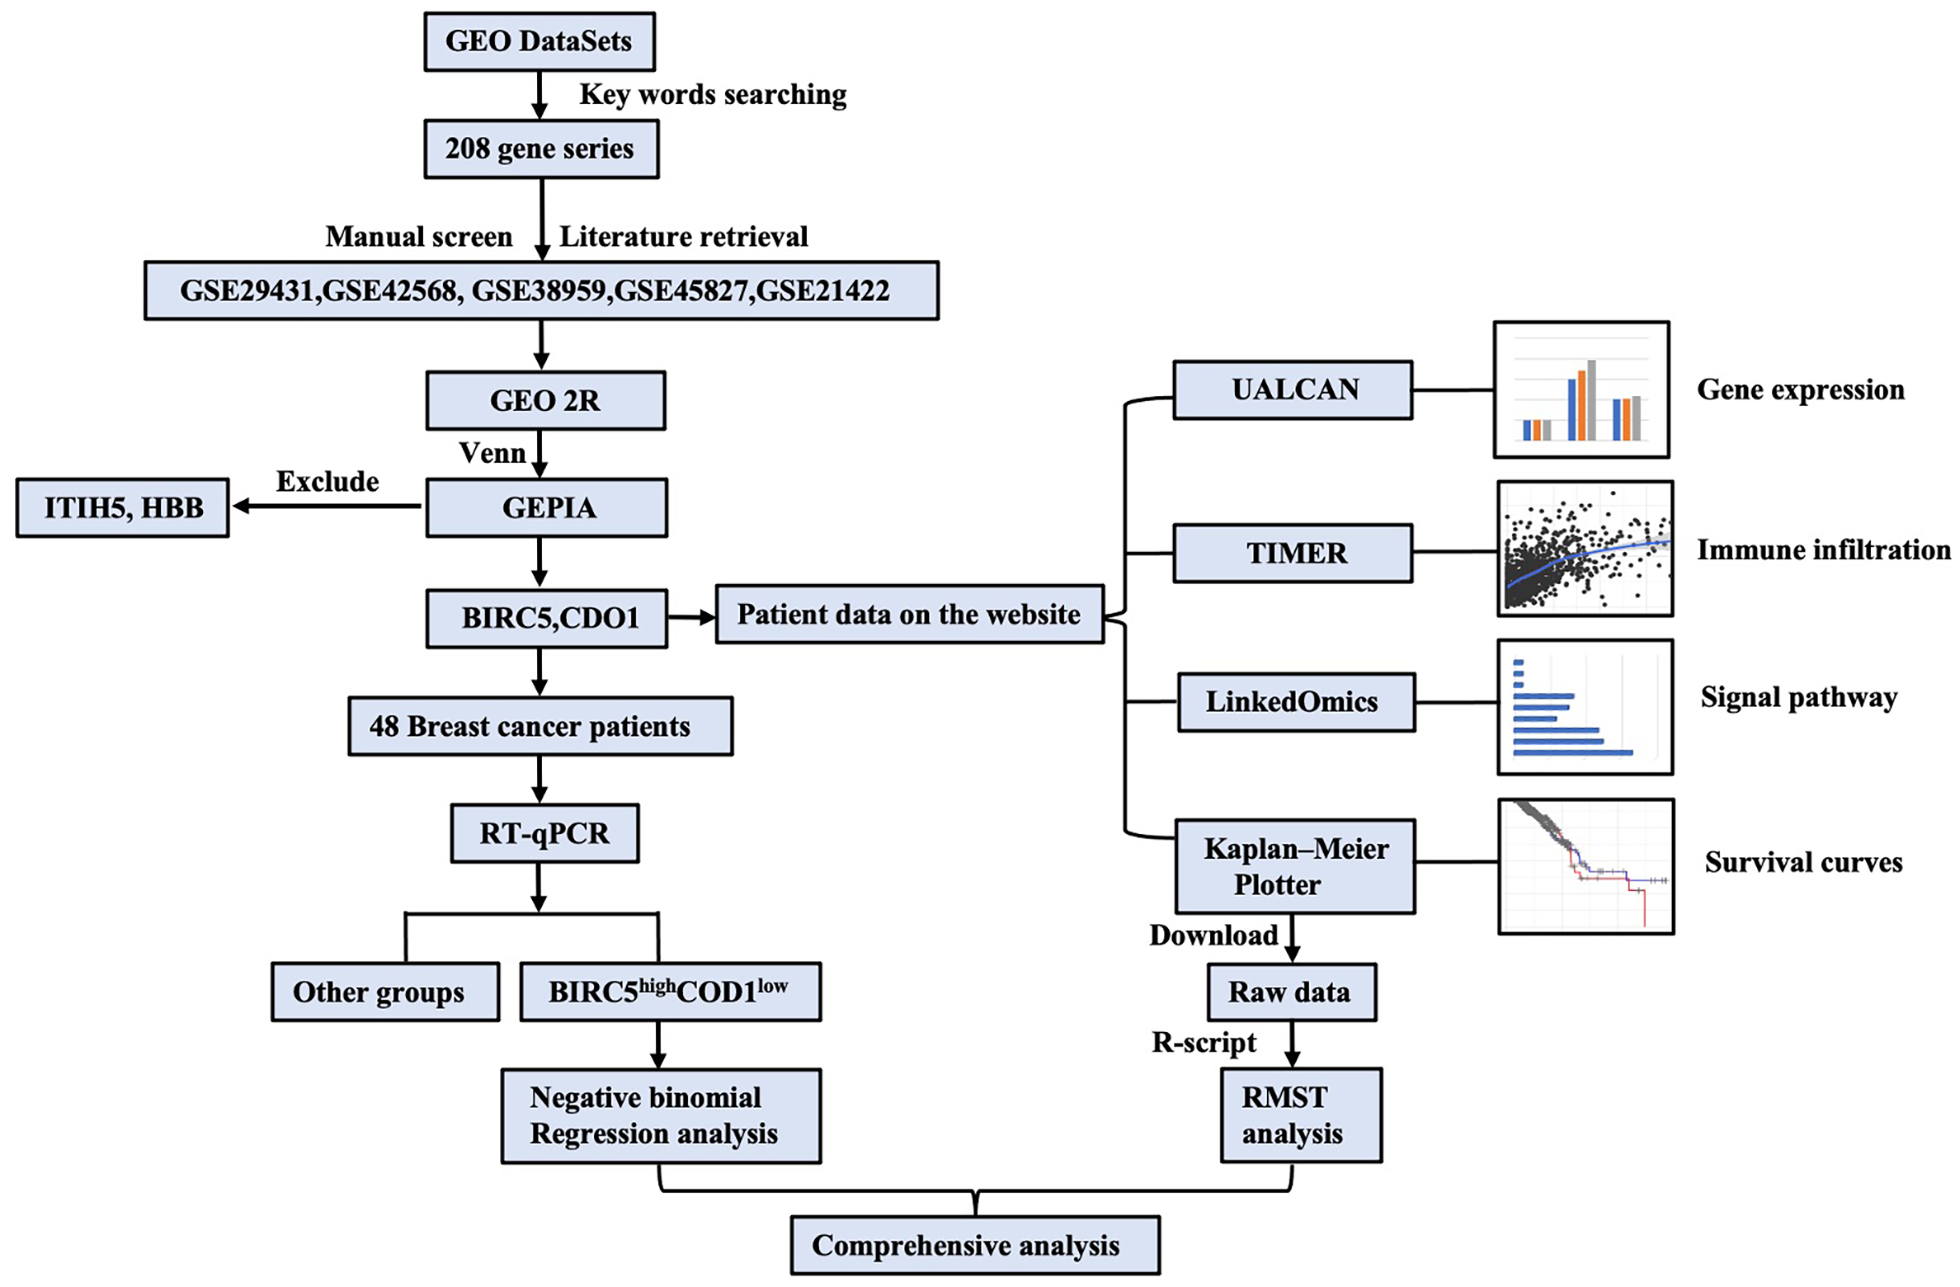
Overall workflow.
Data mining from GEO (Gene Expression Omnibus)
By searching keywords of “breast cancer,” “metastases,” and “homo sapiens” on the GEO datasets (https://www.ncbi.nlm.nih.gov/gds/) and followed by a literature retrieval, we screened and downloaded datasets of GSE29431, 14 GSE42568, 15 GSE38959, 16 GSE45827, 17 and GSE2142218,19 for this study. Then we used GEO2R 20 (https://ncbi.nlm.nih.gov/geo/geo2r/) to analyze datasets. Genes that met cutoff criteria, |logFC| > 2.0 (Log2 fold change, logFC > 2.0 considered as an up-regulated gene, and LogFC < −2.0 considered down-regulated) and statistical analysis show P < .05 were considered DEGs. The DEGs across the above 5 datasets were identified using the Venn diagram webtool (bioinformatics.psb.ugent.be/webtools/Venn/).
Analysis of DEGs
The Venn diagram showed the BIRC5 was the only up-regulated gene, and ITIH5, HBB, and CDO1 were down-regulated genes in the intersection part of 5 datasets. Subsequently, we analyzed the 4 genes on the GEPIA, http://gepia.cancer-pku.cn/. 21 Genes BIRC51, which had significant differences in breast cancer and tissue adjacent to carcinoma, were selected. Among the 3 down-regulated genes, the standardized N/T ratio of CDO1 is much higher than that of ITIH5 and HBB. Hence, we select CDO1, ITIH5, and HBB were excluded in the following study. Next, we used UALCAN to analyze the relationship between mRNA expression of BIRC5 and CDO1 and clinical staging of AJCC-TNM in breast cancer patients. 22 Furthermore, the information on tumor immune estimation was obtained from the TIMER database (https://cistrome.shinyapps.io/timer/) 23 and followed by some relevant literature retrieval. 24 We analyzed the correlation of BIRC5 or CDO1 mRNA levels with infiltrated immune cells and immune markers of various immune cells in breast cancer tissue.
Survival study
To access the effect of BIRC5 and CDO1 on outcomes of systemically untreated breast cancer patients, we used the Kaplan-Meier plotter online tool (http://kmplot.com/analysis/)25-27 to plot survival curves of BIRC5 and CDO1 associated OS or RFS. We calculated the RMST (restricted mean survival time), life expectancy difference (LED), and life expectancy ratio (LER) 28 through an additional R script (supp1) under R (version 4.1.2) (Supplemental Material 1). To evaluate the effects of both genes’ levels on patients’ OS and RFS in patients with different clinic subtypes, we downloaded raw data (TXT) to perform a 2-way ANOVA test with Bonferroni correction.
Gene set enrichment analysis (GSEA)
To explored biological processes and signalling pathways that BIRC5 and CDO1 may be involved in breast cancer, we performed GSEA analysis on BIRC5 and CDO1 genes in the TCGA-BRCA dataset (n = 784) using the online tool LinkedOmics (http://www.linkedomics.org/login.php). 29 Differentially expressed genes associated with BIRC5 and CDO1 were screened, and the Pearson correlation coefficient was used to test the correlation of the results.
RT-qPCR and clinical data studies
Forty-eight patients with breast cancer were collected from the Hubei Tumor Hospital. For each patient, we collected clinical data of cancer staging, tumor molecular subtyping, and number of lymph node metastasis. Tumor tissues were ground in Trizol solution (TaKaRa Bio Inc., Shiga, Japan) respectively to extract RNA and reverse transcription (Vazyme Biotech, Nanjing, China), then the mRNA expressions of BIRC5 and CDO1 in the tumor tissues were detected by RT-qPCR. Analysis of relative gene expression data using real-time quantitative PCR and the 2−ΔΔCq method. 30 The median of BIRC5 and CDO1 mRNA expression were refer to 0.582 and 35.257, which were obtained from the UALCAN. We defined high expression level as above the median and low expression as expression below the median. Patients was classified into the BIRC5high COD1low expression type group (tumor tissue expressed high level of BIRC5 and low level of CDO1) and other groups according to the median of BIRC5 and CDO1 expressions. The association between BIRC5high CDO1low type tumor and number of lymph node metastasis of patients was assessed by negative binomial regression. This study was performed with ethical review and approval by the Ethics Committee of Wuhan University, School of Basic Medical of Science.
Statistical analysis
Statistical analysis was majorly performed with SPSS version 20.0 (IBM Corp., Armonk, NY, USA). The t-test was used to compare BIRC5 and CDO1 in cancer and normal tissues and to analyze BIRC5 and CDO1 expression differences between different clinical stages and molecular subtypes of breast cancer, and the bars represent the means ± SE. We use the Spearman rank correlation test to investigate the correlation between BIRC5 and CDO1 and immunocytes infiltration level, using the R (version 4.1.2) and R package “survRM2” and “survival” to conduct the statistical analysis of RMST, LED, and LER. The Pearson correlation test tested the correlation of BIRC5 and CDO1 to potential related cellular biological processes. The negative binomial regression tested the correlation of BIRC5high CDO1low expression type to the number of lymph node metastasis of patients; P < .05 indicates statistical significance.
Results
Identification of the Hub gene
We choose 5 gene expression profiles for this study, which contained GSE29431, GSE42568, GSE38959, GSE45827, and GSE21422. As is shown in Table 1, GSE38959 contains 30 TNBC breast cancer samples, and GSE21422 contains 9 samples for carcinoma in situ of the breast and 5 samples for invasive breast cancer. For the GSE29431, GSE42568, GSE38959, and GSE45827, we identified hub genes by comparing breast cancer tissue and non-tumor breast specimen. For the GSE21422, we screened hub genes by comparing carcinoma in situ and invasive breast cancer specimens. By analyzing with GEO2R and follow by manual selection, we screened a total of 668 hub genes from GSE29431, within 102 up-regulated genes and 564 down-regulated genes; 1104 hub genes from GSE42568, within 454 up-regulated genes and 650 down-regulated genes; 812 hub genes from GSE38959, within 487 up-regulated genes and 325 down-regulated genes; 2749 hub genes from GSE45827, within 1919 up-regulated genes and 830 down-regulated genes; and 40 hub genes from GSE21422, including 12 up-regulated genes and 28 down-regulated genes. The Venn diagram showed that in the intersection part of the 5 profiles, the BIRC5 was the only up-regulated gene; ITIH5, HBB, and CDO1 were down-regulated genes (Figure 2).
Statistics of five gene chips derived from the GEO database.

Abbreviation: BC, breast cancer.
30 TNBC.
Contains 9 of carcinoma in situ of the breast and 5 of invasive breast cancer.
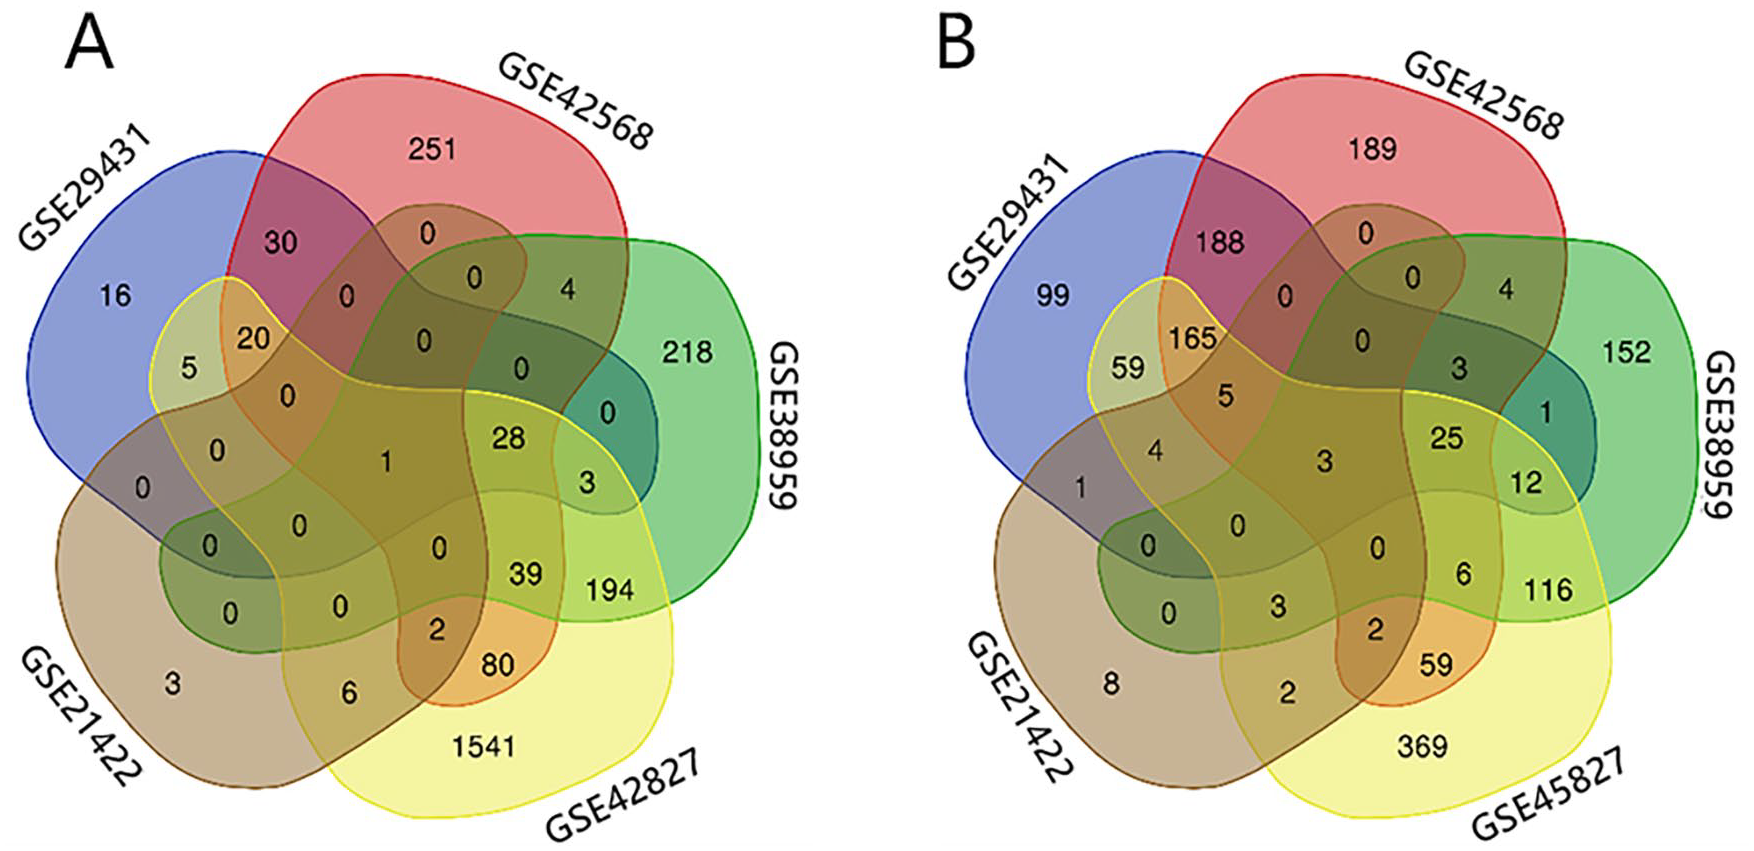
Venn diagram of DEGs shared by 5 microarray datasets. The intersecting parts of 5 DEGs were identified using the Venn diagram webtool. (A) Up-regulated genes and (B) down-regulated genes.
BIRC5 and CDO1mRNA expression differs widely between breast cancer tissue and non-tumor normal tissues
We first analyzed the above 4 DEGs on the GEPIA database, finding their expressions have significant differences between normal and breast cancer (Figure 3A). The mRNA expression of BIRC5 was significantly higher than that of normal tissues; the levels of CDO1, ITIH5, and HBB in tumor tissue were much lower than in normal tissue. Furthermore, the standardized N/T ratio of CDO1was higher than that of ITIH5 and HBB (Figure 3B), indicating the degree of differential CDO1 gene expression between normal and breast cancer tissue was larger than ITIH5 and HBB; therefore, ITIH5 and HBB were exclude. We further examined the mRNA expression of BIRC5 and CDO1 in the UALCAN database by comparing primary breast cancers and normal tissue; the results present the same trends (Figure 3C and D).

Expression of BIRC5 and CDO1 in breast cancer and the matched TCGA normal and GTEx data were analyzed using the GEPIA database. The density of color in each block represents the median expression value of a gene in a given tissue, normalized by the maximum median expression value across all blocks (A) . N/T, normal/tumor. The longer the blue bar graph, the lower the expression of the gene in normal tissues, and vice versa (B). Ualcan datasets show higher mRNA of BIRC5 and lower mRNA of CDO1 in breast cancer tissues than in normal tissues (P < .05) (C and D).
BIRC5 and CDO1 mRNA levels were highly associated with the clinicopathological parameters of breast cancer patients
The BIRC5 mRNA increased significantly with an advanced pathological stage (Figure 4A). Meanwhile, the CDO1 mRNA decreased sharply with an advanced pathological stage (Figure 4C). Compared to the expression in HER2 positive, luminal breast cancer tissues, and normal breast tissues, we observed BIRC5 was the highest expressed in TNBC (Figure 4B). CDO1 is also expressed differently in different breast cancer subtypes but much lower than normal breast tissues (Figure 4D).

BIRC5 and CDO1 mRNA expressions in different clinical stages and molecular subtyping groups of breast cancer. (A–D) Data from the UALCAN; (E–H) Data from the 48 patients’ breast cancer tissue of Hubei Cancer Hospital. Normal, normal tissue; n, number of cases; stage 1 to 4, clinical staging; luminal, HER2+; TNBC, molecular subtypes of breast cancer. *P < .05, **P < .01, ****P < .0001. ns, not significant.
Correlation of BIRC5 and CDO1 with the tumor purity and infiltrating immune cells in breast cancer tissue
The TIMER database analysis found that BIRC5 and CDO1 expression levels were associated with the tumor purity, and the number and type of immune cells infiltrated in invasive breast carcinoma tissue. BIRC5 was not correlated with the amount of tumor-infiltrated CD4+ T cells and CD8+ T cells but was positively correlated with tumor purity, B cells, neutrophil, and dendritic cells; negatively correlated with infiltrated macrophages. CDO1 mRNA expressions were positively associated with most immune cells, except B cells, but negatively correlated with tumor purity (Figure 5). Collectively, the higher CDO1 mRNA expressed, the more immune cells infiltrated in tumors.
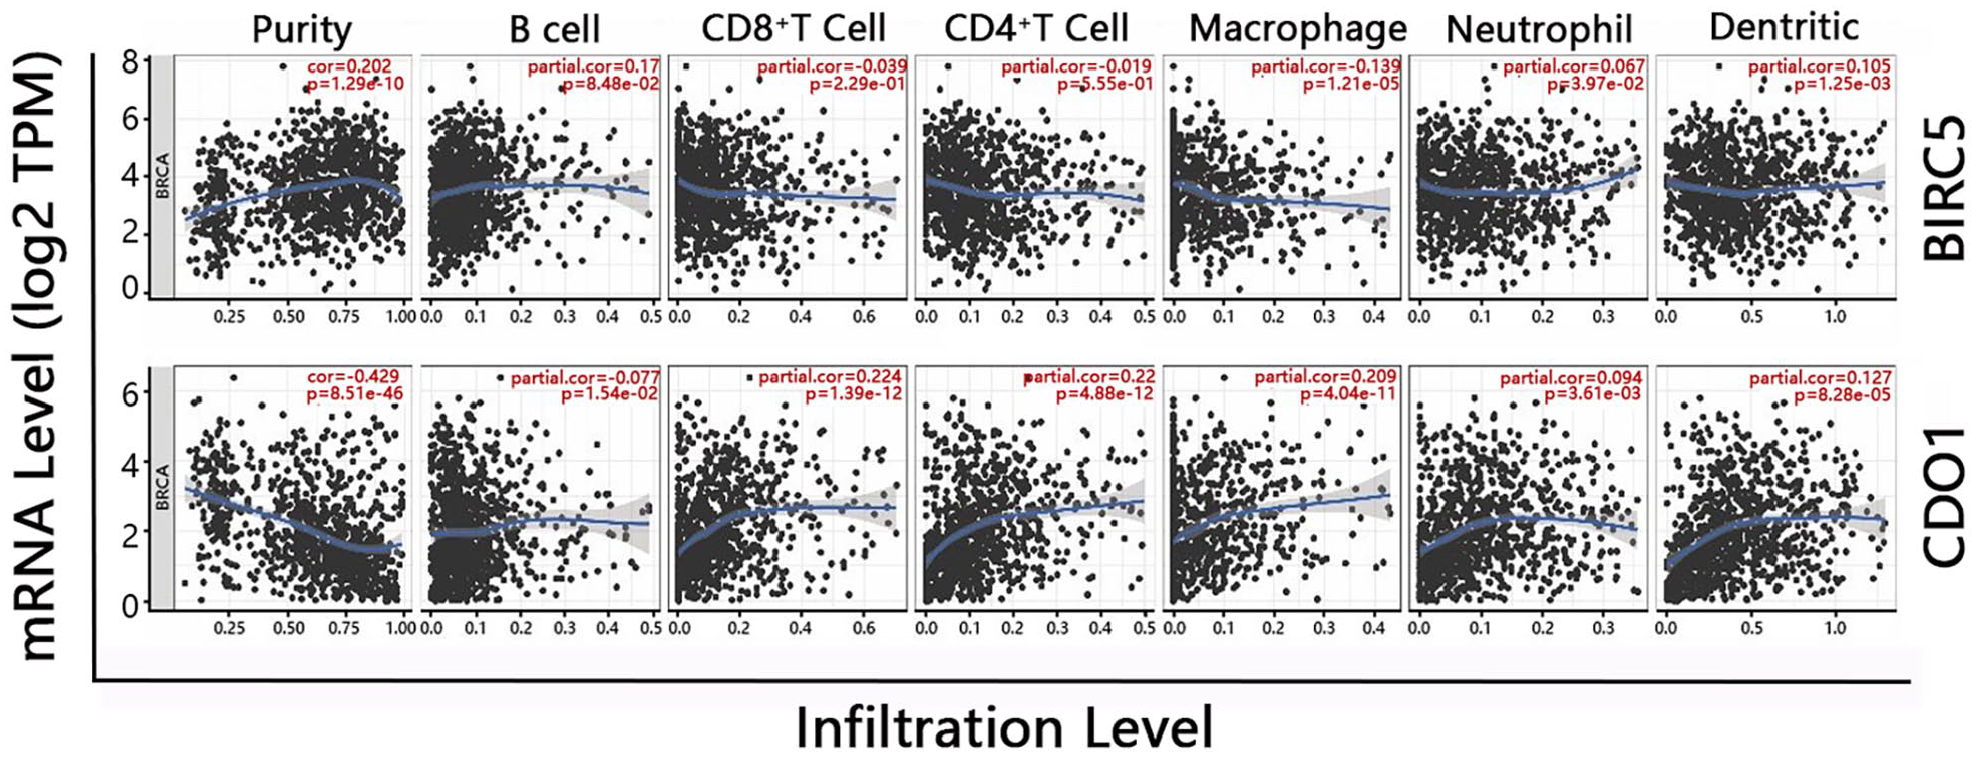
The TIMER platform evaluated the correlation of BIRC5 and CDO1 mRNA expression with tumor purity and immune cells infiltration in invasive breast cancer patients. Cor value: the regression coefficient in the Cox regression model. The minus value of Spearman’s correlation index denoted a negative correlation, while a positive value denoted a positive correlation. P < .05 means significant.
We also used the TIMER to analyze the relationship between the immunocyte’s surface markers and BIRC5 and CDO1 levels. Breast cancer tissue with high BIRC5 expressed high levels of inhibitory receptors of NK cells, including KIR2DL1, KIR2DL3, KIR3DL1, and KIR3DL2, as well as the activation receptors of Treg cells, including FOXP3, CD25. Additionally, CDO1 level correlated to both activations and inhibitory receptors of NK and Treg cells. BIRC5 is also positively correlated with CCR8 and negatively correlated with STAT5 but CDO1shows no relationship with CCR8 and positively correlated with STAT5 (Table 2).
The correlation of BIRC5 and CDO1 mRNA level to markers of immune cells.
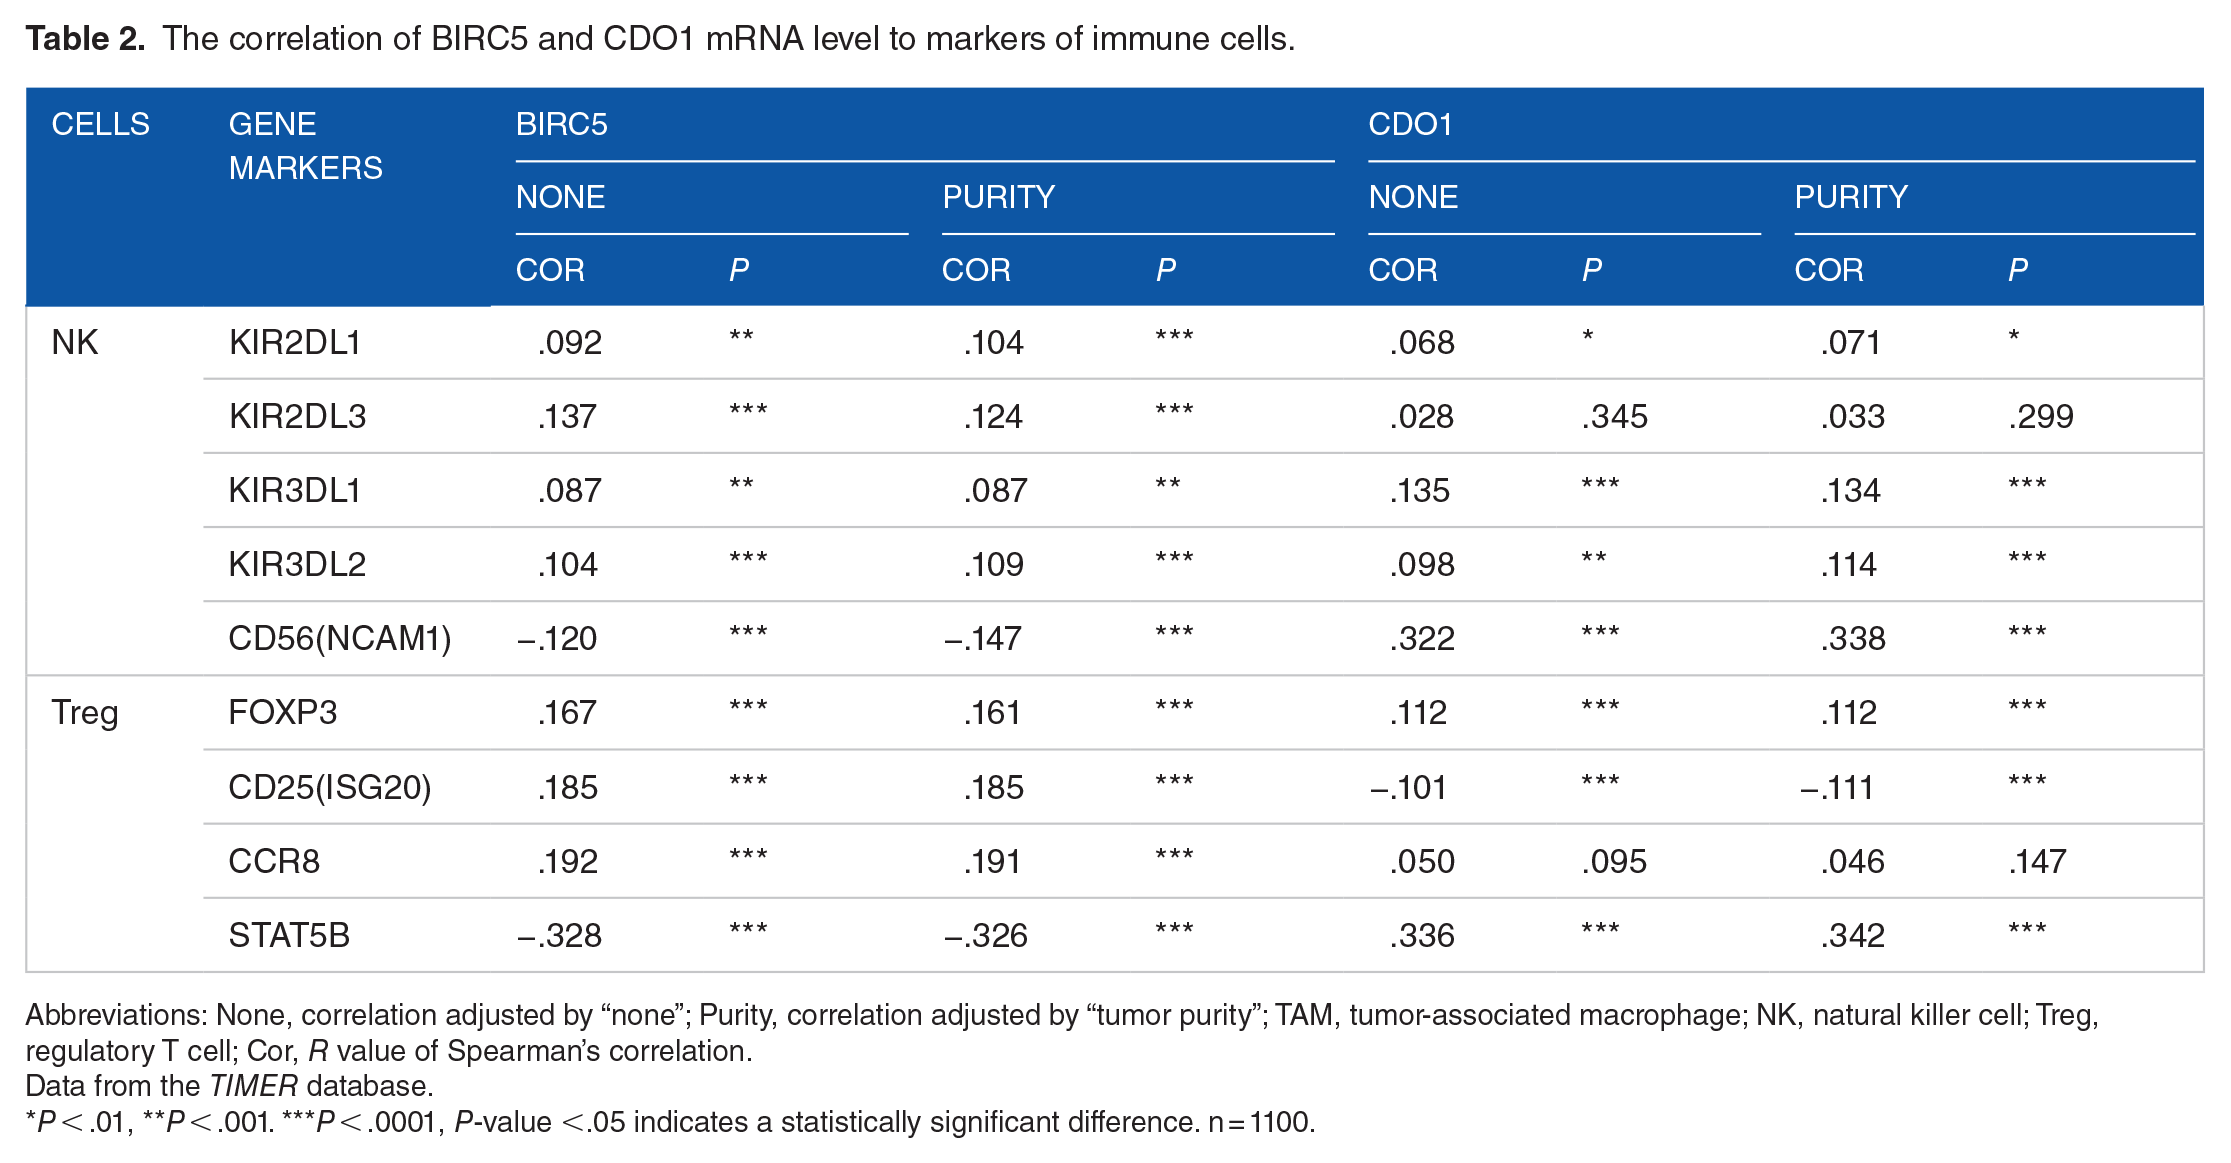
Abbreviations: None, correlation adjusted by “none”; Purity, correlation adjusted by “tumor purity”; TAM, tumor-associated macrophage; NK, natural killer cell; Treg, regulatory T cell; Cor, R value of Spearman’s correlation.
Data from the TIMER database.
P < .01, **P < .001. ***P < .0001, P-value <.05 indicates a statistically significant difference. n = 1100.
BIRC5 and CDO1 mRNA level is associated with RFS and OS of breast cancer patients
In the systemically untreated breast cancer patients, we analyzed gene-related OS in 392 patients and RFS in 1025 patients. For BIRC5-related OS analysis, the overall LED was −21.3 months (95% CI −37.6 to −5.0), indicating the life expectancy of BIRC5high patients is 21.3 months in average shorter than BIRC5low patients and reduced by 10% (LER is 0.9, 95% CI 0.82-0.97) (Figure 6A left); in the CDO1-related OS difference analysis, the overall LED was 45.4 months (95% CI 19.5-71.2) (Figure 6A right), meaning the life expectancy of CDO1high patients was 45.4 months longer than CDO1low patients and increased by 25% (LER is 1.25, 95% CI 1.09-1.43). Due to the survival curves occur crossing over in the RFS analysis, we estimated the LED and LER before and after the cross point to provide a more accurate assessment of life expectancy. Compared to the RFS in BIRC5low patients, the overall LED of the BIRC5high expression group was −12.5 months, the reduction was not statistically significant (P = 5.81e−02), However, before 190 months, the LED was −15.5 months, and LER was 0.90 with the statistically significant (Figure 6B left). It means the life expectancy of RFS only has a significant difference before 190 months between BIRC5high and BIRC5low patients. A similar analysis was conducted in CDO1-related RFS difference analysis; before 150 months, the LED was 16.4 months (LER was 1.01) with the statistically significant; after 150 months, the LED was 2.4 months (LER was 1.01) without the statistically significant (Figure 6B right).
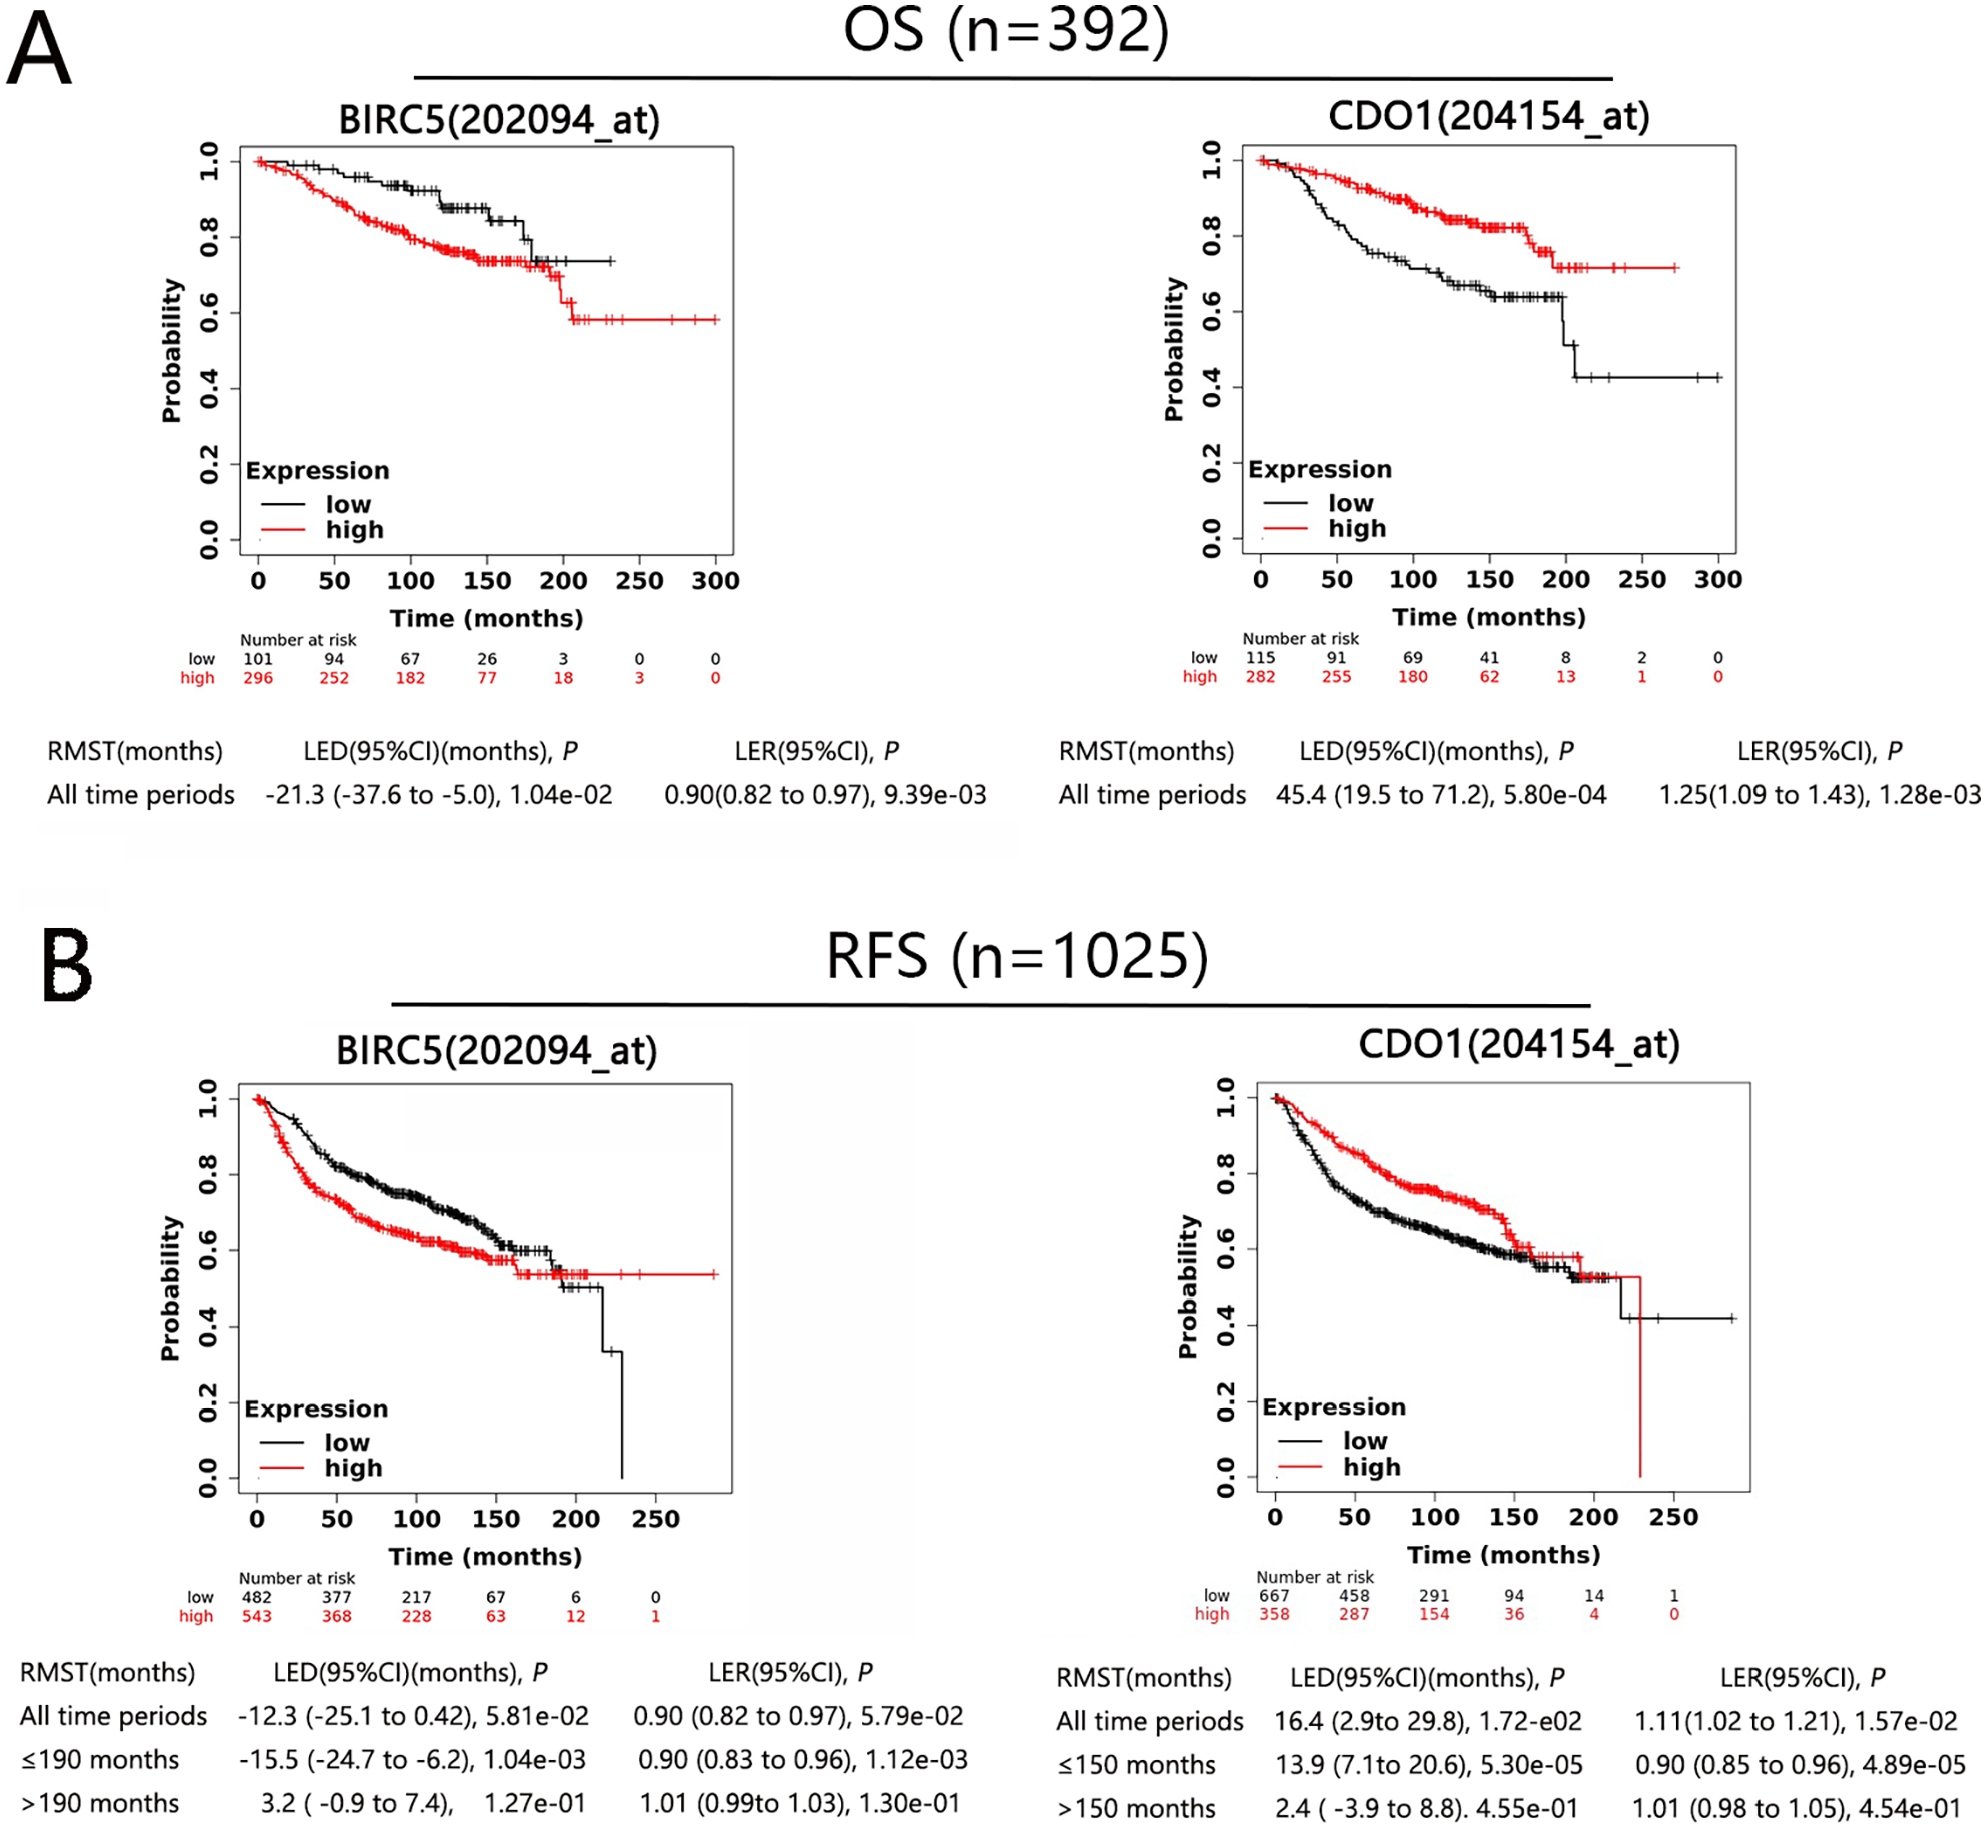
Survival curves derived from the Kaplan–Meier Plotter database evaluating the prognostic significance of BIRC5 and CDO1 in breast cancer patients. OS, overall survival rate (Figure 6A); RFS, progression-free survival rate (Figure 6B); RMST, restricted mean survival time; LED, life expectancy difference, LED is the difference between 2 RMSTs (RMST of high-level and low-level); LER, life expectancy ratio, LER is the ratio of the LED of 2 groups. CI, confidence interval; 202094_at, 204154_at, gene probe.
Additionally, we conducted a 2-way ANOVA test to study the influence of BIRC5 level and CDO level on OS and RFS in different clinic types of patients. In patients with all clinical types (Table 3), the level of BIRC5 and CDO1 had significant effects both on OS and RFS. BIRC5low patients lived 24.01 months in OS longer than BIRC5high patients (P = .005), and they lived 12.72 months longer in RFS (P = .016). These results were close to the results of LED and LER analysis of “all time period” in survival curve. The BIRC5 levels are also associated with survival in the patients with lymph node metastasis, the mean OS of BIRC5low patients is 10.85 months more than BIRC5high patients (P = 0.031), and the mean RFS of BIRC5low patients is 11.42 months more than BIRC5high patients; the mean RFS of CDO1low patients reduce by 4.07 months than CDO1high patients (P = .034). In the patients of TNBC, CDO1low patients show 10.64 months shorter mean OS compared to CDO1high patients (P = .032). Inconsistent with patients of the other subtypes, CDO1low patients in the Luminal A group present longer OS than CDO1high patients (P = .000)
The effect of BIRC5 and COD1 levels on OS and RFS in patients with different clinicopathological types, tested by 2-factor analysis of variance with post hoc Bonferroni testing.

Mean survival difference is the value of mean survival of low-level group patients minus the mean survival of high-level group patients. The positive values indicate the survival of low-level group patients is longer than the high-level group; a negative value means it is shorter than high-level group patients.
The statistical difference of the mean survival difference.
P < .05, **P < .01, # indicates all patients without systemic treatments.
Related biological processes and signaling pathways that BIRC5 and CDO1 may be involved in breast cancer
The results from a GSEA analysis base on the LinkedOmic database suggested that BIRC5 might be mainly involved in some critical biological processes, including spliceosome, complement, and coagulation cascade reactions, as shown in Figure 7A. CDO1 is primarily engaged in ABC transport and carbamyl tRNA biosynthesis (Figure 7B).

GSEA analysis using LinkedOmic database, revealing potential related biological processes correlated with the BIRC5 (Figure 7A) and CDO1 (Figure 7B). FDR, false discovery rate, was the correction for the P-value. FDR value ⩽0.05 indicates a statistically significant difference.
RT-qPCR validation of BIRC5 and CDO1 mRNA in 48 breast cancer patients
Among 48 patients, 24 had early-stage cancer (stages 0-II), and 24 had advanced cancer (stages III and over). Cancer staging was determined according to the eighth edition of the AJCC cancer staging manual. BIRC5 mRNA levels were significantly higher in breast cancer tissue of stages III and over when compared with other stages (Figure 4E), but BIRC5 levels were not different between groups of varying breast cancer molecular subtyping (Figure 4F). A significant difference was not found between the CDO1 mRNA expression and the degree of clinical staging of cancer (Figure 4G), but CDO1 levels in TNBC were much lower than HER-2+ subtyping cancer (Figure 4H, P < .05). The results of negative binomial regression showed the tumor tissue with a high-BIRC5 and low-CDO1 expression type indicates more lymph node metastasis of patients (Table 4).
The results of negative binominal regression analysis (n = 48).

Dependent variable: Number of lymph node metastasis. Values within parentheses are Z-values; BIRC5high CDO1low, gene expression type in tumor tissue.
P < .05, **P < .01.
Data availability statement
The datasets generated during and/or analysed during the current study are available in the Materials and Methods. Weblinks as follow: GSE29431, https://www.ncbi.nlm.nih.gov/geo/query/acc.cgi?acc=GSE29431, GSE42568, https://www.ncbi.nlm.nih.gov/geo/query/acc.cgi?acc=GSE42568 GSE38959, https://www.ncbi.nlm.nih.gov/geo/query/acc.cgi?acc=GSE38959 GSE45827, https://www.ncbi.nlm.nih.gov/geo/query/acc.cgi?acc=GSE45827 GSE21422, https://www.ncbi.nlm.nih.gov/geo/query/acc.cgi?acc=GSE21422 GEPIA, http://gepia.cancer-pku.cn/ UALCAN, http://ualcan.path.uab.edu TIMER, https://cistrome.shinyapps.io/timer/ Kaplan-Meier Plotter, https://kmplot.com/analysis/ LinkedOmics, http://linkedomics.org/admin.php
Discussion
Late distant metastasis is the leading cause of patients’ mortality of breast cancer. The metastatic ability of cancer cells is associated with the speed of proliferation, invasion, and apoptosis of tumor, as well as immune cell infiltration of tumor tissue. Our results show the BIRC5 and CDO1 gene expressions are significantly associated with breast cancer outcomes, cancer tissue with high-level of BIRC5, and low-level of CDO1 were shower shorter OS and RFS, especially in the patients with lymph node metastasis. Therefore, they might serve as a group of prognostic markers for patients with breast cancer.
BIRC5, also called Survivin, is a component of the chromosomal passenger complex. BIRC5 is considered a protein with dual roles that interfaces cell proliferation and apoptosis. We observed invasive ductal carcinoma or lobular breast cancer, intraductal cribriform breast adenocarcinoma, and medullary breast cancer showing higher BIRC5 levels than non-neoplastic breast tissue.
Consistent with previous studies, our study found the mRNA expression of BIRC5 remarkably correlated with patients’ cancer clinical stages and a strong correlation between elevated BIRC5 expression and poor RFS in patients with breast cancer. The potential mechanism might be as follows: firstly, in the normal tissue, p53 inhibits BIRC5 expression by preventing the BIRC5 promoter from HIF (hypoxia-inducing factor) binding, whereas mutant p53 proteins lose this effect of inhibition, up-regulating the BIRC5 expression in tumor tissue. 31 Secondly, epigenetic regulation, including hypomethylation of BIRC5 and acetylation of histone H3, may decrease BIRC5 during cancer progression 32 Additionally, BIRC5 is also an autophagy-related gene, the inactivation of autophagy results in shorter survival. 33
Interestingly, in the cancer tissue with a high level of BIRC5, we found an increase of inhibitory NK cell receptors (KIR2DL1, KIR2DL3, KIR3DL1, KIR3DL2) accompanied by an increase of Foxp3 and CD25 of Treg cells. It suggests the patients might have a weak NK cell function and augmented Treg cell function. Meanwhile, we also found a high BIRC5 level was negatively associated with STAT5B level in breast cancer tissue, which is consistent with the report that the STAT5 activating is required to maintain high FOXP3 expression and suppressive activity of Treg cells in vitro. 34 Both the inhibition of NK cells and the activation of Treg cells can well explain the poorer OS and RFS in patients.
Due to the complex etiology and clinical phenotypes of breast cancer, BIRC5 is unlikely to be reasonable in predicting patient outcomes as a single biomarker. Here, we sought to find an auxiliary indicator to guide clinical decision-making. Differs from BIRC5, normal tissue expresses more CDO1 gene than that in breast cancer tissues. The low expression of CDO1 was associated with poor OS and RFS in patients. With the increase of tumor stage, the CDO1 mRNA expressions tended to decrease. CDO1 protein is an iron-containing metalloenzyme with a non-heme structure, converting cysteine to cysteine sulfonic acid (CSA). 35 It can inhibit the generation of glutathione in breast cancer cells, leading to the increase of ROS and promote cell apoptosis. 36 One study confirms the high methylation level of CDO1’s promoter region was associated with poor cancer prognosis. 37 and they suggested the CDO1 promoter methylation level could be an epigenetic indicator prognosis. Our results revealed the correlation between the CDO1 level and the immunocytes infiltration in the tumor, indicating that the more the expression of CDO1, the stronger the body’s immune function. In contrast to BIRC5, CDO1 mRNA level highly positively correlated with activation of CD8+T cells and DCs, which indicates that patients with higher CDO1 had a more robust adaptive immune response. Therefore, it is reasonably explained high CDO1 is related to a good prognosis.
The results of our RT-qPCR validation experiments partly correspond with those reported in the GEPIA and UALCAN databases. We found BIRC5 expression was increased significantly, but CDO1 expression was not decreased in advanced cancer compared to early cancer. Moreover, BIRC5 expressions have no significant differences among luminal, HER2+, and TNBC molecular subtypes groups, but CDO1 expressions in TNBC were lower than that in HER2+ breast cancer. Among the 48 patients in validation experiments, we found the patients with a high-BIRC5 and low-CDO1 expression type in cancer tissue showed more lymph nodes metastasis than other patients, which confirmed the results of BIRC5 and CDO1 levels are significantly associated with survival in the patients with lymph node metastasis in Table 3. However, the limited sample size may be the reason for the inconsistency to database, and we will continue to monitor the survival of these patients.
In conclusion, BIRC5 and CDO1 monitoring could help clinicians predict a patient’s prognostic outcome more accurately and develop the most effective personalized therapeutic strategy earlier. The combined detection of BIRC5 and CDO1 had higher sensitivity compared to the single index. In addition to reflecting the potential metastasis ability of cancer cells, the dual predictors also reflect the strength of the body’s anti-tumor immune response. However, our research also has its limitation, the results of GSEA analysis exhibit biology behaviors of BIRC5 and CDO1 involved in breast cancer cells. Still, signal pathways with maximum relevance with 2 genes are not associated with cell proliferation, migration, and invasion. It could not explicitly address how BIRC5 and CDO1 promoted/inhibited malignant breast cancer cells. These results are not closely related to our other works. More large-scale and well-designed trials are needed to reveal their potential connection.
Supplemental Material
sj-pdf-1-cix-10.1177_11769351221096655 – Supplemental material for A BIRC5High COD1Low Cancer Tissue Phenotype Indicates Poorer Prognosis of Metastatic Breast Cancer Patients
Supplemental material, sj-pdf-1-cix-10.1177_11769351221096655 for A BIRC5High COD1Low Cancer Tissue Phenotype Indicates Poorer Prognosis of Metastatic Breast Cancer Patients by Yujie Bai, Feng Yuan, Jing Yu, Yibei Si, Yiwen Zheng and Dongqing Li in Cancer Informatics
Footnotes
Acknowledgements
We acknowledge GEPIA, TCGA, GEO database, UALCAN, TIMER, Kaplan-Meier plot, and LinkedOmics to provide their platforms and contributors for uploading their meaningful datasets. We are grateful to the Biobank of Hubei cancer Hospital for providing tissue samples.
Funding:
The author(s) disclosed receipt of the following financial support for the research, authorship, and/or publication of this article: This study was funded by the National Natural Science Foundation of China (grant number 81772839); the National Science Foundation of Hubei Province (grant number 2014CFB158).
Declaration of Conflicting Interests:
The author(s) declared no potential conflicts of interest with respect to the research, authorship, and/or publication of this article.
Author Contributions
All authors contributed to data analysis. Performed experiments: Bai Y and Yuan F; Wrote the paper: Li D and Bai Y.
Supplemental Material
Supplemental material for this article is available online.
References
Supplementary Material
Please find the following supplemental material available below.
For Open Access articles published under a Creative Commons License, all supplemental material carries the same license as the article it is associated with.
For non-Open Access articles published, all supplemental material carries a non-exclusive license, and permission requests for re-use of supplemental material or any part of supplemental material shall be sent directly to the copyright owner as specified in the copyright notice associated with the article.